Pertanika J. Trop. Agric. Sci. 40 (1): 185 - 202 (2017)
ISSN: 1511-3701 © Universiti Putra Malaysia Press
TROPICAL AGRICULTURAL SCIENCE
Journal homepage: http://www.pertanika.upm.edu.my/
Article history:
Received: 26 May 2016 Accepted: 10 November 2016 ARTICLE INFO
E-mail addresses:
[email protected] ; [email protected] (Sianipar, N. F.), [email protected] (Purnamaningsih, R.),
[email protected] (Gumanti, D. L.), [email protected] (Rosaria), [email protected] (Vidianty, M.) * Corresponding author
Analysis of Gamma Irradiated-Third Generation Mutants
of Rodent Tuber (
Typhonium flagelliforme
Lodd.) Based on
Morphology, RAPD, and GC-MS Markers
Sianipar, N. F.1*, Purnamaningsih, R.2, Gumanti, D. L.3, Rosaria3, and
Vidianty, M.3
1Research Interest Group Food Biotechnolgy, Bina Nusantara University, Jl. Jalur Sutera Barat Kav. 21,
Alam Sutera, 15325 Tangerang, Indonesia
2Indonesian Center for Agricultural Biotechnology and Genetic Resources Research and Development
(BB-Biogen), 16111 Bogor, Indonesia
3Alumni of Biology Department, Faculty of Science and Technology, Pelita Harapan University,
15811 Tangerang, Indonesia
ABSTRACT
Rodent tuber is an anticancer plant. The natural genetic diversity of rodent tuber is low due to vegetative propagation. It is important to increase the plant’s genetic diversity in order to obtain plants with a high amount of anticancer compounds. In vitro calli were
irradiated with gamma rays to increase its genetic diversity. Seventeen clones of the first
generation of vegetative mutants in a green house (MV1) were propagated until MV3. This research aimed to analyse the stability of mutation in MV3 based on morphology, RAPD and GC-MS markers. Clone 6-1-2 had the highest increase of shoots and leaf number than the control and the other MV3 clones while clone 6-1-3-4 had the highest fresh and dry weight. RAPD analysis using 15 primers produced 67 polymorphic DNA bands and showed
four main clusters at the similarity coefficient cut-off of 0.87. The GC-MS showed that
MV3 contained at least eight types of anticancer compound in the leaves and six types in the tubers; these were higher than in the control. MV3 leaves and tubers contained at least eight new anticancer compounds that were not found in the control. This research proved that rodent tuber MV3 clones were solid mutants and had a high potential for being developed into anticancer drugs.
Keywords: anticancer compounds, gamma irradiation, GC-MS, morphology, RAPD, Typhonium flagelliforme
.
186 Pertanika J. Trop. Agric. Sci. 40 (1) 186 - 202 (2017) INTRODUCTION
Rodent tuber (Typhonium flagelliforme
Lodd.) is a herbal plant from the Araceae f a m i l y ( E s s a i , 1 9 8 6 ) t h a t c o n t a i n s
detoxification and anticancer compounds.
Rodent tuber is a plant native to Indonesia and has been used as traditional medicine for years. Bioactive compounds of rodent tuber are alkaloids, saponins, steroids and glycosides (Syahid, 2007). Anticancer compounds can be found in all parts of the rodent tuber plant, including the root, tuber, stem and leaf (Choo et al., 2001).
Rodent tuber has been reported to be cytotoxic against cancer of the lung, breast (Lai et al., 2010), liver (Lai et al., 2008), blood (leukemia) (Mohan et al., 2010), colon, prostate gland and cervix (Hoesen, 2007). Rodent tuber extract has also been reported to be able to prevent breast and cervical cancers (Syahid & Kristina, 2007). Rodent tuber hexane extract was toxic against Artemia salina (Sianipar et al., 2013a). Other biological activities of rodent tuber have been found to be antibacterial and antioxidant (Mohan et al., 2008) and able to induce apoptosis of cancer cells (Lai et al., 2008).
The development of Indonesian rodent tuber into anticancer drugs was inhibited by its low genetic diversity, which is caused by the conventional clonal vegetative propagation method. Low genetic diversity is followed by low bioactive compound diversity in rodent tuber (Syahid, 2008). Mutation induction of in vitro somatic cell population (calli) or shoot culture could increase its genetic diversity, which in turn
might increase the probability of generating plant clones that contain a higher amount of anticancer compounds. Mutation can be induced by irradiation with physical mutagens such as gamma ray.
Genetic diversity can be analysed using molecular markers such as RAPD, RFLP, AFLP and SSR (Powell et al., 1996). The Randomly Amplified Polymorphic DNA (RAPD) marker is able to detect genetic diversity of a plant whose genome has not been sequenced yet (McClelland et al., 1994), such as rodent tuber. Genetic characterisation of a plant’s germplasm is essential for harnessing the maximum potency of the plant’s genetic diversity (Rout, 2006).
Embryogenic calli of rodent tuber plant have been induced, proliferated and regenerated using the single node culture method (Sianipar et al., 2011). Rodent tuber mutant clones have also been successfully generated by combining the effects of gamma irradiation with somaclonal in vitro
culture variation. A somatic cell population (calli) of rodent tuber was irradiated with 6-Gy gamma rays. The irradiated in vitro
plantlets exhibited various growth responses (Sianipar et al., 2013b). Those irradiated in vitro plantlets (mutant) and control plants were found to have genetic differences based on analysis with RAPD molecular markers (Sianipar et al., 2015a).
Thirty-seven clones of first generation
Rodent Tuber (Typhonium flagelliforme Lodd.) Mutant Analysis
187 Pertanika J. Trop. Agric. Sci. 40 (1): 187 - 202 (2017)
characteristics (Sianipar et al., 2013c). Out of those 37 MV1 clones, there were 17
that had a diversified genetic profile and
showed genetic differences from the control plants based on RAPD molecular analysis (Sianipar et al., 2015b).
Genetic mutation might also affect the relative abundance of bioactive compounds. Gas Chromatography-Mass Spectrometry (GC-MS) is a method for analysing the metabolomic profile of an organism. GC utilises gas as the mobile phase to separate chemical compounds. GC is able to separate a lot of compounds in one run and can be combined with MS to identify the compounds based on the database (Kayser & Quax, 2007). Rodent tuber MV1 clones were propagated and regenerated into MV3 clones. This research aimed to analyse the third generation of vegetative mutant clones of rodent tuber (MV3) based on morphological analysis, molecular
marker with RAPD profiling and GC-MS to
identify the relative abundance of bioactive compounds.
MATERIALS AND METHODS
Plant Material
This research analysed the third generation of vegetative mutant clones of rodent tuber (MV3) (in the patenting process). Rodent tuber mother plants were obtained from Bogor (West Java, Indonesia).
Morphological Characterisation
The parameters of observation were the number of shoots, number of leaves, plant
height and fresh and dry weight of the rodent tuber control and mutant plants. Morphological characteristics were analysed using the NTSYS DIST coefficient and UPGMA.
Molecular Analysis with RAPD Marker
DNA isolation was done based on Doyle and Doyle (1987). In this method, 2.5 g of leaf sample was homogenised with PVP
0.1% and liquified nitrogen. A volume of
2 mL of CTAB buffer (CTAB 10% b/v, EDTA 0.5 M pH 8.0, Tris-HCl 1M pH 8.0,
NaCl 5M) and 10 μL of 1-merkaptoetanol
1% (b/v) was added to the sample powder. The sample was homogenised with vortex, incubated at 60°C for 20 min and cooled
at room temperature. About 750 μl of
chloroform:isoamyl alcohol (24:1) solution was added to the sample and then vortexed. The sample was centrifuged at 11.000 rpm for 10 min. A supernatant was added to 1 mL of chloroform:isoamyl alcohol (24:1) and centrifuged at 11.000 rpm for
10 min. About 750 μL of cold isopropanol,
homogenised and stored at -20°C for one night was added to the supernatant. The sample was centrifuged at 11.000 rpm for 10 min. A DNA precipitate was dried in a vacuum for one h. The dried DNA sample
was solubilised in 200 μL of buffer TE
(Tris-HCl 1M pH 8.0; EDTA 0.5M pH 8.0).
About 200 μL of DNA solution was added to 20 μL of RNase (10 mg/mL) and incubated
at 37°C for one h. DNA was incubated at 4°C for one night. DNA solution was stored at -20°C. The DNA sample was
.
188 Pertanika J. Trop. Agric. Sci. 40 (1) 188 - 202 (2017) the Thermal Cycler Gene PCR (ABI 9700).
The composition of 1x PCR reaction was 5 µL of the DNA template (5 ng/µL), 0.2 µL of dNTP 0.2 mM, 2.5 µL of PCR buffer + MgCl2 (1x), 1 µL of 10 pmol primer, 0.2
µL of 1U Taq polymerase and 16.1 µL of ddH2O with a total volume of 25 µL. The
PCR reaction thermal cycle was repeated 45 times in stages as follows: 94°C for one min, 36°C for one min, 72°C for 2 min and 72°C for 4 min. Extension time was conditioned at 72°C for 4 min. PCR product was fractionated by electrophoresis method in 1.4% agarose gel (w/v) submerged in 40 mL of 1x TAE. Electrophoresis was run at 75 volt for 1.5 h. Agarose gel was submerged in ethidium bromide solution for 10 min and washed with distilled water. Electrophorised gel was visualised under UV light and documented with Kodak gel logic. PCR-RAPD for each sample was replicated at least three times. The size of DNA bands was determined by comparison with 1 kb DNA ladder. Quantitative data were standardised based on Steel and
Torrie’s (1981) findings. The molecular data
of the DNA bands were converted to binary numbers (0 and 1) and formulated in matrix. The relationship between mutant clones was analysed using SHAN clustering UPGMA. Genetic distance and clone grouping were determined using NTSYS ver. 1.70. The similarity index used in this research was Jaccard’s (1901) Version 2.4. Chemical Compounds Analysis with GC-MS.
The leaves (including the stem) and tubers of rodent tuber were macerated in 96% ethanol. Extraction was done twice
with a sonificator and incubated at room
temperature for 48 h. The extracts were filtered with Whatman filter paper and analysed with a GC-MS detector. A volume of 5 µL of extract was injected into the column at a split ratio of 5:1 at 250°C. Helium was used as a carrier gas with a flow rate of 0.8 µL/minute. The initial column oven temperature was 70°C. It was then increased at a rate of 5°C/min until the temperature reached 200°C, after which it was stabilised for 1 min and then increased at the rate of 20°C/min until it reached 280°C for 28 min. The mass spectrometer was adjusted at electron impact ionisation mode at a voltage of 70 eV. Chemical
compounds were identified by comparing the MS fragmentation pattern profile with
the NIST database.
RESULTS AND DISCUSSION
Morphological Characterisation
Morphological characteristics, specifically
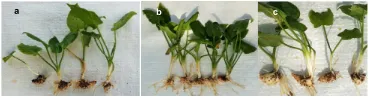
the number of shoots, number of leaves, plant height and the fresh and dry weight of 17 MV3 clones were different from those of the control plants (Figure 1 and Table 1). After eight weeks, clone 6-1-2 was found to have the highest increase in shoot (4.5) and leaf number (15) compared to the control and the other MV3 clones. Clone 6-3-2-5
Figure 1. MV3 clones after eight weeks of growing in a green house. a: 6-3-2-5; b: 6-1-1-2; c: 6-9-1
Figure 1. MV3 clones after eight weeks of growing in a green house.
Rodent Tuber (Typhonium flagelliforme Lodd.) Mutant Analysis
189 Pertanika J. Trop. Agric. Sci. 40 (1): 189 - 202 (2017)
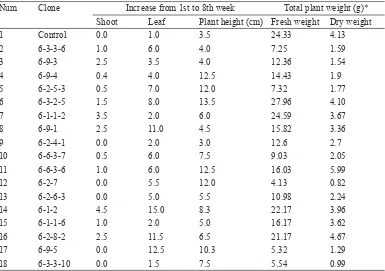
Table 1
Morphological Characteristics of MV3 Clones and Control Plants
Num Clone Increase from 1st to 8th week Total plant weight (g)* Shoot Leaf Plant height (cm) Fresh weight Dry weight
1 Control 0.0 1.0 3.5 24.33 4.13
2 6-3-3-6 1.0 6.0 4.0 7.25 1.59
3 6-9-3 2.5 3.5 4.0 12.36 1.54
4 6-9-4 0.4 4.0 12.5 14.43 1.9
5 6-2-5-3 0.5 7.0 12.0 7.32 1.77
6 6-3-2-5 1.5 8.0 13.5 27.96 4.10
7 6-1-1-2 3.5 2.0 6.0 24.59 3.67
8 6-9-1 2.5 11.0 4.5 15.82 3.36
9 6-2-4-1 0.0 2.0 3.0 12.6 2.7
10 6-6-3-7 0.5 6.0 7.5 9.03 2.05
11 6-6-3-6 1.0 6.0 12.5 16.03 5.99
12 6-2-7 0.0 5.5 12.0 4.13 0.82
13 6-2-6-3 0.0 5.0 5.5 10.98 2.24
14 6-1-2 4.5 15.0 8.3 22.17 3.96
15 6-1-1-6 1.0 2.0 5.0 16.17 3.62
16 6-2-8-2 2.5 11.5 6.5 21.17 4.67
17 6-9-5 0.0 12.5 10.3 5.32 1.29
18 6-3-3-10 0.0 1.5 7.5 5.54 0.99
* Fresh and dry weight were cumulative of root, leaf, stem, tuber and flower weight
had the highest increase in plant height (13.5 cm) compared to the control and the other MV3 clones. Clone 6-3-2-5 had the highest fresh weight (27.96 gr), while clone 6-6-3-6 had the highest dry weight (5.99 gr) compared to the control and the other MV3 clones. Thus, based on morphological characterisation, MV3 clones were able to produce the higher biomass (number of shoots, number of leaves and plant height) compared to the control (Table 2).
The morphological characteristics of the rodent tuber control and MV3 clones were analysed using the NTSYS programme to generate relative similarity between the clusters. The dendrogram showed six
clusters at the similarity coefficient cut-off
of 0.73 (Figure 2). Clones in one cluster had a short genetic distance between one another based on morphological observation.
Figure 2. A dendrogram of MV3 clones based on morphological characteristics. The dendrogram was made from binary scores of the number of shoots, number of leaves and plant height data using the
NTSYS software at the similarity coefficient cut-off
of 0.73
.
190 Pertanika J. Trop. Agric. Sci. 40 (1) 190 - 202 (2017) Table 3 shows the similarity coefficient
matrix, which represents the genetic distance between the mutant clones based on morphological characteristics. A similarity
coefficient of 1.00 (100%) indicates that
there is no genetic difference, while one lower than 0.95 (95%) indicates that there is genetic difference between two mutant clones. Based on the morphological analysis, MV3 clones 6-3-2-5, 6-6-3-6, 6-1-2 and 6-2-8-2 were shown to have the lowest genetic similarity (33%) to the control, while MV3 clone 6-2-4-1 showed 100% similarity to the control. The other MV3 clones had 56% (nine clones) and 78% (three clones) genetic similarities to the control. According to this research, gamma irradiation at a dose of 6 Gy was able to increase the number of shoots, number of leaves and plant height of rodent tuber MV3 clones compared to the control plants (Table 1). The observed increase in the MV3 plant’s biomass compared to that
of the control is a crucial beneficial factor for
commercial production of medicinal plants. Gamma irradiation could induce the release of free radicals in plant cells; this induces somatic genetic cross-over, DNA
sequence modification and chromosomal
a b e r r a t i o n ( c h a n g e s i n t h e n u m b e r and structure of chromosome). These genetic modifications alter the structure and metabolism of a plant as well as its morphological characteristics (Kovacs & Keresztes, 2002). A low dose of gamma irradiation has also been able to induce morphological alteration of potato plants (Afrasiab & Iqbal, 2010). The diversity of morphological characteristics observed between MV3 clones (Figure 2 and Table 3) was due to random mutation induced by gamma irradiation, which could change a gene’s structure and function in a different way in different plants (Surya & Soeranto, 2006; Pillay & Tenkouano, 2011).
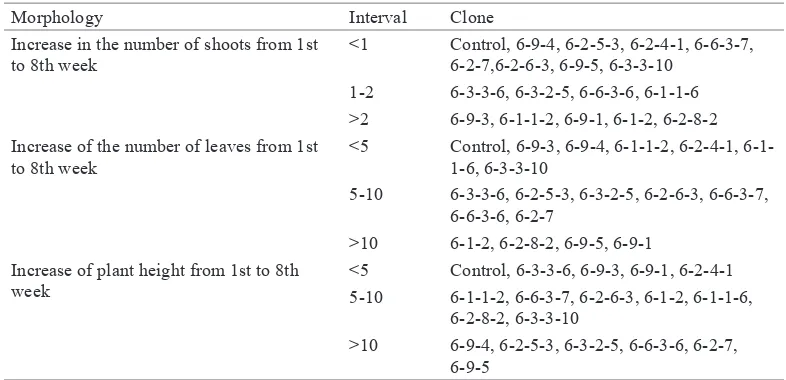
Table 2
Grouping of MV3 Clones Based on Morphological Characteristics
Morphology Interval Clone
Increase in the number of shoots from 1st to 8th week
<1 Control, 6-9-4, 6-2-5-3, 6-2-4-1, 6-6-3-7, 6-2-7,6-2-6-3, 6-9-5, 6-3-3-10
1-2 6-3-3-6, 6-3-2-5, 6-6-3-6, 6-1-1-6 >2 6-9-3, 6-1-1-2, 6-9-1, 6-1-2, 6-2-8-2
Increase of the number of leaves from 1st to 8th week
<5 Control, 6-9-3, 6-9-4, 1-2, 6-2-4-1, 6-1-1-6, 6-3-3-10
5-10 6-3-3-6, 6-2-5-3, 6-3-2-5, 6-2-6-3, 6-6-3-7, 6-6-3-6, 6-2-7
>10 6-1-2, 6-2-8-2, 6-9-5, 6-9-1 Increase of plant height from 1st to 8th
week
<5 Control, 6-3-3-6, 6-9-3, 6-9-1, 6-2-4-1
5-10 6-1-1-2, 6-6-3-7, 6-2-6-3, 6-1-2, 6-1-1-6, 6-2-8-2, 6-3-3-10
Rodent T
uber
(
Typhonium flagelliforme
Lodd.) Mutant
Analysis
191
Pertanika J.
T
rop.
Agric. Sci. 40 (1): 191 - 202 (2017)
Table 3
Genetic Similarity Matrix of MV3 Clones Based on Morphological Characterictics
Kontrol 6-3-3-6 6-9-3 6-9-4 6-2-5-3 6-3-2-5 6-1-1-2 6-9-1 6-2-4-1 6-6-3-7 6-6-3-6 6-2-7 6-2-6-3 6-1-2 6-1-1-6 6-2-8-2 6-9-5 6-3-3-10
Kontrol 1.00
6-3-3-6 0.56 1.00
6-9-3 0.78 0.56 1.00
6-9-4 0.78 0.33 0.56 1.00
6-2-5-3 0.56 0.56 0.33 0.78 1.00
6-3-2-5 0.33 0.78 0.33 0.56 0.78 1.00
6-1-1-2 0.56 0.33 0.78 0.56 0.33 1.00
6-9-1 0.56 0.56 0.78 0.33 0.33 0.33 0.56 1.00
6-2-4-1 1.00 0.56 0.78 0.78 0.56 0.33 0.56 0.56 1.00
6-6-3-7 0.56 0.56 0.33 0.56 0.78 0.56 0.56 0.33 0.56 1.00
6-6-3-6 0.33 0.78 0.33 0.56 0.78 1.00 0.33 0.33 0.33 0.56 1.00
6-2-7 0.56 0.56 0.33 0.78 1.00 0.78 0,33 0.33 0.56 0.78 0.78 1.00
6-2-6-3 0.56 0.56 0.33 0.56 0.78 0.56 0.56 0.33 0.56 1.00 0.56 0.78 1.00
6-1-2 0.33 0.33 0.56 0.33 0.33 0.33 0.78 0.78 0.33 0.56 0.33 0.33 0.56 1.00
6-1-1-6 0.56 0.56 0.56 0.56 0.33 0.56 0.78 0.33 0.56 0.56 0.56 0.33 0.56 0.56 1.00
6-2-8-2 0.33 0.33 0.56 0.33 0.33 0.33 0.78 0.78 0.33 0.56 0,33 0.33 0.56 1.00 0.56 1.00
6-9-5 0.56 0.33 0.33 0.78 0.78 0.56 0.33 0.56 0.56 0.56 0.56 0.78 0.56 0.56 0.33 0.56 1.00
.
192 Pertanika J. Trop. Agric. Sci. 40 (1) 192 - 202 (2017) According to Van Harten (1998), the
normal irradiation doses that are commonly applied to plant cells were at the range of 5-100 Gy. Morphological diversity, which is induced by gamma irradiation, has also been observed in mutant plants of yardlong bean [Vigna unguiculata (L.) Walp.], whose number of shoots, number of leaves and plant height were higher compared to those of the control plants (Gnanamurthy et al., 2012). Potato var. Silana (Hamideldin & Hussin, 2013) and soybean (Mudibu et al., 2012), which had been induced by gamma irradiation also had higher plant height compared to controls. However, gamma irradiation at doses of 5-24 Gy on ginger vegetative plants (Zingiber officinale) (Rashid et al., 2013) and at doses of 10 and 20 Gy on Curcuma alismatifolia (Taheri et al., 2014) resulted in a lower number of leaves and shorter plants compared to the controls. Like MV1 clones (Sianipar et al., 2013c), MV3 clones also had morphological variations due to gamma irradiation (Table 3). Besides genetic mutation, environmental factors also influence morphological characteristics. Therefore, morphological characterisation should be accompanied with molecular marker analysis in order to obtain a more accurate estimation of genetic diversity.
RAPD Molecular Marker Analysis
The concentration of DNA extracts was between 641.70 and 4246.8 ng/µL. The OD260/OD280 ratio was between 1.8 and
2.0, which indicated that the extracts
were relatively pure (without RNA or protein) (Sinden, 1994). PCR-RAPD of rodent tuber’s DNA extracts was done using 15 primers (Table 4), which had also been used for research on the other plants from Typhonium genus (Acharya et al., 2005). Primers used in this research were reproducible according to previous RAPD
profile analyses of rodent tuber MV1 clones
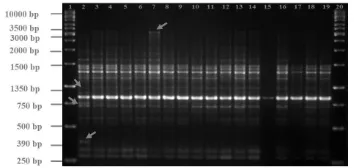
(Sianipar et al., 2015b). There were 67 polymorphic bands (190-3000 bp) out of the total 132 bands produced by 15 primers. The OPB-18 primer produced the highest number of polymophic bands as well as total bands compared to the other primers.
Specifically, the OPB-18 primer produced
14 polymorphic bands out of the total 15
DNA bands. RAPD amplification of MV3
with OPB-18 primer produced polymorphic bands at 390 bp, 750 bp, 1350 bp and 3000
bp (Figure 3). The RAPD profile of OPB-18
primer revealed that MV3 clones had new DNA bands but also underwent the loss of
DNA bands compared to the RAPD profile
of control plants.
Figure 3. RAPD profile of MV3 clones amplified with OPB-18 primer. 1: Marker 1 kb; 2: Control; 3: 6-3-3-6; 4: 6-9-3; 5: 6-9-4; 6: 6-2-5-3; 7: 6-3-2-5; 8: 6-1-1-2; 9: 6-9-1; 10: 6-2-4-1; 11: 6-6-3-7; 12: 6-6-3-6; 13: 6-2-7; 14: 6-2-6-3; 15: 6-1-2; 16: 6-1-1-6; 17: 6-2-8-2; 18: 6-9-5; 19: 6-3-3-10; 20: Marker 1 kb
Rodent Tuber (Typhonium flagelliforme Lodd.) Mutant Analysis
193 Pertanika J. Trop. Agric. Sci. 40 (1): 193 - 202 (2017)
RAPD profiles were scored using the
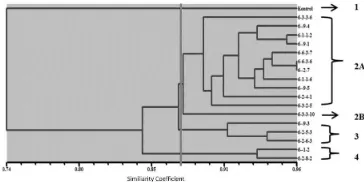
NTSYS software to produce a dendrogram for determining relative genetic similarity between clones. According to Rout (2006), a dendrogram represents the genetic relationship between different plant varieties of the same species. A dendrogram of MV3 clones based on the RAPD analysis
with a similarity coefficient cut-off of 0.87
showed four main clusters (Figure 4). The genetic similarity matrix showed the genetic distance between MV3 clones (Table 5). The matrix showed that there was no 100% genetic similarity between 17 MV3 clones and the control. Mutant clones 6-9-3, 6-2-5-3, 6-1-1-2, 6-2-6-6-2-5-3, 6-1-2 and 6-3-3-10 each had 71% genetic similarity to the control, which was the lowest among all the clones.
Clone 6-6-3-6 had 80% genetic similarity to the control, which was the highest among all the clones. Table 5 showed that there were three clones with 73%, one with 74%, one with 80%, one with 75%, four with 76%, two with 77% and one with 78% genetic similarity to the control.
Table 4
The Number of DNA Bands Produced by RAPD Amplification of MV3 DNA with 15 Primers
Num Primer Sequence Total bands Polymorphic
bands
Size (bp)
1 OPA-02 5’-TGCCGAGCTG-3’ 5 1 450-1250
2 OPA-03 5’-AGTCAGCCAC-3’ 10 6 530-2830
3 OPA-09 5’-GGGTAACGCC-3’ 10 3 425-1900
4 OPA-14 5’-TCTGTGCTGG-3’ 10 8 500-2500
5 OPB-18 5’-CCACAGCAGT-3’ 15 14 310-3000
6 OPC-05 5’-GATGACCGCC-3’ 13 9 250-1900
7 OPC-08 5’-TGGACCGGTG-3’ 10 4 540-2170
8 OPC-11 5’-AAAGCTGCGG-3’ 4 3 650-2200
9 OPC-14 5’-TGCGTGCTTG-3’ 8 3 600-3000
10 OPD-08 5’-GTGTGCCCCA-3’ 6 1 570-2830
11 OPD-10 5’-GGTCTACACC-3’ 11 6 190-2000
12 OPD-18 5’-GAGAGCCAAC-3’ 7 3 400-1350
13 OPD-20 5’-ACCCGGTCAC-3’ 10 5 575-2400
14 OPE-03 5’-CCAGATGCAC-3’ 5 0 350-1400
15 OPE-07 5’-AGATGCAGCC-3’ 8 1 350-1500
Total 132 67
Figure 4. Dendrogram of MV3 clones based on
RAPD profile. The dendrogram was generated by scoring of DNA bands in RAPD profiles of 15 primers
using NTSYS UPGMA and SHAN clustering at the
similarity coefficient cut-off of 0.87
.
194 Pertanika J. Trop. Agric. Sci. 40 (1) 194 - 202 (2017) The RAPD molecular marker is able
to detect DNA polymorphism without taking environmental factors into account (Guimaraes et al., 2007). The RAPD molecular marker, which utilises random primers, was able to show genetic diversity between the control and the MV3 clones. Single random primers have been known to be able to amplify DNA and show the polymorphism of mutant DNA (Williams et al., 1990). DNA mutation could change primer annealing sites in a plant’s genome, which is followed by change in the RAPD
profile of DNA bands (Tindall et al., 1988).
The number of DNA bands produced by a primer is determined by the number of complementary sequences in the genome (Singh & Singh, 1995).
DNA polymorphism of MV3 clones is due to gamma irradiation on somatic cell population. Gamma irradiation is able to induce the production of reactive free radicals, which can change the DNA sequence and break DNA double bonds. Gamma irradiation also causes chromosomal aberration such as deletion, invertion, translocation and duplication (Gorbunova & Levy, 1997). The loss of DNA bands observed in the RAPD profile of MV3 clones (Figure 3) was probably caused by destruction of DNA, rearrangement of chromosomes and deletion or insertion of DNA nucleotides. The existence of new
DNA bands observed in the RAPD profile
of MV3 but not in the control was probably caused by deletion or invertion of DNA nucleotides (Yunus et al., 2013).
RAPD analysis of Rhododendron
also showed genetic differences between the control and MV3 clones, which were irradiated with gamma ray at doses of 5 and 10 Gy (Atak et al., 2011). Yunus et al. (2013) also proved that RAPD analysis was effective in deleting DNA polymorphism of ginger plants (Etlingera elatior) irradiated with 10 Gy gamma ray. Polymorphism analysis of gamma-irradiated DNA has also been done on potato plants (Yaycili & Alikamanoglu, 2012), Hibiscus Sabdariffa
L. (Sherif et al., 2011) and anthurium plants (Puchooa, 2005). A genetic similarity matrix (Table 5) of the results shows the
diversity of genetic modification between
the MV3 clones. The observed genetic similarity variation between the MV3 clones was due to random mutation caused by gamma irradiation (Pillay & Tenkouano, 2011). According to Pillay and Tenkouano (2011), the DNA repair mechanism of potato plants was different from one cell to another; therefore, they showed different
genetic profiles. Based on morphological
markers, MV3 clone 6-2-4-1 had 100% similarity to the control, while, based on the molecular marker, clone 6-2-4-1 had 73% genetic similarity to the control. The difference in genetic similarity between morphological and molecular markers was
due to the influence of the environment on
morphological analysis.
Rodent T
uber
(
Typhonium flagelliforme
Lodd.) Mutant
Analysis
195
Pertanika J.
T
rop.
Agric. Sci. 40 (1): 195 - 202 (2017)
Table 5
Genetic Similarity Matrix of MV3 Clones Based on RAPD Molecular Marker
Kontrol 6-3-3-6 6-9-3 6-9-4 6-2-5-3 6-3-2-5 6-1-1-2 6-9-1 6-2-4-1 6-6-3-7 6-6-3-6 6-2-7 6-2-6-3 6-1-2 6-1-1-6 6-2-8-2 6-9-5 6-3-3-10
Kontrol 1.00
6-3-3-6 0.73 1.00
6-9-3 0.71 0.90 1.00
6-9-4 0.74 0.90 0.88 1.00
6-2-5-3 0.71 0.86 0.91 0.91 1.00
6-3-2-5 0.75 0.89 0.90 0.90 0.89 1.00
6-1-1-2 0.71 0.92 0.86 0.94 0.91 0.92 1.00
6-9-1 0.76 0.89 0.83 0.92 0.89 0.87 0.95 1.00
6-2-4-1 0.73 0.83 0.83 0.92 0.85 0.86 0.89 0.89 1.00
6-6-3-7 0.78 0.92 0.86 0.93 0.87 0.89 0.93 0.93 0.90 1.00
6-6-3-6 0.80 0.88 0.86 0.92 0.87 0.92 0.90 0.92 0.90 0.94 1.00
6-2-7 0.77 0.90 0.89 0.92 0.88 0.92 0.91 0.92 0.92 0.95 0.96 1.00
6-2-6-3 0.71 0.87 0.91 0.86 0.94 0.87 0.88 0.88 0.83 0.89 0.86 0.88 1.00
6-1-2 0.71 0.80 0.79 0.85 0.82 0.83 0.85 0.85 0.86 0.86 0.87 0.86 0.80 1.00
6-1-1-6 0.77 0.89 0.90 0.90 0.87 0.89 0.90 0.90 0.90 0.92 0.94 0.95 0.89 0.87 1.00
6-2-8-2 0.73 0.82 0.80 0.87 0.80 0.85 0.84 0.86 0.87 0.88 0.91 0.89 0.80 0.93 0.89 1.00
6-9-5 0.76 0.89 0.86 0.92 0.86 0.90 0.92 0.92 0.91 0.93 0.93 0.92 0.88 0.85 0.93 0.89 1.00
.
196 Pertanika J. Trop. Agric. Sci. 40 (1) 196 - 202 (2017) Analysis of Chemical Compounds with
GC-MS
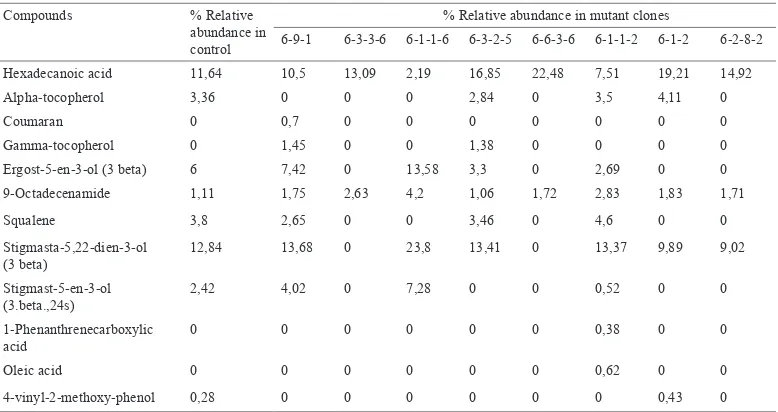
GC-MS analysis revealed that the leaves of MV3 clones contained at least eight anticancer compounds i.e. more than in the control plants (Table 6). The quantity of anticancer compound stigmasta-5,22-dien-3-ol (3-beta) in leaves of clone 6-1-1-6
was 10.96% higher than in the controls and was also the highest compared to the other MV3 clones. The leaves of MV3 clones also contained new anticancer compounds that were not found in the control plants, such as coumaran, gamma tocopherol, 1-phenanthrenecarboxylic acid and oleic acid (Table 6).
Table 6
The Number of DNA Bands Produced by RAPD Amplification of MV3 DNA with 15 Primers
Compounds % Relative abundance in control
% Relative abundance in mutant clones
6-9-1 6-3-3-6 6-1-1-6 6-3-2-5 6-6-3-6 6-1-1-2 6-1-2 6-2-8-2
Hexadecanoic acid 11,64 10,5 13,09 2,19 16,85 22,48 7,51 19,21 14,92
Alpha-tocopherol 3,36 0 0 0 2,84 0 3,5 4,11 0
Coumaran 0 0,7 0 0 0 0 0 0 0
Gamma-tocopherol 0 1,45 0 0 1,38 0 0 0 0
Ergost-5-en-3-ol (3 beta) 6 7,42 0 13,58 3,3 0 2,69 0 0 9-Octadecenamide 1,11 1,75 2,63 4,2 1,06 1,72 2,83 1,83 1,71
Squalene 3,8 2,65 0 0 3,46 0 4,6 0 0
Stigmasta-5,22-dien-3-ol (3 beta)
12,84 13,68 0 23,8 13,41 0 13,37 9,89 9,02
Stigmast-5-en-3-ol (3.beta.,24s)
2,42 4,02 0 7,28 0 0 0,52 0 0
1-Phenanthrenecarboxylic acid
0 0 0 0 0 0 0,38 0 0
Oleic acid 0 0 0 0 0 0 0,62 0 0
4-vinyl-2-methoxy-phenol 0,28 0 0 0 0 0 0 0,43 0
The highlights indicate the higher quantities of anticancer bioactive compounds in MV3 clones compared with the control
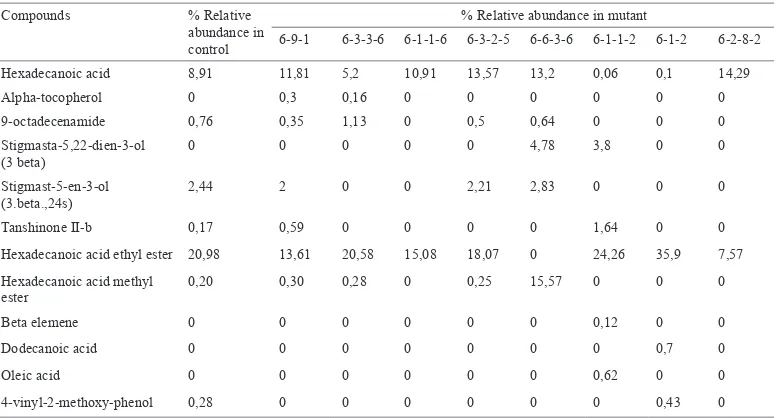
The GC-MS analysis of tubers of MV3 clones revealed that they contained six anticancer compounds, more than in the control plants (Table 7). The quantity of hexadecanoic acid methyl ester of tubers of clone 6-6-3-6 was 15.37% higher than in the
Rodent Tuber (Typhonium flagelliforme Lodd.) Mutant Analysis
197 Pertanika J. Trop. Agric. Sci. 40 (1): 197 - 202 (2017)
The GC-MS analysis showed that the leaves of MV3 clones contained at least eight anticancer compounds, more than in the control plants. The quantity of anticancer compound stigmasta-5,22-dien-3-ol (3-beta) of clone 6-1-1-6 was the highest compared to the control and the other MV3 clones (Table 6). Stigmasta-5,22-dien-3-ol (3 beta) (stigmasterol) is a phytosterol that could reduce the number of Ehrich Ascites
Carcinoma (EAC). Stigmasterol is able
to activate the protein phosphatase 2A by ceramide to promote the apoptosis of cancer cells. Stigmasterol also exerts an antioxidant effect because it is able to reduce lipid peroxidation and increase gluthathionin, superoxide dismutase and catalase activities in EAC mice liver (Ghosh et al., 2011).
The leaves of the MV3 clones also contained new anticancer compounds
that were not found in the control plants, such as coumaran, gamma-tocopherol, 1-phenanthrenecarboxylic acid and oleic acid. Coumaran (2,3-dihydrobenzofuran) and its derivatives are able to inhibit the polymerisation of tubulin, thus inhibiting mitosis (Pieters et al., 1999). Vitamin E
(α dan γ-tocopherol) has been proven to
be able to reduce the risk of developing several kinds of cancer (Jiang et al., 2001). The compound, 1-phenanthrenecarboxylic acid, shows anticancer activity against KB nasopharyngeal cancer, Hop62 lung cancer, ME180 cervical cancer and K562 leukemia (Tatiya et al., 2014). Oleic acid is a monounsaturated fatty acid n-9 with anticancer activity against breast cancer (Escrich et al., 2008) and colon adenocarcinoma (Carrillo et al., 2011).
Table 7
The Number of DNA Bands Produced by RAPD Amplification of MV3 DNA with 15 Primers
Compounds % Relative abundance in control
% Relative abundance in mutant
6-9-1 6-3-3-6 6-1-1-6 6-3-2-5 6-6-3-6 6-1-1-2 6-1-2 6-2-8-2
Hexadecanoic acid 8,91 11,81 5,2 10,91 13,57 13,2 0,06 0,1 14,29
Alpha-tocopherol 0 0,3 0,16 0 0 0 0 0 0
9-octadecenamide 0,76 0,35 1,13 0 0,5 0,64 0 0 0
Stigmasta-5,22-dien-3-ol (3 beta)
0 0 0 0 0 4,78 3,8 0 0
Stigmast-5-en-3-ol (3.beta.,24s)
2,44 2 0 0 2,21 2,83 0 0 0
Tanshinone II-b 0,17 0,59 0 0 0 0 1,64 0 0
Hexadecanoic acid ethyl ester 20,98 13,61 20,58 15,08 18,07 0 24,26 35,9 7,57 Hexadecanoic acid methyl
ester
0,20 0,30 0,28 0 0,25 15,57 0 0 0
Beta elemene 0 0 0 0 0 0 0,12 0 0
Dodecanoic acid 0 0 0 0 0 0 0 0,7 0
Oleic acid 0 0 0 0 0 0 0,62 0 0
4-vinyl-2-methoxy-phenol 0,28 0 0 0 0 0 0 0,43 0
.
198 Pertanika J. Trop. Agric. Sci. 40 (1) 198 - 202 (2017) The GC-MS analysis of tubers of MV3
clones revealed that they had six anticancer compounds; this was more than in the control plants. The quantity of hexadecanoic acid methyl ester of tubers of clone 6-6-3-6 was the highest compared to the control and the other MV3 clones. Hexadecanoic acid methyl ester has been able to induce the apoptosis of human gastric cancer cells (Yu et al., 2005).
The tubers of the MV3 clones also contained the new anticancer compounds that were not found in the control plants i.e. alpha-tocopherol, stigmasta-5,22-dien-3-ol (3-beta), beta elemene and dodecanoic acid. Beta-elemene has anti-proliferative activity against prostate, lung, colon, cervical, breast and brain cancers (Li et al., 2010). Dodecanoic acid (lauric acid) has been proven to be able to induce apoptosis of colon cancer cells (Fauser et al., 2013). This
finding was consistent with previous analysis
of rodent tuber MV1 phytochemicals, whose shoots and tubers contained at least eight anticancer compounds, which is a higher number of anticancer compounds than in the control. The shoots and tubers of MV1 also contained new anticancer compounds that were not found in the control plants (Sianipar et al., 2015c). Because MV3 clones have a higher plant biomass than the control and contain a higher amount of anticancer compounds than the control, they have a high potential for becoming a new source
of anticancer bioactive compounds for the formulation of commercial anticancer drugs.
CONCLUSION
MV3 clones underwent genetic changes not seen in the control according to
morphological, RAPD profile and bioactive
Rodent Tuber (Typhonium flagelliforme Lodd.) Mutant Analysis
199 Pertanika J. Trop. Agric. Sci. 40 (1): 199 - 202 (2017)
ACKNOWLEDGEMENT
This work was funded by The Directorate General of Higher Education through a competitive grant project. The authors would like to thank The Directorate General of Higher Education, Ministry of National Education, Indonesia. The authors also thank Prof. Ika Mariska for reviewing the
final manuscript.
REFERENCES
Acharya, L., Mukherjee, A. K., Panda, P. C., & Das, P. (2005). Molecular characterization of five medicinally important species of
Typhonium (Araceae) through random amplified
polymorphic DNA (RAPD). Zeitschrift für Naturforschung, 60(7-8), 600-604.
Afrasiab, H., & Iqbal, J. (2010). In vitro techniques and mutagenesis for the genetic improvement of potato cvs. desiree and diamant. Pakistan Journal of Botany, 42(3), 1629–1637.
Atak, C., Celik, O., & Acik, L. (2011). Genetic analysis of Rhododendron mutants using random
amplified polymorphic DNA (RAPD). Pakistan
Journal of Biotechnology, 43(2), 1173-1182. Carrillo, C., Cavia, M. M., & Alonso-Torre, S. R
(2011). Oleic acid inhibits store-operated calcium entry in human colorectal adenocarcinoma cells.
European Journal of Nutrition, 51(6), 677-684. Choo, C. Y., Chan, K. L., Takeya, K., & Itokawa,
H. (2001). Cytotoxic activity of Typhonium
flagelliforme (Araceae). Phytotherapy Research, 15(3), 260-262.
Doyle, J. J., & Doyle J. L. (1987). A rapid DNA isolation procedure for small quantities of fresh leaf tissue. Phytochemical Bulletin, 19, 11–15.
Escrich, E., Solanas, M., Moral, R., Grau, L., Costa, I., & Vela, E. E. R. (2008). Dietary
LIPIDS and breast cancer: Scientific clinical,
anatomopathological and molecular evidences.
Revista Espanola de Obesidad, 6(3), 129-38. Essai. (1986). Medicinal herbs index in Indonesia.
Jakarta: PT Essai Indonesia.
Fauser, J. K., Matthews, G. M., Cummins, A. G., & Howarth, G. S. (2013). Induction of apoptosis by the medium-chain length fatty acid lauric acid in colon cancer cells due to induction of oxidative stress. Chemotherapy, 59(3), 214-224.
Ghosh, T., Maity, T. K., & Singh, J. (2011). Evaluation of antitumor activity of stigmasterol, a constituent isolated from Bacopa monnieri Linn aerial parts against Ehrlich Ascites Carcinoma in mice.
Oriental Pharmacy and Experimental Medicine, 11(1), 41-49.
Gnanamurthy, S., Mariyamma, S., Dhanavel, D., & Bharathi, T. (2012). Effect of gamma rays on yield and yield components characters R3 generation in cowpea [Vigna unguiculata (L.) Walp]. International Journal of Research in Plant Science, 2(2), 39–42.
Gorbunova, V., & Levy, A. A. (1997). Non-homologous DNA end joining in plant cells isassociated with
deletions and filler dna insertions. Nucleic Acids Research, 25(22), 4650-4657.
Guimaraes, E. P., Ruane, J., Scherf, B. D., Sonnino, A., & Dargie, J. D. (2007). Marker-assisted selection. Rome: Food and Agriculture Organization of The United Nations.
H a m i d e l d i n , N . , & H u s s i n , O . S . ( 2 0 1 3 ) . Morphological, physiological and molecular changes in Solanum tuberosum L. in response to pre-sowing tuber irradiation by gamma rays.
.
200 Pertanika J. Trop. Agric. Sci. 40 (1) 200 - 202 (2017)
Hoesen, D. S. H. (2007). Pertumbuhan dan perkembangan tunas Typhonium secara in vitro.
Berita Biologi, 8(5), 413–422.
Jaccard, P. (1901). Étude comparative de la distribution
florale dans une portion des Alpes et des Jura.
Bulletin de la Société Vaudoise des Sciences Naturelles, 37, 547–579.
Jiang, Q., Chisten, S., Shigenaga, M. K., & Ames,
B. N. (2001). γ-tocopherol, the major form of
vitamin E in the US diet, deserves more attention.
American Journal of Clinical Nutrition, 74(6), 714-722.
Kayser, O., & Quax, W. (2007). Medicinal Plant Biotechnology. Germany: Wiley VCH.
Kovacs, E., & Keresztes, A. (2002). Effect of gamma and UV-B/C radiation on plant cells. Micron, 33(2), 199-210.
Lai, C. S., Mas, R. H., Nair, N. K., Mansor, S. M., & Navaratnam, V. (2010). Chemical constituents and in vitro anticancer activity of Typhoniumflagelliforme (Araceae). Journal of Ethnopharmocology, 127(2), 486-494.
Lai, C. S., Mas, R. H. M. H., Nair, N. K., Majid, M. I. A., Mansor, S. M., & Navaratnam, V. (2008). Typhonium flagelliformeinhibits cancer cell growth in vitro and induces apoptosis: An evaluation by the bioactivity guided approach.
Journal of Ethnopharmacology, 118(1), 14-20. Li, Q. Q., Wang, G., Huang, F., Banda, M., & Reed,
E. (2010). Antineoplastic effect of beta-elemene on prostate cancer cells and other types of solid tumour cells. Journal of Pharmacy and Pharmacology, 62(8), 1018–27.
McClelland, N., Nelson, M., & Raschke, E.
(1994). Effect of site-spesific modification on restriction endonukleases and DNA modification
methyltransferase. Nucleic Acid Research, 22(17), 3640-3659.
Mohan, S., Abdul, A. B., Abdelwahab, S. I., Al-Zubairi, A. S., Aspollah, S. M., Abdullah, R. … Isa, N. M. (2010). Typhonium flagelliforme inhibits the proliferation of murine leukemia WEHI-3 cells in vitro and induces apoptosis in vivo. Leukemia Research, 34(11), 1483-1492. Mohan, S., Bustamam, A., Ibrahim, S., Al-Zubairi,
A. S., & Aspollah, M. (2008). Anticancerous effect of Typhonium flagelliforme on human T4-lymphoblastoid cell line CEM-ss. Journal of Pharmacology and Toxicology, 3(6), 449–456. Mudibu, J., Nkongolo, K. K. C., Mbuyi, A. K.,
& Kizungu, R. V. (2012). Effect of gamma irradiation on morpho-agronomic characteristics of Soybeans (Glycine max L.). American Journal of Plant Sciences, 3(3), 331–337.
Pieters, L., Van Dyck, S., Gao, M., Bai, R., Hamel, E., Vlietinck, A., & Lemiere, G. (1999). Synthesis and biological evaluation of dihydrobenzofuran lignans and related compounds as potential a n t i t u m o r a g e n t s t h a t i n h i b i t t u b u l i n polymerization. Journal of Medicinal Chemistry, 42(26), 5475-5481.
Pillay, M., & Tenkouano, A. (2011). Banana breeding progress and challenges. New York: CRC Press. Powell, W., Morgante, M., Andre, C., Hanafey, M.,
Vogel, J., Tingey, S., & Rafalski, A. (1996). The comparison of RFLP, RAPD, AFLP and SSR (microsatellite) markers for germplasm analysis.
Molecular Breeding, 2(3), 225-238.
Puchooa, D. (2005). In vitro mutation breeding of
Anthurium by gamma radiation. International Journal of Agriculture and Biology, 7(1), 11-20. Rashid, K., Daran, A. B. M., Nezhadahmadi, A.,
Zainoldin, K. H., Azhar, S., & Efzueni, S. (2013). The effect of using gamma rays on morphological characteristics of ginger (Zingiber
Rodent Tuber (Typhonium flagelliforme Lodd.) Mutant Analysis
201 Pertanika J. Trop. Agric. Sci. 40 (1): 201 - 202 (2017)
Rout, G. R. (2006). Evaluation of genetic relationship
in Typhonium species through random amplified
polymorphic DNA markers. Biologia Plantarum, 50(1), 127-130.
Sherif, F. E., Khattab, S., Ghoname, E., Salem, N., & Radwan, K. (2011). Effect of gamma irradiation on enhancement of some economic traits and molecularchanges in Hibiscus sabdariffa L. Life Science Journal, 8(3), 220-229.
Sianipar, N. F., & Maarisit, W. (2015). Detection of gamma-irradiated mutant of rodent tuber (Typhonium flagelliforme Lodd.) in vitro culture by RAPD molecular marker. Procedia Chemistry, 14, 285–294.
Sianipar, N. F., Laurent, D., Purnamaningsih, R., & Darwati, I. (2015a). Genetic variation of the first generation of rodent tuber (Typhonium flagelliforme Lodd.) mutants based on RAPD molecular markers. Hayati Journal of Biosciences, 22(2), 98–104.
Sianipar, N. F., Laurent, D., Purnamaningsih, R., & Darwati, I. (2015b). Gas chromatography-mass spectrometry (GC-MS) analysis of phytochemicals of first generation gamma-irradiated Typhonium flagelliforme Lodd. Mutants. Proceedings of the 2016 Applied Mathematics in Science and Engineering International Conference (APPEMSE). Melaka, Malaysia: Malaysia Technical Scientist Association.
Sianipar, N. F., Laurent, D., Purnamaningsih, R., & Darwati, I. (2013). The effect of gamma irradiation and somaclonal variation on morphology variation of mutant rodent tuber (Typhonium flagelliforme Lodd) Lines. KnE Life Sciences, 2(1), 637-645.
Sianipar, N. F., Maarisit, W., & Valencia, A. (2013). Toxic activities of hexane extract and column chromatography fractions of rodent tuber
(Typhonium flagelliforme Lodd.) on Artemia
salina. Indonesian Journal of Agricultural Science, 14(1), 1–7.
Sianipar, N. F., Rustikawati, Maarisit, W., Wantho, A., & Sidabutar, D. N. R. (2011). Embryogenic calli induction, proliferation and regeneration
of rodent tuber plant (Thyphonium flagelliforme
Lodd.) by single node culture. Paper presented at the International Conference on Biological Science BIO-UGM, Jogjakarta, Indonesia. R e t r i e v e d f r o m h t t p s : / / r e p o s i t o r y. u g m . ac.id/136089/1/B%2030%20ICBS%202011%20 E.%20Semiarti%20et%20al..pdf
Sianipar, N. F., Wantho, A., Rustikawati, & Maarisit, W. (2013). The effect of gamma irradiation on growth response of rodent tuber (Typhonium flagelliforme Lodd.) mutant in vitro culture.
Hayati Journal of Bioscience, 20(2), 51–56. Sinden, R. R. (1994). DNA structure and function.
California: Academic Press, Inc.
Singh, R. P., & Singh, U. S. (1995). Molecular methods in plant pathology. New York: CRC Press, Inc.
Steel, R. G. D., & Torrie, J. H. (1981). Principles and procedure of statistics, a biometrical approach
(2nd ed.). London: McGraw-Hill Ind. Book Co.
Surya, M. I., & Soeranto, H. (2006). Pengaruh iradiasi sinar gamma terhadap pertumbuhan sorgum manis (Sorghum bicolor L.). In Risalah Seminar Ilmiah Aplikasi Isotop dan Radiasi (pp. 209–215).
Syahid, S. F. (2007). Perbanyakan keladi tikus (Typhonium flagelliforme Lodd) secara in vitro.
.
202 Pertanika J. Trop. Agric. Sci. 40 (1) 202 - 202 (2017)
Syahid, S. F. (2008). Keragaman morfologi,
pertumuhan, produksi, mutu dan fitokimia keladi
tikus (Typonium flagelliforme Lodd.) Blume asal variasi somaklonal. Jurnal Littri, 14(3), 113-118. Syahid, S. F., & Kristina, N. N. (2007). Induksi
dan regenerasi kalus keladi tikus (Typhonium
flagelliforme Lodd.) secara in vitro. Jurnal Littri, 13(4), 142-146.
Taheri, S., Abdullah, T. L., Ahmad, Z., & Abdullah, N. A. P. (2014). Effect of acute gamma irradiation on Curcuma alismatifolia varieties and detection of dnapolymorphism through ssr marker. Biomed Research International, 2014(2014), 1–18. Tatiya, A. U., Bari, N., Surana, S. J., & Kalaskar, M.
G. (2014). Effect of bio assay guided isolation of 1-phenanthrene carboxylic acid from Eulophia herbacea Lindl. Tubers on human cancer cell lines. Research Journal of Phytochemistry, 8(4), 155–161.
Tindall, K. R., Stein, J., & Hutchinson, F. (1988). Changes in DNA base sequence induced by gamma-ray mutagenesis of lambda phage and prophage. Genetics, 118(4), 551-560.
Van Harten, A. M. (1998). Mutation breeding. theory and practical applications. Cambridge: Cambribge University Press.
Williams, J. G. K., Kubelik, A. R., Livak, K. J., Rafalski, J. A., & Tingey, S. V. (1990). DNA
polymorphisms amplified by arbitrary primers
are useful as genetic markers. Nucleic Acids Research, 18(22), 6531-6535.
Yaycili, O., & Alikamanoglu, S. (2012). Induction of salt-tolerant potato (Solanum tuberosum
L.) mutants with gamma irradiation and characterization of genetic variations via RAPD-PCR analysis. Turkey Journal Biology, 36(4), 405-412.
Yu, F., Lian, X., Guo, H., McGuire, P., Li, R., Wang, R., & Yu, F. (2005). Isolation and characterization of methyl esters and derivatives from Euphorbia kansui (Euphorbiaceae) and their inhibitory effects on the human SGC-7901 cells. Journal of Pharmacy and Pharmaceutical Science, 8(3), 528–535.
Yunus, M. F., Aziz, M. A., Kadir, A. A., Daud, S. K., & Rashid, A. A. (2013). In vitro mutagenesis of