International Conference on Medicinal Plants ICOMP 2010 Surabaya, Indonesia, 21-22 July 2010
PHYTOCHEMICAL STUDY OF KETAPANG BARK
(
TERMINALIA CATAPPA
L.)
Ade Zuhrotun1*, Asep Gana Suganda2, As’ari Nawawi2
1
Faculty of Pharmacy, Universitas Padjadjaran
2
School of Pharmacy, Institut Teknologi Bandung
*Author for Correspondence: Jl. Raya Bandung-Sumedang KM 21, Jatinangor, West Java, Postal Code 45363, Phone/Fax 022-7796200, Mobile Phone 081322517899, email address: [email protected]
Abstract: Terminalia catappa L. is a tree which is known in Indonesia as ketapang or in other
countries like England as tropical/indian almond. All part of ketapang used as traditional medicine and its pharmacological activity had been reported by many researchers. In this present work, the phytochemical study was covered material preparation, extraction, fractionation, characteristic determination of crude drug and extract, separation, purification and identification of isolated compound. The bark was extracted by reflux with 95% ethanol. An amount of extract was dissolved in hot water, then fractionated by liquid-liquid extraction (LLE) using n-hexane, chloroform, and ethyl acetate respectively. The extract and fractions analyzed by thin layer chromatography (TLC) and showed that hexane fraction had an interested compound. Further separation and purification of n-hexane fraction by combination of classical column chromatography and preparative TLC, have got isolated compound BK. Characterization of BK by ultraviolet-visible spectrophotometry, infrared spectrophotometry, liquid chromatography-mass spectrometry (LC-MS/ESI), and nuclear magnetic
resonance spectroscopy (1H, 13C, HMQC and HMBC) identified that BK was steroidal compound with
390,20 (m/z) of molecular weight and C27H34O2 of molecular formula, and predicted have aromatic
ring in A and B position and acetoxy group in C-3 position.
Keywords: Ketapang, Terminalia catappa L., phytochemical study, steroids
1. INTRODUCTION
Terminalia catappa L. are naturally
widespread in subtropical and tropical zones of Indian and Pacific Oceans and planted
extensively throughout the tropics. In
Indonesian archipelago, ketapang grown wild at low altitude, seashore or near by littoral area of Java Island until 800 m above the sea level and cultivated usually to take the fruits [Heyne, 1950; Thomson and Evans, 2006].
The leaves of this Combretaceous plant were widely used as a folk medicine in Southeast Asia for dermatosis and hepatitis. A lot of pharmacological studies have reported that the extract of leaves and fruits have anticancer, antioxidant, anti-HIV reverse transcriptase,
anti-inflammatory, antidiabetic and
hepatoprotective activities. This plant was
popularly known as ‘deshibadam’ in Ayurvedic
medicine. Juice of young leaves are employed
externally in ointment for leprosy and scabies and internally for colic and headache. In addition, the seed also have aphrodisiac
activity [Jing et.al, 2004; Ratnasooriya and
Dharmasiri, 2000; Tenpe et al., 2007].
In Indonesia, ketapang bark was empirically used on medication of dysentery. The kernel seed used for laxantia, and the leaves for treatment of rheumatism, headache, colic, tanning and dye black agent on fabrican cloth [Heyne, 1950; Kasahara and Hemmi, 1995].
All ethanol extract of 12 species of Terminalia genera (Combretaceae) leaves have shown an
antimicrobial activity minimal against three of
Escherichia coli, Staphylococcus aureus,
Candida albicans and Microsporum gipseum.
microbe and Pseudomonas aeroginosa, Trichophyton mentagrophytes, Pityrosporum
ovale and Epidermophyton flocosum.
Furthermore, antifungal testing showed that ointment with 10% of this extract healing up on
rabbit’s skin infected by Epidermophyton
flocosum and Candida albicans [Suganda,
A.G. et al., 2004, 2006, Sukandar, E. Y. et al., 2007].
Ketapang contains several chemicals that distributed on every parts of this plant. The kernel seed consist of fatty acids and tannins like punicalin, punicalagin, terflavins A ,B, and tercatein. The dried fallen leaves was present of flavone glycosides like apigenin
6-C-(2²-O-galloyl)-b-D-glucopyranoside,
apigenin-8-C-(2²-O-galloyl)-b-D-glucopyranoside,isovitexin, vitexin, isoorientin, and rutin. [Lin Hsu and Ta-Chen, 1999; Heyne, 1950; Lin et. al., 2000]. Phenolic compounds were found in root, fruit shell and bark. The fruit had also cyanidin-3-glucoside and corilagin. The bark possessed of gallic acid, ellagic acid, 2,3-(S)-HHDP-D-glucose, casuarinin, castalagin, grandinin, castalin; 3-methoxy-4-hydroxy phenol-1-O-b-D-(6-O-galloyl)-gluco side; 3,5-dimethoxy-4-hydroxyphenol-1-O-b-D-(6-O-galloyl)glucose de;(-)-epicatechin-3-O-gallate; (-)-epigallocate chin-3-O-gallate, procyanidin B-1; 3-O-galloyl
procyanidin B-2; acutissimin A and
eugenigrandin A [Lin et. al., 2000; Thomson and Evans, 2006; Nagappa et. al., 2003].
Phytochemical study of ketapang bark original species from Indonesia has not been reported. Previous screening indicated only the presence of flavonoid, tannin, saponin, kuinon, and mono/sesquiterpene [Sumintir, 2008]. These research was done to provide basic chemicals reference of ketapang and hopefully an isolated compound would intended to be direction for further elaboration.
2. METHODS AND RESULTS
2.1 Materials and tools
Materials: ketapang bark, 95% ethanol, aquadest, n-hexane, chloroform, ethyl acetate, toluene, ether, acetone, methanol, amilalcohol, hydrochloric acid, sulfuric acid, nitric acid, boric acid, citric acid, acetic acid glacial, formic acid, formaldehyde, ammonia, bismuth-subnitric, mercury(II)chloride, alumunium (III) chloride, chloral hydrate, kalium hydroxide,
sodium acetic, magnesium powder, alumunium foil, precoated silica gel GF254, and silica gel 60 (0,063-0,200 mm) for column.
Tools: grinder, reflux, rotavapor (BUCHI), electric dryer (MITSEDA HD 350), separatory funnel, freeze dryer (EYELA FD 81), microscope (OLYMPUS CX31), crucible porcelain, furnace (CARBOLITE), toluene-distillator, classical column chromatography,
common glassware in laboratory, high
performance liquid chromatoghraphy
(HAWLETT PACKARD 1100), ultraviolet-visible spektrophotometer (DESAGA), infrared spectrophotometer (FT/IR JASCO 4200), Liquid Chromatography- Mass Spectrometry /Electron Spray Ionization (LC-MS/ESI),
Mariner Biospectrometry), and nuclear
magnetic resonantion spectrometry (JEOL JNM ECA 500). Biological Technology (SITH) ITB, that belonged to Combretaceae, species Terminalia
catappa L, with sinonim name Terminalia
moluccana Lamk., Terminalia procera Roxb.,
and Terminalia mauritiana Blanco.
2.3 Extractions
Powdered crude drug was Extracted by reflux using 95% ethanol (6 hour). Filtrat was condensed first using vacuum rotavaporator then electric dryer. A 973,04 g of extract was obtained from 4 kg of crude drug, equivalent with 24,32%(w/w) of extractive matters (rendemen).
2.4 Fractionation
Fractionation conducted by liquid-liquid
extraction
(LLE)
using
n-hexane,
chloroform, and ethyl acetate respectively,
where the extract was dissolved in aquadest
resulted in 2,81 g n-hexane fraction (1,4%); 1,04 g chloroform fraction (0,52%); 1,50 g ethyl acetate fraction (0,75 %) and 102,85 g of water fraction (51,42%).
2.5 Determination of paramater quality
Crude drug and extract were determined by strandard procedure [Ditjen POM, 1987;
1979], parameters was covered water-soluble
extractive matters, ethanol-soluble extractive matters, loss on drying, total ash content, water-soluble ash content, acid-insoluble ash content, and water content. Specifically to crude drug followed by macroscopical and microscopical analysis.
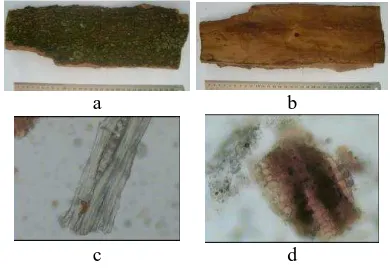
Macroscopical analysis of katapang bark showed the appearance of cuted bark in long fibrous layer, hard, thick (2-5 mm), visible like soft path in inner surface and outer surface was rugged, wrinkled, fractured, brown color and specific odor. Powdered crude drug have cream-pale brown color. By microscopical
analysis fragments identified were
shclerenchime, parenchime, fibrous bark, rocked cells, amylum, oil cells, and chrystal of rossette oxalate. The result of determinations are available in Figure 1 and Table 1.
a b
c d
Figure 1 Characteristic of macroscopic and microscopic
Note :
(a) Outer-(b)inner-surface (c)fibrous bark(d)oil cells and chrystal of rossette oxalate in parenchime
Table 1 Characteristic of Quality
Parameter Content % (w/v)
Crude Drug Extract Water-soluble extractive matters 14,50 49,45 Ethanol-soluble extractive matters 19,00 64,55
Loss on drying 10,54 21,63
Total ash content 15,07 1,67
Water-soluble ash content 4,50 0,38 Acid-insoluble ash content 11,09 1,27 Water content (% v/w) 8,88 17,85
2.6 Chemical content investigation
Chemical content investigation was done by phytochemical screening and thin layer chromatography (TLC).
a. Phytochemical screening
Phytochemical screening were determined from crude drug, extract and all fractions of LLE, that covered alkaloid, flavonoid, kuinon, saponin, tannin, steroid dan triterpenoid using standard procedures [Ditjen POM, 1979]. The results are available in Table 2.
Table 2 Result of Phytochemical Screening
Compounds I II III IV V VI
Alkaloid - - - -
Flavonoid + + + - + +
Kuinone + + + + + +
Saponin + + + - - -
Catechin + + + + - -
Gallotanin + + + + - +
Steroid/Triterpenoid + + - + + +
Note:
I=crude drug; II= ethanol extract ; III=water fraction ; IV = n-hexane fraction; V = chloroform fraction; VI= ethyl acetate fraction; + = present; - = absent
b. Thin layer chromatography (TLC)
Ethanol extract and LLE fractions were investigated by TLC using precoated silica gel GF254 and toluene:ether (1:1) solvent mixture. Chromatogram was observed under 254 nm, 366 nm and after 10% of sulfuric acid as spray reagent. Revealed the profile or numerous chemical contents of ketapang bark marked by every spots.
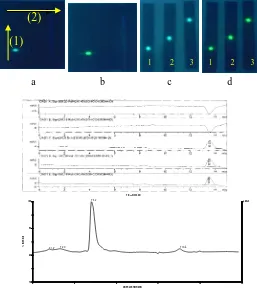
In Figure 2 showed that are two spots which
have dominan in intensity. They’re observed
under UV 366 nm, as greenish-blue
flourescence spot (’biru kehijauan’=BK) in
n-hexane fraction (Rf 0,78-0,85) and yellow flourescence spot (Rf 0,45-0,54) in chloroform fraction. At this research, for further process initially focused on n-hexane fraction to isolate the greenish-blue flourescence spot
1 2 3 4 5 1 2 3 4 5 1 2 3 4 5 1 2 3 4 5 1 2 3 4 5
a b c d e
Figure 1 Chromatogram of extraction and fractionation result
Note:
Sample: (1) extract, (2) n-hexane fraction, (3) chloroform fraction, (4) ethyl acetate fraction, (5) water fraction. condition: precoated silica gel GF254, eluen: toluene:eter (1:1) solvent mixture, observed under (a) visible (b) UV 254 nm (c) UV 366 nm (d) visible with 10% of sulfuric acid (e) UV 366 nm with 10% of sulfuric acid
2.7 Separation and purification of fractions
Classical column of chromatography (CC) and preparative TLC was chosen for further separation and purification of BK in n-hexane fraction. n-hexane:ethyl acetate (11:1) solvent mixture used as mobile phase, where BK identified in Rf 0,35. Classical column of chromatography was conventionally prepared as follow: about 450 ml of eluen; 30,14 g silica gel for column; size 2 cm of column diameter; 17,5 cm of column heigh after stable. Sample 1,03 g of n-hexane fraction putted down carefully on surface column to formed a flat layer. Elution process began slowly until interested compound fully separated, this process monitored by TLC.
From CC obtained 43 of sub fractions where BK was concentrated in 17-26 sub frations. Base on similarity pattern of chromatogram TLC then clasified as grouped 17-18 of sub fraction (4,2 mg), 19-22 sub fraction (8,2 mg) and 23-26 sub fraction (7,3 mg). Each groups then purified by preparative TLC under the same condition. BK on band shape then removed or scraped from the plate, redissolved with eter, liquid phase decanted, air-dried or placed in acid room to remove the solvent, residue was BK.
Purity of isolate BK was checked by two dimensional TLC, TLC with three diffrerent mobile phase, HPLC and LC (connected with MS in LC-MS/ESI). On each chromatogram
appeared only one spot with different value of Rf or Rt during observation under their specific condition. These may conclude that isolate BK was pure. In chromatogram resulted by LC-MS/ESI, showed that isolate BK was dominan of peak although small peak of impurities stil exist. After direct calculation on data, area under curve was 77,45% of
precentage. It’s also figure out the purity level of isolate BK. Chromatogram are available in Figure 3.
a b c d
0 3 6 9 12 15
Retention Time (Min)
1.6E+5
70 80 90 100
%
I
n
ten
si
ty
TIC=>NR(2.00)
T4.2
T2.0 T10.6
T1.2
Figure 2 Chromatogram of purity tests Note:
TLC: stationary phase: precoated silica gel GF 254, mobile phase (1) n-hexane:ethyl acetate (11:1) solvent mixture and (2) n-hexane:chloroform (3:7) solvent mixture (3) chloroform:ethyl acetate (9:1) solvent mixture, obseved under UV 366 nm (a and c), UV 366 nm with 10% sulfuric acid (b and d). HPLC : ODS hypersil column, mobile phase methanol (100%), flow rate 1 ml/minute, DAD detector, temperature 25C, stop T 15 minute. LC(LC-MS/ESI): mobile phase: methanol:water (80:20) solvent mixture; Injection Volume 20 l; flow rate 1 ml/minute; C18 (RP 18) Supelco column, size 150mm of lenght, size 5 μm of particle. System used: ESI (electrospray ionization), positive ion mode.
1 2 3
(1)
(2)
2.8 Characterization of Isolated compound
Isolate BK visually like a stiky mass, fair white
and almost transparent when dissolved. It’s
soluble in ethanol, methanol and ethyl acetate but more soluble in chloroform, n-hexane, diethyl ether.
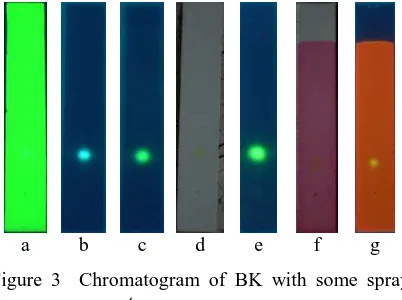
Monitored by TLC, BK appeared as
greenish-blue flourescence spot (’biru kehijauan’=BK)
under UV 366 nm, but under UV 254 nm this invisible. After sprayed with Liebermann-Burchard (LB) reagent, BK turned into green flourescence spot under 366nm, this also appearance BK after sprayed with 10% sulfuric acid, beside as light green spot visually when heated. Reaction BK with anisaldehyde reagent was appeared as yellow spot in orange/pink backgrounds under UV 366 nm
and visible. Isolat BK it’s not reacted with 5%
aluminium (III) chloride solution and 5% sitroboric solution when used as spray reagent. Chromatogram are available in Figure 4.
a b c d e f g
Figure 3 Chromatogram of BK with some spray reagent
Note:
stationary phase: precoated silica gel GF 254, mobile phase n-hexane:ethyl acetate (11:1) solvent mixture; obseved under (a) UV 254 nm (b) UV 366 nm (c) UV 366 nm with 10% sulfuric acid, (d) visible with LB reagent, (e) UV 366 nm with LB reagent, (f) visible with anisaldehyde, (g) UV 366 nm with anisaldehyde
Application of TLC also verified that BK
was not an arthefak. It’s done by spotting an
amount of isolate BK and extract under the same condition. This co-chromatogram pattern showed that isolate BK contained in the extract
in small portion, so that BK must not formed as arthefak.
Profile of BK by utraviolet-visible spectrum, described the presence of conjugative bond
within it’s structural compound. As the
absorbance was detected at wavelenght of 208 nm dan 355 nm. Previously, 95% ethanol was measured as blank solvent to proof that spectrum only derived from sample.
Infrared spectrophotometry was measured with potasium bromida (KBr) pellet as sample handling. Base on spectrum, structure of BK possessed some fungsional groups as follow:
hidroxy (O-H) at 3378,67 cm-1, stretched C-H
at 2931,27 cm-1 and 2857,99 cm-1, group C=O
at 1735,62 cm-1, and bended C-H at 1461,78
cm-1 and 1376,93 cm-1. Beside that, mass
spectrum of LC-MS/ESI showed the ion peak
at [M+1]+ 391,20 (m/z), this implied that the
molecular weight of BK was 390,20 (m/z).
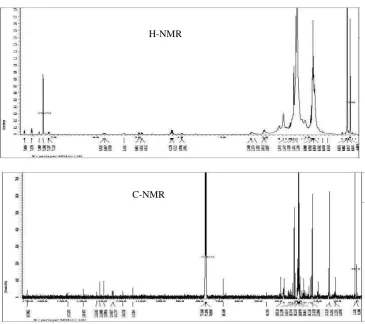
The H-NMR spectrum of BK used CDCl3 as
solvent, have shown a strong and sharp signal
at 0,8-1,0 ppm that indicated of methyl
groups (-CH3). signal also appear at existence
area of group-CH2 ( 1,2-1,4 ppm), group C-H
( 1,4-1,7), group CH3-COO- ( 2,0-2,2 ppm),
group CH- (bound to esther group) ( 3,3-3,9
ppm), group R2C=CH2 ( 4,6-5,0 ppm),
R2C=CHR ( 5,2-5,7 ppm), and proton
aromatic (ArH) ( 6,0-9,0 ppm). Whereas
spectrum C-NMR showed appearance of
signals that indicated of alkyl groups ( 5-60
ppm), group C–O ( 45-90 ppm), carbon in
aromatic ring ( 90-60 ppm), carbon of alkena
( 100-170 ppm), group –COO- ( 150-185
ppm). Spectrum are available in Figure 5.
Measurenment by two dimensional NMR comprise of Heteronuclear Multiple Quantum
Coherence (HMQC) and Heteronuclear
Figure 5 H- and C- NMR spectrum of BK
Table 3 Data Summaries from HMQC Spectrum
(ppm) C (ppm) H (ppm) C (ppm) H
11,1551 46,1705
14,3218 0,880 68,3469 4,21 19,9208 0,838 114,2644 4,9-5,0 22,8908 1,331 119,2720 7,53 23,1829 1,26 124,2747 7,12
23,9269 124,6517 7,35
27,2844 128,9916 7,7
29,5641 1,25 131,0805 7,52
29,8979 132,6352
30,3748 139,4837
31,6244 147,2575
32,1299 147,8012
37,2901 167,9652
38,9116
Table 4 Data Summaries From HMBC spectrum
(ppm) H
(ppm) C (ppm) H
(ppm) C
0,838 37,2901 2,02 114,2644; 139,4837 0,877 32,1299 4,21 23,9269; 30,5465 0,880 22,8908 7,12 124,6517; 147,80 0,918 38,9116 7,35 124,1747; 147,80 1,253 29,8979 7,52 139,4837, 147,2575 1,281 14,3218; 147,2575 7,70 131,0805
1,331 30,3748
3. DISCUSSION
Ketapang that used in this research was determined belonged to Combretaceae, species Terminalia catappa L, with sinonim name
Terminalia moluccana Lamk., Terminalia
procera Roxb., and Terminalia mauritiana Blanco. The bark was taken from main wooden rod of ketapang, then cleaned,
air-dried then powdered in order to be extracted, fractionated, and characterization.
The result of macroscopical and microscopical analysis showed a similarly profile of ketapang with the bark of other medicinal plants. Interested fragments appeared was the presence or abundance of oil cells with specific odor and chrystal of rossette oxalate.
H-NMR
By determination of quality parameters and phytochemical screening, was figured out the quality and chemical component katapang bark. Hopefully this will provided basic reference to explore ketapang in herbal medicine.
Qualitative information from TLC after extraction and fractionation process, directed focused on the objective of further separation and purification i.e isolation of greenish-blue
flourescence spot (’biru kehijauan’=BK) in
n-hexane fraction. The result of previous condition on chromatogram TLC, BK sited at Rf 0,78-0,85. After re-optimize the condition resulted an appropriate mobile phase for further
separation and purification,that was
n-hexane:ethyl acetate (11:1) solvent mixture, where BK sited in Rf 0,35. By the combination methods of CC and preparative TLC, BK was fully isolated. Purity level Liebermann-Burchard reagent, BK appear as green flourescence spot under 366nm, as light green color visually, supposed that steroidal compound. According to Goad and Akihisa (1997), steroidal compound reacted positively with LB if produced green or blue or pink color. From that reference also stated that in UV-Vis spectrum, double bond of steroidal compound will indicated at range wavelength of 190-220 nm. As result that the absorbance of BK indicated at wavelength of 208 nm dan 355 nm implied that BK owned conjugative
double bond, had also clarified of it’s green
flouresence under UV 366nm. In addition from infrared spectrum showed that BK possessed fungtional group of O-H, C-H dan C=O within structural compound.
The H-NMR spectrum of isolat BK showed a similarly with specific pattern of stearyl acetate, that marked as strong and sharp
signal at 0,8-1,0 ppm that indicated of methyl
groups (-CH3), signal at 4,2 ppm and 2,02
ppm indicated of acetoxy group, and signal at
4,9-5,0 ppm indicated of vinilic double
bond. From C-NMR spectrum peak was
appeared signals at 5-60 ppm indicated of
alkyl groups, signal at 68,34 ppm indicated of
carbon bound to esther group, and signal at
167,96 indicated of carbonyl group. Further analyze of compiled data from H- and C-NMR ensure the previously prediction that BK was steroidal compound. In general steroidal skeletone of cholestane, subtitution of acetoxy
group possible in C-3 position (3β-hydroxyl).
Two dimensional NMR spectrum of HMQC and HMBC showed some kind position of carbon such as the presence of carbon connected with proton aromatic, carbon connected with proton vinilic, one esther carbon connected with their proton, carbon connected with proton of methyl, and carbon disconnected with any protons (carbon without proton). These conclude that isolate BK in their structure possibly have aromatic bonding, vinilic bonding, and or binding with methyl groups in side chain.
Mass spectra of LC-MS/ESI given clued that the molecular weight of BK was 390,20 (m/z). In general, steroidal compound have 388- 426 (m/z) of molecular weight which depend on parent skeletone and side chain of their structure. These information was supported the previously prediction that BK was steroid compound. And then, molecular formula
possibly predicted as C27H34O2. The value of
Hydrogen Deficiency Index calculated based
estriol and geodisterol in marine sponge [Gui-Yang-Sheng Wang and Crews, 1999; Ikan, 1991]. Aromatic ring in B position can be found in fungi of species Phycomyces blakesleeanus, such as Phycomysterol A,
Phycomysterol B and Neoergosterol [Barrero
et. al., 1998]. And Aromatic rings both in A and B position like equilenin and its derivative [Pouchert and Behnko, 1993; Hill et. al., 2008]. Structure of each compound are available in
Figure 6 Structure of selected steroid
Note:
(a).Siclopentanoperhydrophenantren ring system; (b).Skeletone of cholestane;(c). Estradiol;(d). Estrone; (e).Estriol; (f).Geodysterol; (g). Phycomysterol A; (h).
similarly in aromatic rings
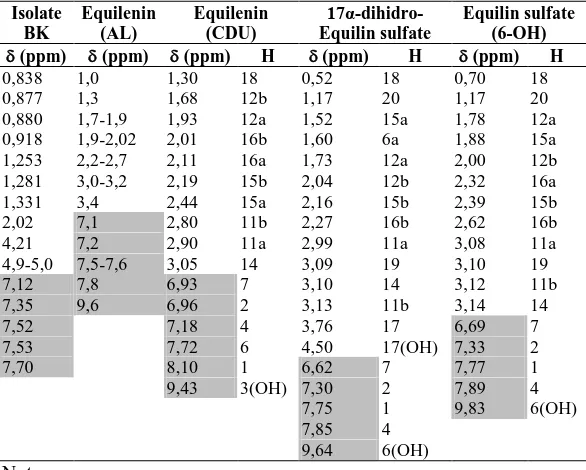
position with Equilenin and its derivative, that was in both A dan B rings. One of the difference was disappearance on chemical shift value proton of hydroxyl another fungtional group. As predicted previously that BK might subtituted by acetoxy group in C-3 position. It also explained that chemical shift value of hydroxyl group from BK in C-3 position was disappeared.
Chemical shift value of carbon aromatic in derivative, that was in both A dan B rings. One of the difference was appearance on chemical
shift value at 160-220 ppm indicated of
carbonyl group. In this case, represented to acetoxy in C-3 position of isolate BK and represented to ketone group in C-17 position of Equilenin and its derivative.
The similarity on chemical shift value of H- and C-NMR spectrum at aromatic ring position
from BK with Equilenin and it’s derivative,
implied that each compound have similar parent steroidal skeleton and location of
Table 5 H-NMR Spectrum of BK, Equilenin and It’s derivative
Isolate
Showed a similarly of chemical shift value
aromatic ring, that sited in A and B position. However, the configuration or structural complete of BK are still unclear.
4. CONCLUSION
Phytochemical study of katapang bark was conducted by analyze of specific and non
specific parameter of plant, provided
information of characteristic of its chemical compounds. By the process of extraction, fractionation, separation and purification, with monitored by TLC, have been fully isolated compound BK from n-hexane fraction. Characterization of BK by ultraviolet-visible spectrophotometry,Infrared spectrophotometry,
liquid chromatography-mass spectrometry
(LC-MS/ESI), and nuclear agnetic resonance
spectroscopy (1H, 13C, HMQC
and HMBC) identified that BK
was steroidal compound with 390,20 (m/z) of molecular weight and C27H34O2 of
molecular formula, and
predicted have aromatic ring in A and B position and acetoxy group in C-3 position.
Advanced research may
directed to optimize condition of purification in order to Oliver, 1998, Phycomysterols and Other Sterols from Fungus Phycomyces blakesleeanus. J.
Nat. Prod., 61.1401-1490.
Depkes RI, Jakarta, 83-87,155-160.
Goad, L.J. and Akihisa, T.,
1997, Analysis of Sterols. 1st Ed.,
Chapman & Hall, London.
Gui-Yang-Sheng Wang and Crews, P., 1999,
Geodisterol, a novel polyoxygenated sterol with an aromatic A ring from the tropical marine sponge Geodia sp.
[ABSTRACT]. Available at:
http://www.sciencedirect.com/science (accessed on February, 18 2010)
Heyne, K., 1950, Tumbuhan Berguna
Indonesia, Jilid. 3, Terjemahan Badan Litbang Kehutanan, Yayasan Sarana Warna Jaya, Jakarta, 1498-1505.
Hill, E.N., F.D. Sancilio , R.R. Whittle, 2008, Estrogenic Compounds and Tropical Pharmaceutical Formulation of The Same, US Patent No. 7,459,445 B2.
Table 6. C-NMR Spectrum of BK, Equilenin and It’s derivative
Isolate
Showed a similarly of chemical shift value
Ikan, R., 1991, Natural Product: A Laboratory
Guide, 2nd Ed, Academic Press, California
Jing GAO, Huan DOU, Xin-Hui TANG, Li-Zhi XU, Yi-Mei FAN, and Xiao-Ning ZHAO, 2004, Inhibitory Effect of TCCE on CCl4-induced Overepression of IL-6 in Acute Liver Injury, Acta Biochimica et
Biophysica Sinica 36(11): 767–772
Kasahara, Y. and Hemmi, S., 1995, Medicinal
Herbs Indeks in Indonesia, 2nd ed., Eisai
Indonesia, Jakarta, 67
Lin Hsu, F., and Ta-Chen Lina, 1999, Tannin and Related Compounds from Terminalia
catappa and Terminalia parviflora, J.
Chinese Chem. Soc., 1999, 46 (4),
613-618
Lin, Y. L., Y. H. Kuo, M. S. Shiao, C. C. Chen, and J. J. Ou, 2000, Flavonoid Glicosides of Terminalia catappa L., J.
Chinese Chem. Soc., 2000, 47, 253-256.
Nagappa, A.N., P.A. Thakurdesai, N.V. Raob, and J. Singh, 2003, Antidiabetic activity of Terminalia catappa Linn fruits, Journal
of Ethnopharmacology, 88, 45–50
Pouchert, C.J., and Behnke, J., 1993, The
Aldrich Library of 13C And 1H NMR
Spectra, 1st Ed., Vol 3, Aldrich Chemical
Company, Inc., USA, 590
Ratnasooriya, W. D., and Dharmasiri, M.G., 2000, Effects of Terminalia catappa seeds on sexual behavior and fertility of male rats, Asian J. Androl., 2, 213-9.
Suganda, A.G., E.Y. Sukandar and R.S. Hardhiko, 2004, Aktivitas Antimikroba
Ekstrak Etanol Daun yang Dipetik dan Ekstrak Air Daun Gugur Pohon Ketapang (Terminalia catappa L.), ACTA Pharm. Ind, XXIX (4): 129-133.
Suganda, A.G., E.Y. Sukandar, and L. Ratna, 2006, Aktivitas Antimikroba Ekstrak Etanol Daun Dua Belas Jenis Tumbuhan Marga Terminalia (Combretaceae), ACTA Pharm. Ind, XXXI (1): 18-23
Sukandar, E.Y., A.G. Suganda, and G.U. Pertiwi, 2007, Aktivitas Sediaan yang Mengandung Ekstrak Daun Ketapang pada Kulit Kelinci yang diinfeksi dengan
Ephidermophyton floccosum dan Candida
albicans, ACTA Pharm. Ind, XXXII (1): 45-49
Sumintir, 2008, Aktivitas Antimikroba Ekstrak
Etanol Kulit Batang Ketapang
(Terminalia Catappa L.), tugas akhir
sarjana, Sekolah Farmasi-ITB, Bandung. Tenpe, C.R., A.B. Upaganlawar, A.B. Thakre,
and P.G. Yeole, 2007, Short
Communication Preliminary studies on the hypoglycemic activity of Terminalia catappa Linn. Leaf extract in normal and alloxan induced diabetic rats, Phcog.
Mag., 11, 216-219.
Thomson, L.A.J., and Evans, B., 2006,
Terminalia catappa (tropical almond),
ver. 2.2. In: Elevitch, C.R. (ed.). Species Profiles for Pacific Island Agroforestry. Permanent Agriculture Resources (PAR),