e-ISSN: 2319-2380, p-ISSN: 2319-2372.Volume 3, Issue 4 (May. - Jun. 2013), PP 01-06 www.iosrjournals.org
Mapping Of Soil Deterioration Status for Biomass Production In
The Eastern Part Of Natuna Districtss
Supriyadi, R. Sudaryanto, Afriyudi Hamzah, and Muh Khoirul Anwar
1) Institute for Research and Community Service of Sebelas Maret University, Indonesia 2) Soil Science Departement Of Agriculture Faculty of Sebelas Maret University, Indonesia3) Natuna Rgency’s Environment Agency, Indonesia
4) Agrotechnology of Agriculture Faculty Sebelas Maret University,Indonesia
Abstract: An uncontrolled utilization of land resources for biomass production can cause deterioration to the soil, so that the impact on the function and quality of soil. Soil deterioration for biomass production can be caused by the nature of the soil, or the result of human activities that cause soil disturbed or deterioration so that it can reduce the function of the soil as a medium for biomass production as normal. This research was conducted using a survey method, with observations and soil sampling, that was based on the results of a thematic map overlay scoring has been done before. This study aims to map out the conditions and status of the soils for the production of biomass in the eastern part of the Natuna Districtss based on the Government Regulation No. 150 of 2000 [1]. The mapping is used as a guideline in the surveillance and control of land degradation in eastern part of Natuna Districts. Some soil characteristics and limiting factor is contributing in the scoring that makes this land placed in the broken state, among others: soil texture, redox value, bulk density, and the soil permeability. The results showed that there are two classes of land degradation in the study area, namely minor damage and moderate damage. Areas with the minor soil deterioration were located on East Bunguran, Central Bunguran, and parts of the Northeast Bunguran. And the moderate soil deterioration was in the north part of the Northeast Bunguran and South Bunguran.
Keywords:Soil Deterioration, Biomass Production, Natuna Districts.
I. Introduction
Land resource is a natural resource that is important to continuity of human life in human activities. On the other hand, also has a function as a biomass production. According to Government Regulation No. 150 of 2000 explained that biomass is plant or parts thereof consisting of flowers, seeds, fruit, leaves, twigs, stems, and roots, including crops produced by agricultural activities, estates, and forest plantations. Biomass productions are forms of utilization of land resources to produce biomass. Utilization of land resources for the production of biomass that are not controlled can cause deterioration to the soil, so that the impact on the function and quality of soil. According to Government Regulation no. 150 of 2000 soil deterioration for biomass production is the changing of the soil nature that exceeds the standard criteria of soil deterioration. On that basis, the needed of information about the conditions and status of the soil degradation are present in an area. One of the areas that did not have data and information about the soil’s conditions and status for the production of biomass is the eastern part of the Natuna Districts, which is belong to the Riau Islands province with an area of 197,633.34 ha. So it is necessary to doing a research to determine the soil nature in the field, so then the results can be used to construct a map of the condition and status of the soils deterioration for the biomass production in this area. The obtained results are used as a guideline in conducting surveillance and control of soil degradation, thus soil resource sustainability can be maintained.
II. Materials And Methods
Materials used in the study include thematic maps consisting of: Map of Soil Type, Map of Slope, Rainfall of Map, and Natuna Districts Land Use of Map, as well as soil samples for laboratory analysis of disturbed soil samples and undisturbed soil samples. For equipment that used is consisted of: global positioning system, compass, clinometer, meter rolls, hoes, knives, rope, stationery, boardlist, plastic bags, ring samples, label paper, the analytical tools of soil physics and chemistry.
The preparation of work map or initial conditions based on the results of overlay maps consisting of several types of soil maps, land use maps, slope maps, and map rainfall scoring has been done before. Spatial overlay process using ArcView 3.3 GIS tool. From this produced work maps, can be determined sampling locations purposively, based on land unit map that is produced, taken as many as 33 locations. Sampling site is more focused on the cultivation area, the aim is to obtain the representation of samples taken for biomass production activities focused on agriculture, especially the cultivation areas, estates, forests and crops. Based on the work maps that has been generated can be used to verify the field and soil sampling. Results of field verification and subsequent laboratory analysis combined with soil deterioration criteria refer to the Minister of Environment Regulation No. 20 of 2008 [2], so you will know what parameters are considered in damaged status of the sampling area. Soil deterioration parameters consist of rock surface, solum thickness, soil texture, permeability, bulk density, total porosity, pH (H2O), electrical conductivity, redox, erosion, and the amount of microbia. When all sampling areas known soil parameters are considered defective, the relative frequency calculation is then performed to determine the status of land degradation in each research area. Results were then poured in a map of soil deterioration to biomasaa production in the research area.
III. Results And Discussion 1. Characteristics of Research Sites
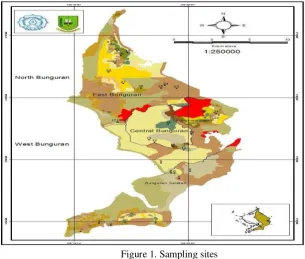
The research sites are located in the eastern part of Natuna Districts, exactly located in the Northeast Bunguran, Central Bunguran, South Bunguran, and East Bunguran. By astronomical ,study site located at 3 ° 37'49 "N - 4 ° 13'19" N and 108 ° 09'11 "E - 108 ° 24'14" longitude. For altitude areas, study site located at an altitude ranging from 3-959 meters above sea level. In the agricultural sector, the study area was divided into 4 sub-sectors of agriculture crops, estates, livestock, and fisheries. In the food crop sub-sector of the agricultural commodities that are cultivated are rice, maize, cassava, sweet potato, taro, and peanuts. And the vegetable commodities, such as peppers, cucumbers, eggplant, green beans, spinach, water spinach, banana and collards. Meanwhile, estate sub-sector commodities, namely cultivated rubber, oil palm, coffee, cloves, and pepper (Departement of Statistic 2012) [3]. The physical condition of the study area are mostly located on the slope of 0-15%, with agricultural land use in the form of dry land mixed shrubs, gardens, moor, dry forest, scrubland. On the slope of 9-15% of existing land uses in the form of dry land farming mixed shrub, dry land forests, gardens and moors. Furthermore only one sample is at 16-25% slope, with forested land use types of dry land with woody vegetation and shrubs.
Figure 1. Sampling sites 2. Results of the Soil Analysis
area showed no signs of the soil deterioration. Meanwhile, the redox value shows that all areas of research have redox values <200 mV, so that all such studies are damaged.
Other soil degradation parameters such as solum thickness, soil texture, bulk density, permeability, redox, erosion and porosity indicate a defect in some sampling sites. The properties of the soil, some of the parameters that most influence on soil deterioration score include:
2.1 Soil Texture
Figure 2. Research areas soil texture value chart
Description:
Value of the study area locations:
19 sample with clay fraction values <18%, and 15 samples of the sand fraction values >80%
Based on the analysis of 33 samples of soil texture, there are 19 soil samples have percentage of clay fraction below lower critical threshold (<18%) and 15 soil samples have a percentage of sand fraction above the critical threshold (> 80%) of which is set out in Government Regulation No. 150 of 2000, so that the said soil damaged. A low content of clay is not a result of soil management measures for the production of biomass, but more because of the nature of the soil in the study area are included in the class endodinamomorf soil is soil properties affected by the parent material. With the parent material of coarse sand-sized quartz and granite rocks, making the soil texture in the study area is dominated by the sand fraction and its content of clay fraction becomes very low. This is consistent with results from Siradz (2006) [4] who explains that the low content of fractions clay on soil is not a result of management actions for biomass production but rather a consequence of the size of the parent material in the form of coarse volcanic ash from the eruption of Merapi Mount on the north side area of research.
Land said to be damaged by clay percentage <18%, according to Hanafi (2004) [5] because the clay fraction on soil is electrically charged particles are active as anion and cation exchange sites, so the percentage that is low on soil causing a less active role. Furthermore, the rainfall in the study area of 2000-3000 mm/year are classified as high rainfall, may be damage agents of soil through kinetic energy. With the dominance of the sand fraction in the research area has become weak soil aggregate stability. As a result of rain falling to the ground, will hit the soil grains that eventually lead to runoff, which erodes and transports the surface layer of soil, causing erosion. This is consistent with the calculation of erosion by USLE method in the area of research that explains that the erosion value is greater than a predetermined critical threshold, so that soil be classified as damaged from soil erosion parameters.
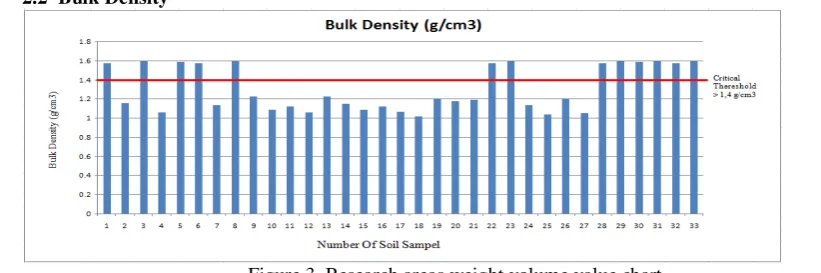
2.2 Bulk Density
Description:
Value of the study area locations: there are 13 sample with weight volume values >1.4 g/cm3
Bulk Density is defined as the mass of dry soil per unit volume that is an important indicator of soil quality due to potential effects on plant root development, exploration, and thus the volume of soil that any plant can utilize to meet the needs of water and nutrients (Karlen et al. 2008) [6]. Soil with a high density causes plant roots to be difficult to develop, and the penetration of water is limited. According to Government Regulation No. 150 of 2000 states that soil is said damaged if the bulk density of parameter values >1.4 g/cm3. Based on Figure 3, of the 33 samples taken, there were 13 samples that have bulk density values >1.4 g/cm3 so it makes the critical threshold and classified as damaged. In the 13 samples with bulk density values> 1.4 g/cm3 was influenced by the dominance of the sand fraction percentages over 90%, so the value of bulk density large and becomes into critical threshold of the soil deterioration. This is consistent with the Hanafi statement (2004) and Yulnafatmawita et al. (2007) [7] that the value of bulk density is directly proportional to the level of roughness of soil particles, so that the coarser particles will be value of bulk densityis higher.
Further low organic matter content of sandy soil increases the value of bulk density. One of the efforts should be made to reduce the value of bulk density which is the addition of organic material. This is consistent with the results of the study Triyono, Karis (2007) [8] and Refliaty et.al (2011) [9] that the addition of organic material to form a crumb structure and make pores in the soil more friable and so bulk density value is low. That is because the total pore space (TRP) is inversely proportional to the value of bulk density. The higher total soil pore space (TRP), the bulk density will be lower. The results of Souch et al. (2004) [10] explains that the treatment of soil compaction on soil texture clay loam (CL) and sandy loam (SL) led to significant changes in soil characteristics, especially the increase of soil strength and bulk density. Next on the texture of clay loam soil (CL) caused a decrease in water-holding capacity. Soil compaction treatment only affects the production of stem biomass yield decreased about 12% overall. Further significant impact occurred in experiments on soil with a sandy loam texture in the first year. Compaction increases soil strength and bulk density to a depth of 0.4 m and reduce the availability of soil water and root growth. If soil compaction can be avoided in the first year after planting it will not have a major impact on biomass yield.
The influence of the composition of soil fraction that is dominated by the sand fraction not only cause a high weight volume of soil value and to be entered in a predefined threshold, it would also affect the value of the total porosity that shows the level density of a soil that has a strong influence on the development of plant roots. Solum thickness is the depth of the roots in the soil cruising. Of 33 soil samples were taken, there were 5 samples have solum thickness <20 cm, so it makes the predetermined threshold. Ground with the dominant sand fraction, high bulk density roots reach into the soil causes low because the content of nutrient elements in the soil is very low. In addition, other factors that influence is less precise tillage, giving rise to a puddle that cause the roots difficult to grow. Percentage of the soil fraction is dominated by the sand fraction, mainly fine sand also affects the amount of soil erosion. Results of the calculation of soil erosion in the region showed that most of the study area has erosion value higher than a predetermined threshold. This is consistent with the statement Arsyad (2006) [11]: fine sand textured soil has infiltration capacity is quite high, but if the runoff happens then fine grains will be easily lost.
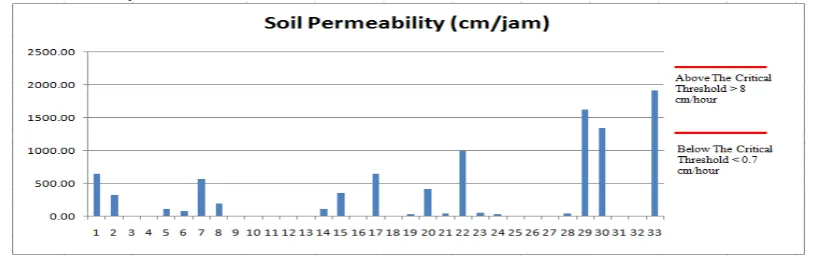
2.3 Soil Permeability
Description:
Value of the study area: 21 sample with soil permeability values >8 cm / hour Figure 4. Research areas permeability value chart
organic matter content in the soil. Soil texture in the study area is dominated by the sand fraction that has a low aggregate stability, low water holding capacity, and low ion exchange capacity. Besides low in soil aggregate stability, is also affected by the low content of organic matter in the study area. With the dominance of the sand fraction and a low content of organic matter in the soil, leading to the very low water binding ability, so the water will be directly infiltrated into the soil body very quickly. As a result, the plant needs of the water will be difficult to optimally fulfilled. Greenland (2013) [12] states the problem soil deterioration would be less serious if soil organic matter content above 5%. But with a low content of organic matter leads to improvements on land degradation becomes difficult to do. That is because there needs to be specially attention to the proper management of organic materials and what factors are important in improving the structure and the process of what happens in the soil.
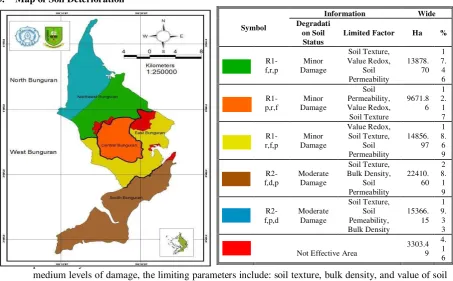
3. Map of Soil Deterioration
Figure 5. Land degradation status map for biomass production of the research areas
Based on the results that obtained in Figure 5, shows that the study area is generally divided into two classes, namely minor soil deterioration and moderate soil deterioration. For areas with minor damage Northeast Bunguran and South Bunguran, which is indicated by the color brown and blue. The level of damage is affected by soil damage resulting score. In areas with slightly damaged then the parameters are the limiting nature of the soil: soil texture, redox values, and the value of the permeability of soil. Next to areas with
medium levels of damage, the limiting parameters include: soil texture, bulk density, and value of soil permeability.
The percentage of sand fraction in areas with moderate levels of damage in the value of >90%, so that the dominance of the larger fraction causes the value of bulk density and soil permeability value is high and exceeds the established criteria. Region with slightly damaged, in some areas where the sample has taken, showing the redox value smaller than existing provisions, soil texture with the sand fraction dominance, so that the percentage of soil colloids to be very low, causing the higher value of the soil permeability and enter the damaged criteria.
IV.Conclusions
Acknowledgement
On this occasion, the authors express gratitude to the Natuna Districts’s Environment Agency for the cooperation and the assistance given to the smoothness of this study.
References
[1] Indonesian Government Regulation No. 150. In 2000. Damage Control Land for Biomass Production. Jakarta.
[2] Minister of Environment Regulation No. 20, 2008. Technical Guidelines for Minimum Standards for Environment City Districts.
Jakarta.
[3] Departement of Statistic 2012. Natuna in Figures. Ranai Natuna Districts.
[4] Siradz A. Syamsul 2006. Land Degradation due to Biomass Production in Rice Field DI-Jogjakarta. Journal of Soil and Environmental Sciences Vol 6 (1) (2006) p :47-51.
[5] Hanafiah Kemas Ali 2004. Fundamentals of Soil Science. London: King Grafindo Persada.
[6] Karlen Douglas L, Susan S. Andrews, Brian J. Wienhold and Ted M. Zobeck 2008. Soil Quality Assessment: Past, Present and Future. Electric Journal of Integrative Biosciences 6 (1):3-14.
[7] Yulnafatwawita, Luki, and Yana 2007. Studies of Soil Physical Properties Some Land Use in Bukit Gajabuih Tropical Rain Forest Gadut Mount Padang. J.Solum Vol IV No. 2 July 2007: 49-61. ISSN: 1829-7994.
[8] Triyono, Karis 2007. Effect of Soil Processing System and Mulching toward Resource Conservation Land. Journal of Agricultural Innovation Vol. 6, No. 1 in 2007 (11-21).
[9] Refliaty, Gindo Tampubolon, and Hendriansyah 2011. Effect of Compost Cow Manure Biogas Rest to Repair Some Physical Properties of Ultisol and Results in Soybean (Glycine max (L.) Meriil). J. Hidrolitan. Vol. 2: 3: 103-114, 2011 ISSN 2086-4825. [10] Souch C.A, P.J Martin, W. Stephens and G. Spoor 2004. Effect Of Soil Compaction And Mechanical Damage At Harvest On
Growth And Biomass Production Of Short Rotation Coppice Willow. Journal of Plant and Soil 263: 173-182.
[11] Arsyad S 2006. Soil and Water Conservation. Bogor: IPB Press.