Pages: 140-144
Diversity of soil macrofauna on different pattern of sloping land
agroforestry in Wonogiri, Central Java
MARKANTIA ZARRA PERITIKA, SUGIYARTO , SUNARTO
Department of Biology, Faculty of Mathematics and Natural Sciences, Sebelas Maret University Surakarta. JI. Ir. Sutami 36a Surakarta 57126, Central Java, Indonesia. Tel./fax: +62-271-663375. email: [email protected]
Manuscript received: 27 December 2010. Revision accepted: 1 April 2011.
ABSTRACT
Peritika MZ, Sugiyarto, Sunarto. 2012. Diversity of soil macrofauna on different pattern of sloping land agroforestry in Wonogiri, Central Java. Biodiversitas 13: 140-144.The purposes of this study were to determine the diversity level of soil macrofauna on different patterns of sloping land agroforestry, in Wonogiri District, Central Java, and to find out the relationship between environmental factors and the level of soil macrofauna diversity. The study was conducted by sampling at three different patterns of agroforestry, namely: pattern of mixed agroforestry (PAC), pattern of teak agroforestry (PAJ), and the pattern of sengon agroforestry (PAS). The field sampling used two methods, namely pit fall traps to obtain above ground macrofauna, and hand sorting methods to obtain underground macrofauna, on land slope of 39%, 35%, and 27%. The data were collected to determine the diversity index of soil macrofauna; and the environmental factors were also measured. The relationship between environmental factors and the diversity index of soil macrofauna was presented in Pearson's correlation analysis. The results showed that the pattern of sloping land agroforestry in Wonogiri District, Central Java had different diversity index of soil macrofauna. The average diversity index of surface macrofauna was the PAC (0.710), PAS (0661), and PAJ (0.417). The average diversity index of underground macrofauna was the PAC (0.887), PAS (0.860), and PAJ (0.843). The diversity index of soil macrofauna in various patterns of sloping land agroforestry showed that there was a correlation with environmental factors.
Key words:soil macrofauna, diversity, agroforestry, sloping land
INTRODUCTION
Most areas in Indonesia are hilly or mountainous areas that create the sloping lands (Setyawan et al. 2006). Sloping lands are scattered in the tropics. Around 500 million people use them for farming (Craswell et al. 1997). Wonogiri is one of the regions having many mountains and hills with an area of 182,236.02 ha consisting of different types of land, among others: alluvial, litosol, regosol, andosol, grumusol, mediterranian and latosol. Wonogiri has a harsh topography. Most of the land is rocky and dry and is not good for agricultural purposes (BPS 2010).
One technology being assessed as appropriate with the conditions of sloping lands is the application of agroforestry, a land management system with the basis of sustainability, which increases the overall land production, simultaneously or sequentially combines the production of agricultural crops (including tree plants) and forest plants and/or animals on the same land unit, and implements new ways of managing appropriate to the local population culture (Kartasubrata 1991; Damanik 2003).
Agroforestry is appropriate for the management of watershed area (flood and landslide control) with a variety of considerations, namely the land rehabilitation which can improve the physical fertility (improving land structure and water content), chemical fertility (increasing levels of organic matter and nutrient availability) and land biology (increasing activity and diversity), land morphology (the
formation of solum); and it has an important role in rehabilitating degraded land (Wongso 2008).
The largest land reforestation program in the developing countries has been done in China under China's Sloping Land Conversion Program (SLCP), having the goal of converting 14.67 million hectares of cropland to forests by 2010 (4.4 million of which is on land with slopes greater than 25°) and an additional goal of afforesting a roughly equal area of wasteland by 2010 (Bennett 2008). This program is proven to improve soil quality and increase rural household incomes (Grosjean and Kontoleon 2009; Xu et al. 2010).
Agroforestry as a system of land use is more acceptable by the society because it is profitable for the socio-economic development, and as a venue for farmers community empowerment and conservation of natural resources and rural areas environment management. This pattern is considered very suitable to be developed in Solo s upstream of watershed area that has many aslant areas (Soedjoko 2002). One of Solo s upstream of watershed area is located in Wonogiri, Central Java.
The relation between soil macrofauna diversity and ecosystem function is very complex and mostly unknown. The concern to conserve of soil macrofauna biodiversity is very limited (Lavelle et al. 1994; Sugiyarto 2008). Currently, there is no research about the diversity of soil macrofauna found in various patterns of sloping land agroforestry, in Wonogiri District, Central Java, Indonesia. Given the importance of soil macrofauna role in the ecosystem and relatively limited information about the existence of soil macrofauna in various patterns of sloping land agroforestry, it is necessary to make inventory about the diversity of soil macrofauna on the area.
This research in soil macrofauna diversity on Sloping land agroforestry in Wonogiri District, Central Java was done by identifying and quantifying soil macrofauna diversity in various patterns of Sloping land agroforestry and explained the relationship between environmental factors and levels of soil macrofauna diversity.
MATERIALS AND METHODS Study area
The research was conducted in sloping land area of Semagar Duwur Village, Girimarto Subdistrict, Wonogiri District, Central Java, Indonesia.
Procedure
Sampling point determination There were three observation stations with the slope of 39%, 35%, and 27%, respectively. Three patterns of agroforestry were determined in each station namely: mixed agroforestry pattern (PAC), teak agroforestry pattern (PAJ) and sengon agroforestry pattern (PAS). Then, with simple random sampling method, sampling points were randomly determined in each pattern. Soil macrofauna sampling
The method of pit fall traps was used to get surface macrofauna and the method of hand sorting was used to get underground macrofauna (Suin 1997; Maftu ah et al. 2005).
Identification of soil macrofauna Identification of soil macrofauna was done with referrence to some books, including Borror et al. (1989), and Suin (1997). sampling point, several abiotic environmental factors were measured, both the characters of physics and chemistry, namely: (i) physical characteristics (intensity of sunlight, air relative humidity, air temperature, soil temperature); (ii) chemical characteristics (soil pH, soil organic matter). Data collection techniques
The species of soil macrofauna were identified and counted normally. Environmental factors variables were taken using its own measuring instruments on sites directly or in the laboratory indirectly.
Data analysis
The data were used for calculating the Diversity Index. Then, Pearson correlation analysis is performed to determine the relationship of diversity indices with environmental factors.
Table 1.Environmental factors in a variety of agroforestry patterns on sloping land area of Semagar Duwur Village, Girimarto Subdistrict, Wonogiri District, Central Java.
Site
Average 10 7,375 55.4 28.7 26.4 5.52 3.73
PAJ I 7 33,310 51.0 33.3 29.0 5.24 3.49
PAJ II 2 16,490 58.3 29.0 29.3 5.36 5.39
PAJ III 9 20,053 54.0 31.7 27.7 5.81 3.07
Average 6 23,284 54.4 31.3 28.7 5.47 3.98
PAS I 7 27,136 46.0 33.0 29.3 5.55 3.46
PAS II 5 9,430 51.3 30.7 28.0 5.29 4.62
PAS III 3 7,752 59.3 28.7 28.0 6.12 2.70
Average 5 14,773 52.2 30.8 28.4 5.65 3.59
Note for Table 1, 2 and 3: I, II, III: The name of the station (Station I, II, III); PAC: Patterns of Mixed Agroforestry, PAJ: Patterns of Teak Agroforestry, PAS: Patterns of sengon agroforestry
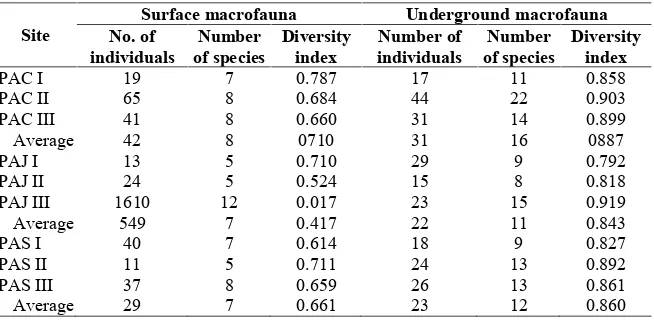
Table 2.The number of individuals, the number of species and diversity index of soil macrofauna at each research station
Site No. ofSurface macrofauna Underground macrofauna
individuals of speciesNumber Diversityindex individualsNumber of of speciesNumber Diversityindex
PAC I 19 7 0.787 17 11 0.858
PAC II 65 8 0.684 44 22 0.903
PAC III 41 8 0.660 31 14 0.899
Average 42 8 0710 31 16 0887
PAJ I 13 5 0.710 29 9 0.792
PAJ II 24 5 0.524 15 8 0.818
PAJ III 1610 12 0.017 23 15 0.919
Average 549 7 0.417 22 11 0.843
PAS I 40 7 0.614 18 9 0.827
PAS II 11 5 0.711 24 13 0.892
PAS III 37 8 0.659 26 13 0.861
RESULTS AND DISCUSSION
Environmental factors intensely determined the structure of soil animal communities. Since, one of soil animals was soil macrofauna being part of the soil ecosystem, therefore, in studying soil animal ecology, physico-chemical soil factors were always measured (Suin 1997) (Table 1)
The intensity of sunlight received by the ecosystem was an important determinant of primary productivity, which henceforth would affect species diversity and nutrient cycling (Mokany et al. 2008). Air humidity could be affected by light intensity. Air humidity was higher when light intensity was lower (Sulandjari et al. 2005). Temperature was influenced by the radiation of sunlight received by earth (Lakitan 2002). Sulandjari et al. (2005) stated that the lower the light intensity the lower the temperature. Fluctuation was also influenced by weather conditions, topography and soil conditions (Suin 1997). Soil pH value could be related with soil organic matter content. Decomposition of organic matter tended to increase the acidity of the soil due to the production of organic acids (Killham 1994; Malakew 2001).
From Table 2, it can be concluded that the PAC had a positive influence on the diversity index of soil macrofauna, but the PAS and PAJ gave a different effect. Different influences of PAS and PAJ to soil macrofauna diversity index could be due to differences in affecting environmental factors.
Supporting capacity of agroforestry patterns to the life of surface macrofauna could directly be associated with a number of vegetation types (Table 1).
PAC had highest number of vegetation types, so it could be concluded that the supporting capacity of PAC to the life of surface macrofauna was high. More diverse species of plant provided more food
supply to the soil surface
macrofauna. On the other hand, PAJ had the lowest number of vegetation types, so the supporting capacity for soil surface macrofauna life was also low. From the observation can be seen that the diversity index macrofauna in the soil and the number of species found greater value when compared with the soil surface macrofauna.
The study found surface macrofauna with the amount of 27 species from a single phylum namely Arthropods. This arthropod phylum was consisting of two classes namely Insecta and Arachnids. Insecta class was found consisting of six order of Hymenoptera, Coleoptera, Lepidoptera, Hemiptera, Blatodea, and Orthoptera. Arachnids class was found consisting of only one order namely Araneae.
Underground macrofauna were found of 46 species which were divided into two phyla, namely annelids and arthropods. The phylum Annelida was only found in one class namely Chaetpoda. The phylum Arthropods was found consisting of five classes, namely, Insecta, Diplopoda, arachnids, Chilopoda and Malacostraca. Wallwork (1970) explained that the Phylum Arthropoda was a group of soil animals, which generally showed the highest dominance among the organisms making up the community of soil animals. The species was 29 species of 46 species and were originated from the Insecta class. This was in accordance with the revelation of Borror et al. (1989) that the Insecta class was the dominant animal on earth. Borror et al. (1989) stated that the ants were the most common group and were widespread in terrestrial habitats. Ants were groups of animal which species and populations were abundant.
Dominant surface macrofauna which was found mostly come from the family Formicidae (ants). Rufipes Leptomyrmexof the subfamily Dolichoderinae macrofauna was the dominant surface macrofauna, and was the most commonly found species. Dolichoderinae were predators of soft beetles, such as aphids (Shattuck 1999). Solenopsis invicta was a species of fire ants which were commonly found as pests of plants. This species was easily spread in suitable habitats (NPS 2010). Genus Ponera were distributed along Indo-Australia (Taylor 1967; Csosz and Seifert 2003).
The life activity of soil macrofauna could not be separated from the influence of environmental factors. The activity of soil organisms is generally influenced by various
Table 3.Dominant soil macrofauna in agroforestry of Wonogiri District, Central Java
Site Surface macrofauna Underground macrofauna
PAC I Ant A (Subfamily Dolichoderinae) Phyllophagasp.
PAC II Leptomyrmex rufipes Camponotus nigriceps
PAC III Leptomyrmex rufipes Byturussp.
PAJ I Solenopsis invicta Microtermessp.
PAJ II Leptomyrmex rufipes Ponerasp.
PAJ III Leptomyrmex rufipes Oniscussp.
PAS I Solenopsis Invicta Phyllophagasp.
PAS II Ponerasp. andAllonemobius fasciatus Blatellasp.
PAS III Leptomyrmex rufipes Blatellasp.
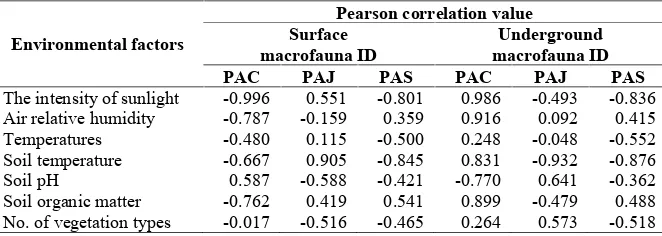
Table 4. Correlation analysis between the level diversity of soil macrofauna and environmental factors.
Environmental factors
Pearson correlation value Surface
macrofauna ID macrofauna IDUnderground
PAC PAJ PAS PAC PAJ PAS
The intensity of sunlight -0.996 0.551 -0.801 0.986 -0.493 -0.836
Air relative humidity -0.787 -0.159 0.359 0.916 0.092 0.415
Temperatures -0.480 0.115 -0.500 0.248 -0.048 -0.552
Soil temperature -0.667 0.905 -0.845 0.831 -0.932 -0.876
Soil pH 0.587 -0.588 -0.421 -0.770 0.641 -0.362
Soil organic matter -0.762 0.419 0.541 0.899 -0.479 0.488
factors, including climate (rainfall, temperature etc.), soil (acidity, moisture, temperature, nutrients etc.) and vegetation (forests, grasslands, shrubs and other) (Hakim et al. 1986).
The analysis showed that the Pearson correlation value between soil macrofauna diversity indices with abiotic environmental factors ranging from 0.017 to 0.996. Pearson correlation values were positive and some were negative. Correlation coefficient (r) could be translated in several levels, namely: a) r = 0, no correlation; b) 0 <r 0.200, the correlation is very low / very weak; c) 0.200 <r 0.400, the correlation is low / weak but certain; d) 0.400 <r 0.700, significant correlation; e) 0.700 <r 0.900, the correlation is very high, robust; f) 0.900 <r 1, the correlation is very high, very robust, reliable (Hasan 2001 ).
The increase of light intensity could decrease the soil macrofauna diversity index and vice versa. The upswing of light intensity might result in some underground macrofauna to be dead due to the underground environmental conditions that was too hot. The intensity of sunlight was also affected by canopy closure. The thick canopy allowing sunlight to reach the ground floor reduced, and vice versa (Sanjaya 2009; Sitompul 2002). Mokany et al. (2008) stated that the intensity of sunlight affect species diversity. Suhardjono (1988) stated that research in the Bogor Botanical Gardens show there is more animal on the forest floor with less sunlight than the one with much sunlight.
Air relative humidity will decrease the diversity of surface macrofauna index. It agrees with the statement of Purwanti (2003) that the increase in air humidity can interfere the oxygen uptake (respiration) of surface macrofauna. The disruption of the process led to the decrease of soil macrofauna diversity. It might be because of the unability of soil macrofauna to survive or to migrate to another location.
The increase of relative air humidity will increase diversity index of soil macrofauna and vice versa. It is in accordance with the results of research conducted by Sugiyarto (2000) regarding the diversity of soil macrofauna at various age of sengon stands at Forest Police Resort (RPH) Jatirejo, Kediri. It shows the same thing that there is a positive correlation between the relative air humidity with soil macrofauna. The correlation between two variables is 0.04 for surface macrofauna and 0.05 for underground macrofauna.
An increase of air temperatures will reduce soil macrofauna diversity index. Lakitan (2002) stated that air temperature was affected by radiation of sunlight received by the earth. The higher the light intensity is, the higher the air temperature (Sulandjari et al. 2005). Temperature which is too high would cause some physiological processes, such as reproductive activity, metabolism, and respiration, to be disrupted (Kevan 1962; Sugiyarto 2007). The disruption of physiological processes of soil macrofauna will then affect the diversity.
An increase in soil temperatures will lower soil macrofauna diversity index and vice versa. Soil temperatures which are too high would cause some physiological processes such as reproductive activity,
metabolism, and respiration, to be disrupted (Kevan 1962; Sugiyarto 2007). Disruption of physiological processes of soil macrofauna would then affect diversity. It is in accordance with the research of Handayani (2008) regarding the inventory diversity of soil macrofauna in carrot crop (Daucus carota L.) which was fertilized with various organic and inorganic fertilizers. It showed soil temperature having negative correlation with the diversity of soil macrofauna particularly on Coleoptera order.
An increase in acidity would increase the diversity index of soil macrofauna and vice versa. High number of soil acidity means having a low pH (pH below 7). In tropical environments where some soil has been sour for a long period of time, soil fauna have evolved its tolerance to low pH. Most of the macrofauna including diggers species such as worms and termites tend to decline its abundance in large amounts in acidic soil conditions, with most activities are limited to layers of waste where the pH is significantly higher and usually alkaline (DPI 2010).
An increase of soil organic matter would increase the diversity index of soil macrofauna and vice versa. Soil macrofauna improves decomposition of organic residues, although its role depends on the nature of the material in it (Karanja et al. 2006). The more the organic material available the bigger the number of individuals of soil macrofauna, because it is able to protect against environmental stresses both the high temperature environment and the possible presence of predators (Sugiyarto 2007). TSK (2008) states that soil macrofauna take nutrients from the soil organic matter, so the availability of adequate soil organic matter will affect the survival of soil macrofauna.
CONCLUSION
Based on research results, it can be concluded that various patterns of sloping land agroforestry had a different index of soil macrofauna diversity. There was a correlation between index diversity of soil macrofauna with environmental factors in various patterns of sloping land agroforestry.
REFERENCES
Bennett MT. 2008. China's sloping land conversion program: Institutional innovation or business as usual? Ecol Econ 65 (4): 699-711
Borror DJ, Triplehorn CA, Johnson NF. 1989. An introduction to the study of insects. 6th ed. Saunders, Philadelphia.
BPS. 2010. Wonogiri in Figure 2010. Central Bureau of Statistics, Wonogiri. [Indonesia]
Craswell E, Sajjapongse A, Howlett D, Dowling A. 1997. Agroforestry in the management of sloping lands in Asia and the Pacific. Agrofor Syst 38 (1-3): 121-137.
Csosz S, Seifert B. 2003.Ponera testaceaEmery, 1895 Stat. N.-A sister species ofP. coarctata(Latreille, 1802) (Hymenoptera, Formicidae). Acta Zool Hung 49 (3): 201-214.
Damanik RIM. 2003. Technology of agroforestry in dryland (West Nusa Tenggara Province). Study Program of Forest Science, Faculty of Agriculture, University of North Sumatra, Medan. [Indonesia] DPI [Department of Primary Industries]. 2010. Major affects of soil
Grosjean P, Kontoleon A. 2009. How sustainable are sustainable development programs? The case of the Sloping Land Conversion Program in China. World Dev 37 (1): 268-285
Hakim N, Nyakpa MY, Lubis AM, Nugroho SG, Dika MA, Go BH, Bailley HH. 1986. Principles of soil science. University of Lampung, Bandar Lampung.
Handayani P. 2008. Diversity inventory of soil macrofauna at carrots cultivation (Daucus carotaL.) with different organic and inorganic fertilizers. [Honorary Thesis]. Study Program of Soil Science. Faculty of Agriculture, Sebelas Maret University, Surakarta. [Indonesia] Hasan I. 2001. Principles of statistics matter 2 (Inferensif Statistics). 2nd
ed. Bumi Aksara. Jakarta. [Indonesia]
Karanja NK, Ayuke FO, Swift MJ. 2006. Organic resources quality and soil fauna: Their role on the microbial biomass, decomposition and nutrient release patterns in Kenyan soils. Trop Subtrop Agroecosyst 6: 73-86.
Kartasubrata J. 1991. Planning and implementation aspects based on some successful agroforestry projects in Indonesia. In: Mellink W YS Rao, MacDicken KG (eds) Agroforestry in Asia and the Pacific. RAPA Publication 1991/5. Bangkok, FAO Regional Office for Asia and the Pacific and Winrock International Institute for Agricultural Development.
Kevan DKM. 1962. Soil animals. HE & G Witherby, London.
Killham K. 1994. Soil ecology. Cambridge University Press. Cambridge. Lakitan B. 2002. Principles of climatology. Raja Grafindo Persada,
Jakarta. [Indonesia]
Lavelle P, Dangerfield MT, Fragoso C et al.. 1994. The relationship between soil macrofauna and tropical soil fertility. In Woomer PL, Swift MJ (eds). The biological management of tropical soil fertility. John Wiley and Sons, Chichester.
Maftu ah E, M Alwi, Willis M. 2005. Potential of soil macrofauna as bioindicator of peat land quality. Bioscientiae 2 (1):1-14.
Makalew ADN. 2001 Diversity of soil biota on non tillage agroecosystems. School of Graduates, Bogor Agricultural University, Bogor. [Indonesia]
Mokany A, Wood J T, Cunningham SA. 2008. Effect of shade and shading history on species abundances and ecosystem processes in temporary ponds. Freshwater Biol 53 (10): 1917-1928.
NPS [National Park Service]. 2010. Integrated pest management manual (fireants). National Park Service, US Department of the Interior, Washington DC. www.nature.nps.gov/biology/ipm/manual/fireants.cfm.
Purwanti. 2003. Diversity of soil macrofauna in different types and combination of intercropping crop under sengon stand (Paraserianthes falcataria (L.) Nielson) in Forest Police Station (RPH) Jatirejo Kediri, East Java. [Honorary Thesis]. Department of Biology, Faculty of Mathematics and Natural Sciences, Sebelas Maret University Surakarta. [Indonesia]
Rahmawaty. 2004. Study on soil mesofauna diversity in Forest Nature Recreation Sibolangit (Sibolangit Village, Sibolangit Subdistrict, Deli
Serdang District, North Sumatra Province). [Honorary Thesis]. Study Program of Forest Management, Department of Forestry, Faculty of Agriculture, University of North Sumatra, Medan. [Indonesia] Sanjaya A. 2009. Soil macrofauna diversity in different stands types at
Alas Kethu, Wonogiri District, Central Java. [Honorary Thesis]. Department of Biology, Faculty of Mathematics and Natural Sciences, Sebelas Maret University Surakarta. [Indonesia]
Setyawan A, Wilopo W Suparno, Supriyanto. 2006. Know your natural disaster of landslide and its mitigation. Inovasi Online 8 (Nov. 2006). http://io.ppi-jepang.org/article.php?id=196. [Indonesia]
Shattuck S. 1999. Australian ants: Their biology and identification. CSIRO Publishing. Melbourne.
Sitompul SM. 2002. Radiaion in agroforestry system. In: Hairiah K, Utami SR, Lusiana B (eds) WaNuLCAS, Simulation model for agroforestry systems. International Centre for Research in Agroforestry, Southeast Asian Regional Research Programme, Bogor, Indonesia. [Indonesia]
Soedjoko SA. 2002. Management of land resources. www.mayong.staff.ugm.ac.id. [Indonesia]
Sugiyarto. 2000 Diversity of soil macrofauna in different sengon age stands at RPH Jatirejo, Kediri District. Biodiversitas 1 (2): 47-54. [Indonesia].
Sugiyarto. 2008. Soil macrofauna conservation in agroforestry systems. National Seminar on Education Biology: Quality Improvement of Biological Learning through Applied Biology Enrichment Materials. Study Program and Alumny Association of Bioscience, Graduate Program, Sebelas Maret University Surakarta, 24 Mei 2008. [Indonesia]
Sugiyarto, Efendi M, Mahajoeno E, Sugito Y, Handayanto E, Agustina L. 2007 Preferency of soil macrofauna to crops residue at different light intensity. Biodiversitas 7(4): 96-100. [Indonesia]
Suhardjono YR. 1998. Litter insects: taxon diversity and their role in the Bogor Botanical Gardens. J Biota 3 (1): 16-24. [Indonesia]
Suin N M. 1997 Soil animals ecology. Bumi Aksara. Jakarta. [Indonesia] Sulandjari, Pramono S, Wisnubroto S, Indradewa D. 2005. Microclimate
relationship with the growth and yield of sarpagandha (Rauvolfia serpentinaBenth.). Agrosains 7 (2): 71-76. [Indonesia]
Taylor RW. 1967. A monographic revision of the ant genus Ponera
Latreille (Hymenoptera: Formicidae). Pac Insect Monogr 13: 1-112. TSK [Tim Sintesis Kebijakan]. 2008. Utilization of soil biota for
sustainable agriculture productivity on acid dryland. Pengembangan Inovasi Pertanian 1 (2): 157-163. [Indonesia]
Wallwork JB. 1970. Ecology of soil animals. Mc Graw-Hill. London. Wongso SA. 2008. Agroforestry, anticipation of erosion and landslides.
www.perumperhutani.com [Indonesia]