THE EFFECT OF PROJECT BASED LEARNING (PjBL) ON STUDENTS’ UNDERSTANDING AND CREATIVITY
IN LEARNING GLOBAL WARMING CONCEPT
RESEARCH PAPER
(SKRIPSI)
Submitted as requirement to obtain degree of SarjanaPendidikan in International Program on Science Education
By
Ahmad ZimamulUmam 1000293
INTERNATIONAL PROGRAM ON SCIENCE EDUCATION FACULTY OF MATHEMATICS AND SCIENCE EDUCATION
THE EFFECT OF PROJECT BASED LEARNING (PjBL) ON STUDENTS’ UNDERSTANDING AND CREATIVITY
IN LEARNING GLOBAL WARMING CONCEPT
Oleh
Ahmad ZimamulUmam 1000293
Sebuahskripsiyangdiajukanuntukmemenuhi salahsatu syaratmemperolehgelar SarjanaPendidikandiFakultas PendidikanMatematikadanIlmuPengetahuan Alam
©Ahmad ZimamulUmam
1000293
Universitas PendidikanIndonesia
Juli2014
HakCiptadilindungiundang-undang
vii
D. Research Objective..………...….
E. Limitations of Problem…...……….
F. Significance of Research…...………..
G. Assumption………..
H. Hypothesis………...
CHAPTER II PROJECT-BASED LEARNING, STUDENTS’
UNDERSTANDING, STUDENTS’ CREATIVITY, GLOBAL WARMING
A. Project Based Learning..…………..……….
B. Creativity………..…….……..……….……….
C. Concept Understanding.…...……….………
CHAPTER III METHODOLOGY
A. Research Method and Design……… B. Research Subject………...………...
CHAPTER IV RESULT AND DISCUSSION
A. Research Result ..………...……….. B. Research Discussion ....………...………
CHAPTER V CONCLUSIONS AND RECOMMENDATIONS
ix
Ahmad Zimamui Umam, 2014
LIST OF TABLES
Page Table 3.1 The one group pretest and post-test……….……...………....
Table 3.2 The Classification of Discriminating Power…….………...
Table 3.3 Level of Difficulty……….……... Table 3.4 Test Item Specification………..…………....……...
Table 3.5 Rubric to Measure Students’ Creativity (Blue Print).……....…... Table3.6Table of Students’ Response Questionnaire... Table 3.7 Recapitulation of test item for students’ understanding...
Table 3.8Interpretation Table...……… Table3.9 Percentage Interpretation……...………...…....
Table3.10 Scoring Guideline of Students’ Response…...………... Table 3.11Percentage Interpretation………... Table 4.1 Summary of Students’ Understanding Statistical Test…………
Table 4.2 Summary of Students’ Cognitive Domain of Bloom’s Taxonomy
Table 4.3 The Result of Normality and Homogeneity, and T-Test…………..
Table 4.4 Summary of Students’ Creativity before Project Based Learning Implementation……….
Table 4.5 Profile of Students’ Creativity after Project Based Learning Implementation………...
LIST OF FIGURES
Page Figure 2.1 The Three Components of Creativity...
Figure 2.2Revised Bloom Taxonomy... ...
Figure 3.1Diagram of Research Plot... ... Figure 4.1 Graph of Cognitive Domain Achievement...
Figure 4.2Students’ Creativity Product before Project Based Learning Implementation ... Figure 4.3Students’ Creativity Product after Project Based Learning
Implementation... Figure4.4Graph of Creativity Dimension... ...
Figure 4.5Graph of Students’ Response towards Project Based Learning on Teamwork Ability………..
Figure 4.6Graph of Students’ Response towards Project Based Learning on Understanding………
10 14
24 40
43
45 47
48
xi
Ahmad Zimamui Umam, 2014
Figure 4.7Graph of Students’ Response towards Project Based Learning on Creativity………..………..
Figure 4.8Graph of Students’ Response towards Project Based Learning on Poster Product……… Appendix A.4 Power Point Slide ………
B. RESEARCH INSTRUMENT
Appendix B.1Instrument of Students’ UnderstandingTest ………... Appendix B.2Instrument of Students’CreativityRubric……….……….. Appendix B.3Instrument of Questionnaire Response………
C. RESULT OF RESEARCH DATA
AppendixC.1 Data Processing of Students’ UnderstandingResult ………….. Appendix C.2 Data Processing of CreativityResult………. …….. Appendix C.3 Data Processing of StudentResponseResult...………...
iii Ahmad Zimamui Umam, 2014
THE EFFECT OF PROJECT BASED LEARNING (PjBL) ON STUDENTS’ UNDERSTANDING AND CREATIVITY IN LEARNING GLOBAL
WARMING CONCEPT
Ahmad ZimamulUmam
International Program on Science Education
ABSTRACT
This research investigated the effect of project based learning (PjBL) on
students’ understanding and creativity in learning global warming concept. The
method which is used in this research was combination of pre experimental and descriptive with one group pretest-posttest design. The sample was taken purposively (n=19 students) grade secondary 1 in a Private International School. The quantitative data of this research was obtained through objective test, while the qualitative data was gained through rubric and questionnaire. According to the
analysis of the research, it is obtained an improvement in both students’ understanding and creativity. Students’ understanding improvement obtained
normalized gain as much as 0.61 which is categorized into medium improvement.
The students’ creativity is shifting. Before project based learning being
implemented it was in enough categories and changed into good category in the end. It shows that project based learning can facilitate students to explore their creativity. The improvement occurred in all creativity dimensions that are novelty, resolution, and elaboration & synthesis. Students’ respond toward implementation of project based learning showed positive respond in all indicators. It indicates that the implementation of project based learning in global
warming concept can improve students’ understanding and creativity in secondary
level.
PREFACE
Bismillahirrahmaanirrahiim.
All of praises and gratefulness are always given to Allah SWT for His blessing, mercy, and love so that the writer can finish research paper entitled
“The Effect of Project Based Learning on Students’ Understanding and
Creativity in Learning Global Warming Concept”. Shalawat and salam may always be devoted to our Great Prophet Muhammad SAW, to all his families, relatives, and also to all Muslims brothers around the world.
This research paper is the last demands and requirements for all university students in educational major to finish their study and obtain SarjanaPendidikan, the same requirements in International Program on Science Education study program. There are five chapters in this research paper that describes how is the effect of project based learning on students’ understanding and creativity in learning global warming. The research paper consists of introduction, supportive theory, research methodology, result and discussion of the research, conclusion and recommendation.
However, the perfection belongs to Allah SWT, the author realizes that this research paper still has so many weakness and need to be improved. Therefore, the writer expects comments and suggestions are most welcome to improve the quality of learning process in the future. Hopefully the results that presented in this research paper can be useful for all readers from educational field as reading source and reference to gain more knowledge.
Bandung,July 2014
v Ahmad Zimamui Umam, 2014
ACKNOWLEDGEMENT
The completion of this research paper is not spared from the help of various parties in so many ways to the author, therefore in this occasion the author would like to express deepest thank you and highest appreciation to the following:
1. Dr. Harry Firman, M.Pd as my supervisor who always motivates me and gives me the best suggestion to improve my research paper. Thank you for everything that you taught and guide me to became a long life learner. 2. Mrs. Rika Rafikah Agustin, M.Pd as my supervisor who always support
me to finish my research paper. Thank you for the kindness and patience in guiding the author to finish his research paper.
3. Dr. Diana Rochintaniawati, M.Ed as Head of Study Program of International Program on Science Education thank you for your motivation and guide me during writing research paper. Thank you for all advices and spirits that you always give to me.
4. DarulHikam International School family. Mrs. Niknik as principal, thank you for the permission to implement the research. Mrs. Binar, thank you for the guidance and motivation during the teaching practice program. And also for all teachers and staff, thank you for the help and support. My students in Secondary 1 A and 1 B, thank you for being such a great students and thank you for the experience, knowledge, cooperation, spirit and pray.
6. My guidance partner, TitaYartini. Thank you for being such a great partner during finishing the research paper, and also thank you for the spirit, support and help.
7. My classmates of IPSE batch 2010 who always support and remind me to finish the research paper, Rifqi, Reza, Belgha, Rizal, Ryad, Tita, Novi, Frili, Dineu, Atikah, Nurul, Silmi, Owe, Adinda, Ajeng, Shinna, Ifa, Syara, Mahri, and Sadakat.
8. My best friend, DaniNurArifin. Thank you for always support me to be a better person. And also Ahmad FauziMulyana and Dimas Mutiar, thank you for the support during finishing the research paper. You all remind me that a friend will never let their friend feel alone.May Allah bless our friendship.
1 Ahmad Zimamui Umam, 2014
CHAPTER I INTRODUCTION A. Background
It isa common problem from middle school students that school is boring and that they cannot relate to nor understand the material that is presented to them each day in class(King, 2009). Students are neither passionate nor motivated to learn in class. This problem can be both challenge and opportunity for teacher to deliver the material in alternative way by engaging the students to learn in class. Students’ engagement can be done by providing several activities which lead them to have experience and connect them immediately to the knowledge.
On the other hand, education system should also contribute towards the development of creativity (Osborn, 1992 in Zampetakis). Creativity is an important aspect in life, because humans’ life is always faced with challenges which need creative idea to overcome those challenges. By developing creativity, students are hoped to be able to solve the problems given. Similarly, Munandar (1992) stated that person who has high level of creativity will show possible answers of a problem. Besides, creativity also makes students become brave to express their idea.
According to government regulation number 17 years 2010 regarding Management and Operation of Education aims to build a foundation for the development of potential student to become human who: faith and fear of God Almighty, noble and sublime personality; knowledgeable, skilled, critical, creative, and innovative; healthy, independent, and confident; tolerant, sensitive social, democratic and accountable. Here, it is clearly stated that one of education aim is to develop students’ creativity.
2
that students’ creativity improve after given an activity in form of project to the students. The research result stated that by doing project, students are able to develop their creativity. Similarly, Rogers in Munandar (2009) stated that this encouragement is the primary motivation for creativity when individuals form new relationships with the environment in an attempt to be him fully. Here, motivation can be provide by the teacher through several ways. One way to provide activity is by engaging the students in a project which will lead them to have experience and connect them immediately to the knowledge.
Projectbased learning is the instructional strategy of empowering learners topursue content knowledge on theirown and demonstrate their new understandings through a variety of presentation modes. Effective project-based learning has the following characteristics: leads students to investigate important ideas and questions, is framed around an inquiry process, is differentiated according to student needs and interests, is driven by student independent production and presentation rather than teacher deliver the information, requires the use of creative thinking, critical thinking, and information skill to investigate, draw conclusions about, and create content, connects to real world and authentic problem issues. The skill set for project-based learning is diverse includes science and technological literacy and group process skills. Throughout the process students will engage in and develop proficiency in these types of skills: comprehension skills, research and writing skills, questioning skills, group processes/ collaborative learning skills, sequencing and chronology skills, skills with resources such as maps and globes, skills with presentation tools such as charts and graphs, analysis skills, communication skills, problem solving and critical thinking skills, task and self-management skills (King et.al., 2009).However, the skill set which is needed to be mastered by students already listed in every instructional curriculum and some adaptation should be considered.
3
Ahmad Zimamui Umam, 2014
analyze two variables that are students’ understanding and students’ creativity. Developing from those variables this research will also investigate students’ respond toward implementation of project based learning.
B. Research Problems
According to the background which has already stated, the problem of this research is “How is the effect of project based learning on students’ understanding and creativity in learning global warming?”
C. Research Question
Based on the statement of problem, it can be described into several research questions as follow:
1. How is the effect of project based learning on students’ understanding in learning global warming?
2. How is the effect of project based learning on students’ creativity in learning global warming?
3. Whatis students’ respond toward implementation of project based learning?
D. Research Objective
According to the problem that has been proposed the aim of this research is to investigate the effect of project based learning on students’ understanding and creativity in learning global warming, furthermore this research is conducted to obtain some other information and arranged as follows:
1. To investigate the improvement of students’ understanding through the implementation of project based learning
2. To investigate students’ creativity through their project based learning product
4
E. Limitation of Problems
To avoid widening of problem on this research, then the research will be limited for the following things:
1. The stage of project-based learning which is used in this research is based on Aaron Adair and Bao Lei research in 2012.
2. The students understanding measured is the cognitive achievement based on Bloom’s Taxonomy (C1-C6) and four different knowledge dimension (factual, conceptual, procedural, and metacognitive)
3. The project in this project-based learning is to make product of poster that represent global warming concept
4. The students’ creativity is measured based on the product that they create
F. Significant of Research
This research is important to be conducted because it is expected to provide some benefits to various sides including:
1. For students: Project-based learning will give new learning experience, the implementation of Project-based learning is expected to improve students’ understanding and creativity.
2. For teacher: Project-based learning can be used as innovative way to deliver concept in learning process, furthermore in curriculum 2013 project-based learning is suggested to be implemented.
18 Ahmad Zimamui Umam, 2014
CHAPTER III
RESEARCH METHODOLOGY
A. Research Method and Design 1. Research Method
The research method was used in this research wascombination of pre experimental and descriptive based on Fraenkel (2007).This research only uses one group research without any classroom control (Arikunto, 2010). Determination of the research method is considered by the sampling technique which is not taken randomly and by analyzing the interrelationship within the variables. Those variables are project-based learning as independent variable and student’s understanding and creativity as dependent variables.
2. Research Design
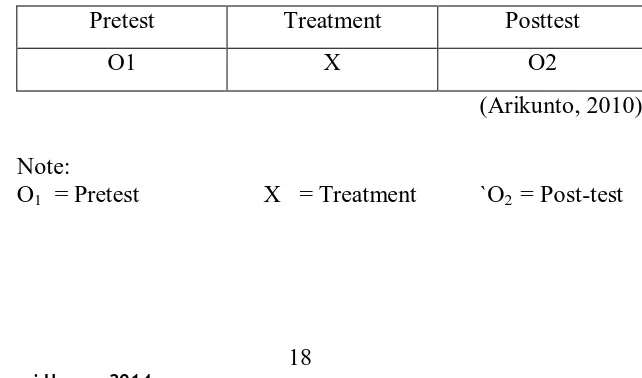
The design which is used in this research is one group pretest and posttest design. The design is convergent parallel design where the quantitative and qualitative data are collected simultaneously (Creswell, 2012). The quantitative data is obtained to explain the students’ understanding. Meanwhile the qualitative data is obtained to explain students’ creativity. In this research design, there is a test to know students’ prior knowledge or pretest (O1), treatment of project-based learning in teaching learning process (X), and after the concept given the treatment of the final posttest will be conducted (O2). Qualitative data collection is also obtained before and after treatment by measuring students’ creativity through creativity rubric.
Table 3.1 The one group pretest and post-test Pretest Treatment Posttest
O1 X O2
(Arikunto, 2010)
Note:
19
B. Research Subject
The research was conducted in Darul Hikam International School Bandung which applied Curriculum 2013 and Cambridge Curriculum in the learning process.
Population of this research was all of students’ cognitive abilities and creativity skill that belongs to all secondary one level students in the school. The sample is all of cognitive abilities and creativity skill on global warming chapter in one class. The sampling technique of this research is purposive sampling, the consideration of the sample is based on the preliminary test where the class has lower result of achievement and creative skill compare to another class.
C. Operational Definition
In order to conduct the research in accordance with the expected aims and avoid misunderstanding, operational definitions need to be elaborated as follows:
1. Project-based learning is an instructional model to empower and attract students’ motivation. In learning activities, students are able to demonstrate their understanding through a variety of presentation modes. This learning model is categorized as hands-on learning with five stages of syntax (assign collaborative working groups, present a real-world problem that pupils can connect, set the parameters for completing the project, teacher consultation input/feedback, final project shared with larger group).
20
Ahmad Zimamui Umam, 2014
3. Creativity is one of thinking process which generates possibility and perspectives in overcoming something. Students’ creativity in this research is measured through their project based learning product that use rubric as an instrument.
D. Research Instrument
The research instrument which is used to collect the data in this research consist of:
1. Objective test in a form of multiple choice questionis is used to measure students’ understanding before and after treated project-based learning in chapter of global warming.
2. Students’ creativity is measured based on creativity rubric on Creative Product Analysis Matrix (CPAM)
3. Questionnaire form is used to analyze the students’ respond towards implementation of project-based learning model in global warming chapter.
E. Instrument Development
The instruments development started by analyzing the curriculum applied at the involved school. The researcher later on formulates the objective test to be used as an instrument of pretest and posttest. The objective test consist of 40 multiple choice question (Appendix A.1)
21
1. Instrument Objective Test Requirements a. Validity
Validity that is used in this research is a content validity. Content validity has a relation with quality of the instrument.The instrument can be concluded as valid or invalid if the measuring instrument is able to measure what should be measured. In this research, the instruments are validating by some experts in related field.
b. Reliability
Reliability test is a measurement which stated about consistence of the measurement tools that is used. Arikunto (2010: 86) stated that reliability tends to a definition about trusted instrument which is used as collecting data tools because of that instrument has already good. The reliability of the test is measured by SPSS 20 program.
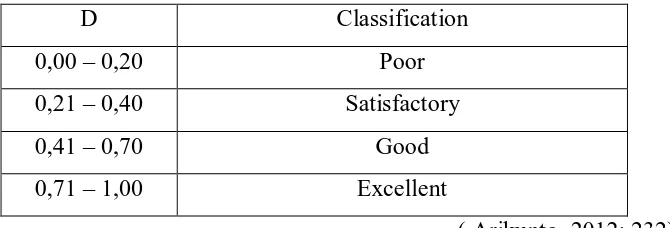
c. Discriminating power
Analysis discriminating power means the ability of question to distinguish between high achiever and low achiever students (Arikunto S., 2012 : 226). The questions which can be answered correctly by both low achiever and high achiever students are not good questions. Otherwise, the questions which can not be answered by both high and low achiever are also not good because it has no discriminating power.
The formula which use to analyze discriminating power based on
D = Discriminating power JA = Amount of high achiever JB = Amount of low achiever
BA= Amount of high achiever who answers question with the right answer
22
Ahmad Zimamui Umam, 2014
PA = Proportion of high achiever who answers question with the right answer
PB = Proportion of low achiever who answers question with the right answer
To determine whether the discrimination index is good or not, it can be checked in the Table 3.2.
Table 3.2The Classification of Discriminating Power D Classification
d. Level of difficulty
Level of difficulty here means level of difficulty of the student's ability to answer questions, but it is not from the perspective of a teacher. Good questions are the question which is not too easy or too difficult to be answered (Arikunto S., 2012: 222). The questions which are too easy will not stimulate the students to try harder to solve it, while too difficult questions will make the students give up and lose heart (Arikunto S., 2012) . The proportion of three categories based on the normal curve. Means that, most of the problems are in the medium category, some are included into the category of easy and difficult with balanced proportions.
The formula which used in this research to determine the level of difficulty of the problems is:
P =
BJS
P = Difficulty level
B = Number of students who answer correctly N= Total number of students
23
The smaller index obtained, the more difficult questions. Otherwise, the greater index gained, the easier of question The difficulty index criteria is showninTable 3.3 below:
Table 3.3Level of Difficulty
Value Criteria
0 – 0,29 Difficult 0,30- 0,69 Middle 0,70 - 1,00 Easy
(Arikunto, 2010: 210)
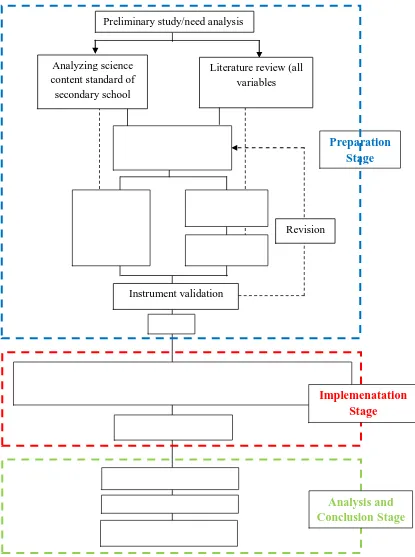
F. Research Plot
24
Ahmad Zimamui Umam, 2014
Figure 3.1 Diagram of Research Plot Preliminary study/need analysis
Literature review (all variables Analyzing science
content standard of secondary school
Research Proposal
(Designing Instrument)
Questionnaire Rubrics
Pretest/Pot-test
Instrument validation
Revision
Valid
Research Implementation:
Project-Based Learning on Global Warming Chapter
Collect research data
Process and analyze data
Result and conclusion
Report the result
Preparation Stage
Implemenatation Stage
25
G. Research Procedure
In order to arrange the sequence of research systematically, the procedure of research is arranged based on the syntax of project-based learning implemented. There are three stages of procedure consists ofpreparation stage, implementation stage,and analysis and conclusion stage. Those three stages will be explained as follows:
1. Preparation stage
In this stage, the researcher conduct several steps that support the research, there are:
a. Formulate problem that will be investigated b. Determine the focus of variable research
c. Conduct literature review of projectbased learning, students’ understanding, students’ creativity, and curriculum
d. Arrange the research proposal which is presented in proposal seminar
e. Revise of research proposal after having suggestions and critics from lecturers.
f. Arrange the research instrument and being judged by expert or lecturer. g. Revised of research instrument after having suggestions.
h. Try out of research instrument
i. Revised of research instrument based on instrument try out analysis result 2. Implementation Stage
This stage explains the step of how research will be implemented, it consists of:
a. Determination of experimental class
b. To get initial condition of students, pretest will be given to the sample class c. Processing pretest result.
d. Conduct research activity by implementingprojectbased learning model in experimental class with following scenarios:
26
Ahmad Zimamui Umam, 2014
a real-world problem that pupils can connect. In the beginningof class, teacher inform that in the end of the chapter students should make a project in a group related with the photo and video shown. Teacher assign collaborative learning group which consist of low and high achiever students. After the students gathered in their own group then the learning continued to the next syntax.
In present a real-world problem that pupils can connectsyntax, teacher asks students related to global warming phenomenon that happens in the world. Students’ answer is written down on the board so that all students can see. In the end of class, teacher determines the theme of each group. Teacher give homework to each group to bring an article related to their theme.
2) In second meeting, the set parameters for completing the project and teacher feedback/consultation stages are implemented. In the beginning of class, teacher explains several criteria related to the project completion. In teacher feedback/consultation stage, each group is asked to report their project progress and share their difficulties in completing the project.
3) In the last meeting, the project shared with the larger group is implemented. Each group is asked to present their final project in front of class. The other groups give feedback in form of question and additional information related to the concept that is being presented. The teacher has a role to guide the students’ discussion, on the other hand teacher also minimizing the misconception that might happen during the discussion. In the end, the teacher concludes the whole learning and clarifies all the concepts.
e. Give post-test in the sample class to recognize the improvement of achievement in the sample class.
f. Give questionnaire to know the student’s response towards implementation
27
3. Analysis and Conclusion Stages
This is the final stage of research design, the step that will be conducted in this stage will be explained as the following steps:
a. Analyze the result of the whole research from based on the instrument result. b. Discuss and conclude for the data analysis result.
c. Arrange the report of the research
H. Data Collection Technique
In this research there are three different data which are collected, those data has different instrument to measure. The data collection techniques are explained as follow:
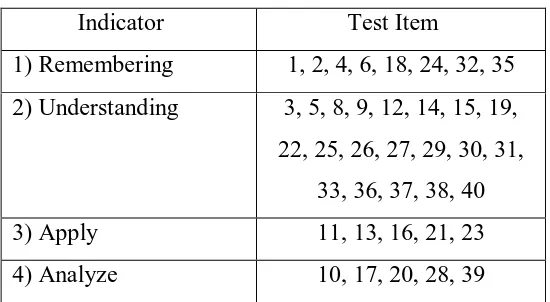
1. Data of Students’ Understanding
The students’ understanding is the quantitative data of this research. This data will be collected through objective test in form of multiple choice questions consist of 40 questions. The result will be collected then analyzed using the normalized gain formula.
Table 3.4Test Item Specification Indicator Test Item
1) Remembering 1, 2, 4, 6, 18, 24, 32, 35 2) Understanding 3, 5, 8, 9, 12, 14, 15, 19, 22, 25, 26, 27, 29, 30, 31,
33, 36, 37, 38, 40 3) Apply 11, 13, 16, 21, 23 4) Analyze 10, 17, 20, 28, 39
28
Ahmad Zimamui Umam, 2014
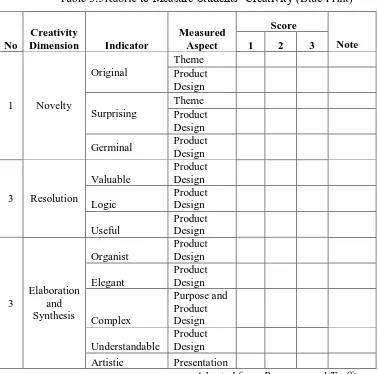
2. Data of Students’ Creativity
The students’ creativity is the qualitative data of this research. It is obtained through measurement of students’ product using Creative Product Analysis Matrix (CPAM) rubric. The rubric will have some indicators that
show the percentage of students’ creativity. The CPAM blue print is shown in
Table 3.5 as follows:
Table 3.5Rubric to Measure Students’ Creativity (Blue Print)
No
Adapted from Basemer and Treffinger
29
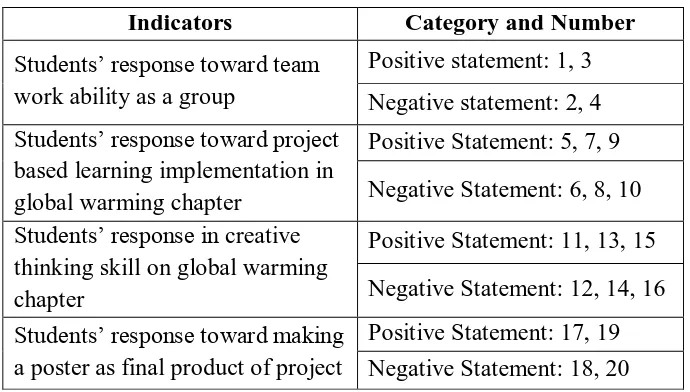
3. Data of Students’ Response
Students’ respond data collection is used to determine students’ response toward project based learning implementation in global warming chapter.The data obtained from the questionnaire is a supportive data, and it is processed by a percentage calculation. The blue print of students’ response questionnaire is shown in Table 3.6 as follows:
Table 3.6Table of Students’ Response Questionnaire
Indicators Category and Number
Students’ response toward team work ability as a group
Positive statement: 1, 3 Negative statement: 2, 4 Students’ response toward project
based learning implementation in global warming chapter
Positive Statement: 5, 7, 9 Negative Statement: 6, 8, 10 Students’ response in creative
thinking skill on global warming chapter
Positive Statement: 11, 13, 15 Negative Statement: 12, 14, 16 Students’ response toward making
a poster as final product of project
Positive Statement: 17, 19 Negative Statement: 18, 20
I. Instrument Analysis Result
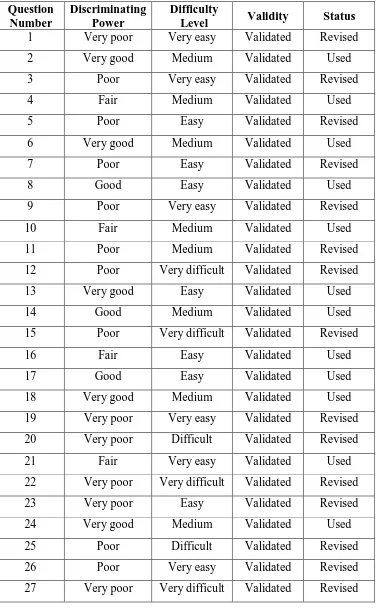
1. Recapitulation of Students’ Understanding Instrument
The instrument for measuring students’ understanding is an objective test
in a form of 40multiple choice. The instrument should be tested in terms of validity, reliability, discriminating power, and difficulty level as explained before. The test was given to 20 students which have learned about the chapter that is learned for the research. The summary of test item analysis is shown in Table 3.7 as follows:
Test item recapitulation:
30
Ahmad Zimamui Umam, 2014
Table 3.7 Recapitulation of Test Item for Students’ Understanding
Question Number
Discriminating Power
Difficulty
Level Validity Status
31
28 Very poor Very difficult Validated Revised
Question Number
Discriminating Power
Difficulty
Level Validity Status
29 Very poor Very difficult Validated Revised 30 Very good Easy Validated Used
a. Rubric of Creative Product Analysis Matrix
Rubric of Creative Product Analysis Matrix is used to measure students’ creativity of project based learning product. The poster is assessed into some criteria which is available in the rubrics. The observermeasure students’ creativity based on their product. The observer gave the checklist on the rubric if the obsever found the sub indicator appearinstudents’ creative product.
b. Questionnaire
32
Ahmad Zimamui Umam, 2014 J. Processing Data
Data obtained from both quantitative data and qualitative. Quantitative data obtained from the pretest and data of students' understanding (post-test), while the qualitative data obtained from the students’ creativity rubric and questionnaire. Explanation of data processing techniques are obtained as follows:
1. Quantitative Data Analysis
Quantitative data analysis is done by Microsoft excel calculation, in order to determine the score of pretest and posttest. The process of calculating data is explained as follow:
a) Scoring of Test Item
The first step to process data is scoring the test item. The test item is provided in the 40 number of questions. All of the score is processed using Microsoft excel.
b) Calculation of Gain Score and Normalized Gain
After get the data of the test item score, the data is processed through gain score and normalize score. According to Hake, gain score is obtained from the differences between pretest and posttest. It is assumed as the effect of the treatment itself. And normalized gain test itself is to determine the categories of student’s achievement improvement.
According to Hake (1998) here is the formula to get the gain score:
G = S
f -S
iDescription:
G = Gain score Sf = Post test score Si = Pre test score
33
The effectiveness of project-based learning model in increasing students’ understanding of global warming conceptis seen from the result of the normalized gain that achieved by students during the learning process. For the calculation of the normalized gain value and its classification uses equations (Hake, 1998) as follows:
Normalized gain of each student <g> will be determined by this formula:
Where,
<g> = Normalized gain G = Actual gain
Gmax = Maximum gain possible Sf = Post test score
Si = Pre test score
Average of normalized gain (<g>) which is formulated as:
Description:
<g> = Normalized gain <G> = Actual gain
<G>max= Maximum gain possible <Sf> = Average of post-test score <Si> = Average of pretest score
34
Ahmad Zimamui Umam, 2014
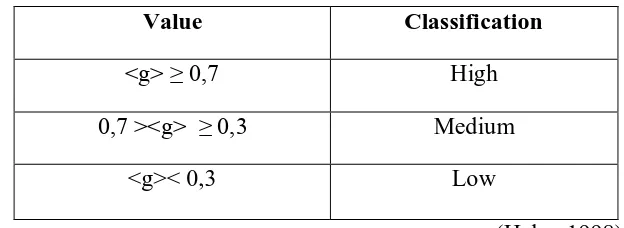
The value of Normalized gain which already got can be interpreted using Table 3.8 as follow:
Table 3.8 Interpretation Table
Value Classification
<g> ≥ 0,7 High
0,7 ><g> ≥ 0,3 Medium
<g>< 0,3 Low
(Hake, 1998)
c) Normality and Homogeneity test
Using of parametric statistic has a deal with assumption that each variable in this research that will be analyzed form a normal distribution. If, the data is abnormal, the homogenity varians test can not be done or the parametric technique can not be used.Meanwhile if the data is normal and homogen, the parametric technique can be used. Normality test is to know whether the sample comes from population that has normal distribution or not. In this research, Normality test uses statistic test from SPSS 20,
Kolmogorov-Smirnov with significancy level (α) is 0,05. When significance value > 0,05,
H0 will be accepted and H0 will be rejected or denied if significance value < 0,05 (Sarwono, 2013 ). The hypotheses are:
H0 : Sample comes from population that has normal distribution. H1: Sample comes from population that has not normal distribution.
35
d) One Sample T-test
One sample T-test was done to determine whether the class had achieved the standard score after the implementation of project based learning represented by the Posttest Score. T-test requires data which is normal and homogen. In SPSS 20, the test is used One Sample T-Test. If the level of significancy (sig) ≤ 0.05 H0 is rejected. If the level of significancy (sig)> 0.05 H0 is retained. In testing the similarity means is used two-tailes hypotheses, the hypotheses is determined as bellow:
H0 : Students’ mastery concept score in learning global warming concept has
achieved the school standard of 75 .
H1 : Students’ mastery concept score in learning global warming concept less
than school standard (<75)
2. Qualitative Data Analysis
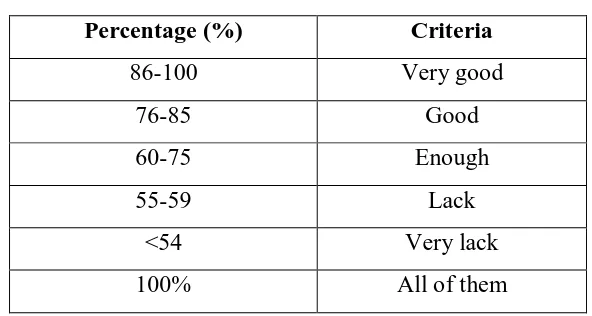
The qualitative data is obtained from both creativity rubrics offinal product and questionnaire. The rubricsassess the poster as the final product. The analysis of rubrics is conducted by converting the raw score into percentage form. Further, the result of percentage can be classified into several categories.
The technique of converting score into precentage is used formula as follows:
NP =
� x 100%
Note:
NP = percentage R = raw score SM = maximum score
36
Ahmad Zimamui Umam, 2014
Tabel 3.9 Percentage Interpretation
Percentage (%) Criteria
86-100 Very good
76-85 Good
60-75 Enough
55-59 Lack
<54 Very lack 100% All of them
The other data that is analyzed qualitatively is from questionnaire result. The qualitative analysis describes the real situation of the research result and also the result of students’ respond in learning global warmingby using project-based learning model.
Processing is done by calculating Likert scale, it is calculated into score and then converted into percentage, the percentage of answers observer to then be evaluated for the next lesson. The scoring guideline is shown in the Table 3.10 as follows:
Table 3.10 Scoring Guideline of Students’ Response Strongly
Agree
Slightly Agree
Slightly Disagree
Strongly Disagree Positive
Statement 4 3 2 1
Negative
37
59 Ahmad Zimamui Umam, 2014
CHAPTER V
CONCLUSIONS AND RECOMMENDATIONS A. Conclusions
Research of Project-Based Learning implementation has been conducted systematically, based on the research result it is obtained some conclusions as follows:
1. The implementation of project-based learning model on Global Warming chapter can improve students’ understanding, it can be noticed by processing the differences between pretest and post-test score which is gained by students that shows an improvement and obtain normalized gain as much as 0.61which include as medium category.
2. Project based learning model is capable to improve students’ creativity when is implemented on Global Warming chapter, it stated so because of the result
from students’ creativity before and after project based being
implementedshows an improvement from enough to good category. The improvement is indicated by the percentages of each creativity dimension after project based implementation as much as 76%, 84.3% and 77.3% which categorized as good.
3. The respond of students towards project based learning implementation
60
B. Recommendations
Based on the findings of the research that has been conducted and concluded, there are several recommendations that necessary to be conveyed by the researchers, some of them are:
1. Project-based learning model can be implemented as an alternative teaching strategy for science teacher in providing activities to students to develop their creativity.
2. At assign collaborative working group, the teacher should determine the group members that consist of low and high achievement student. The teacher also should make sure that each group is working collaboratively. 3. Teacher should determine the time allocation for project to be finished. It
is very important to track the students so that the students can finish the project optimally.
4. At teacher consultation input/feedback stage, the teacher should make sure that each group has chance to have consultation, it is expected by having consultation the students can share their difficulty in completing the project.
5. At final project shared with larger group stage, teacher should make sure that the concept delivered by students are correct, therefore misunderstanding will not be happen.
61
Ahmad Zimamui Umam, 2014
REFERENCES
Aboukinane, C. (2007). A Qualitative Study of Creative Thinking Using Experiential Learning in an Agricultural and Life Science Course. Texas A&M University
Adair, A. and Bao, L.. (2012). Project-Based Learning: Theory, Impact, and Effective Implementation. IPERC.ORG, 6-21.
Adams, K. (2005). The Sources of Innovation and Creativity. National Center on Education and the Economy for the New Commission on the Skills of the American Workforce
Amabile, T.M. (1982) Social Psychology of Creativity: A Consensual Assessment Technique. Journal of Personality and Social Psychology. Vol 43, pp. 997-1013
Anderson, L.W and Karthwohl, D. R. (2001). A Taxonomy for Learning, Teaching and
Assessing: A Revision of Bloom’s Taxonomy of Educational Objectives. Addison Wesley
Longmam.Inc
Arikunto, S. (2010). Prosedur Penelitian. Jakarta: PT Rineka Cipta.
Arikunto, S. (2012). Dasar-dasar Evaluasi Pendidikan (Edisi 2). Bumi Aksara: Jakarta.
Besemer, S. and Treffinger, D.J. (1981). Analysis of Creative Product: Review and Synthesis. Journal of Creative Behavior, Vol15, pp.158-178
Blumenfeld, P., Soloway, E., Marx, R., Krajcik, J., Guzdial, M., &Palincsar, A. (1991) Motivating project-based learning: Sustaining the doing, supporting the learning. Journal of Educational Psychologist.
Creswell, J. W. (2012). Educational Research; Planning, Conducting, and Evaluating Quantitative and Qualitative Research.Boston: Edward Brothers, Inc, 541.
Dahar, R. W. (2011). Teori-Teori Belajar & Pembelajaran. Jakarta: Penerbit Erlangga.
Fortuna, M. B. (2013). Kemampuan Berpikir Kreatif Siswa SMP pada Materi Dampak Kepadatan Penduduk Terhadap Lingkungan melalui Pembelajaran Berbasis Proyek. Final Paper S1 Pendidikan Biologi UPI: Unreleased.
62
Hake, R. R. (1998). Interactive Engagement versus Traditional Methods : A six Thousand Students Survey of Mechanics Test Data for Introductory Physics Courses. Departement of Physics Indiana University. Bloomington: Indiana.
King, S. H.,et.al,. (2009). Project-Based Learning: Inspiring Middle School Students to Engage in Deep and Active Learning. NYC Department of Education. 7-10
Kementrian Pendidikan dan Kebudayaan. (2013). Kurikulum 2013 Kompetensi Dasar Sekolah Menengah Pertama (SMP)/Madrasah Tsanawiyah (MTs). Kementrian Pendidikan dan Kebudayaan
Krathwohl, D.R., Bloom,B.S. and Masia, B. B. (1964).Taxonomy of educational objectives, Book II. Affective domain. New York, NY. David McKay Company, Inc.
Lih-Juan ChanLin. (2008). Technology integration applied to project-based learning in science. Department of Library & Information Science, Fu-Jen Catholic University, Hsin-Chuang, Taiwan
Masitoh, I. (2011). Kemampuan Memecahkan Masalah dan Penguasaan Konsep Siswa Melalui Project Based Learning pada Materi Daur Ulang Limbah . Final Paper S1 Pendidikan Biologi UPI: Unreleased.
Munandar, U. (1992). Mengembangkan Bakat dan Kreativitas Anak Sekolah (Petunjuk bagi Para Guru dan Orang Tua). Jakarta: PT. Gramedia Widiasarana Indonesia
O’Neill, Geraldine and David Jennings. (2012). The Use of Posters for Assessment: A Guide for
Staff. Dublin: UCD Teaching and Learning
Purwanto, M.N. (2006). Prinsip-prinsip dan Teknik Evaluasi Pengajaran. Bandung: PT. Remaja Rosdakarya
Sarwono, J. (2012) Metode Riset Skripsi Pendekatan Kuantitatif Menggunakan Prosedur SPSS. Jakarta: PT. Elex Media Komputindo.
Sigelman, C. K and Rider E. A. (2006). Life-Span Human Development. Belmont, CA: Thomson Higher Education
Slavin, R. (2008). Cooperative Learning Theori, Riset, dan Praktik. Bandung: Nusa Media. Wahono et. al. (2013). Ilmu Pengetahuan Alam. Jakarta: Kementrian Pendidikan dan
63
Ahmad Zimamui Umam, 2014