Lampiran 1
LEMBAR OBSERVASI PENGUMPULAN DATA
PENGARUH FAKTOR RISIKO TERHADAP KEBERADAAN
VEKTOR PENYAKIT DI KAPAL PADA PELABUHAN TEMBILAHAN
Nama Kapal
:
Besar Kapal
:
Bendera
:
Tanggal SSCEC :
Jenis Kapal
:
A. DECK
No Komponen yang dinilai
Penilaian Keberadaan Vektor Tdk baik (0) Baik (1) .Ada (1) T.Ada (2) 1 Kebersihan (Tidak ada sampah, oli )
2 Lantai kedap air, tidak ada genangan air 3 Lantai tidak berkarat
4 Lantai rata, sambungan tidak menonjol 5 Barang-barang APD, tali tersusun rapi
Total Nilai
B. KAMAR AWAK KAPAL
No Komponen yang dinilai
Penilaian Keberadaan Vektor Tdk baik (0) Baik (1) .Ada (1) T.Ada (2) 1 Kebersihan (tidak ada sampah,
barang-barang tersusun rapi)
2 Ventilasi cukup (sirkulasi udara lancar, mempunyai lubang bukaan 1,25 cm)
3 Penerangan >5-10 fc
4 Hunian kamar <4 orang/kamar Total Nilai
C. KAMAR MANDI/TOILET
No Komponen yang dinilai
Penilaian Keberadaan Vektor Tdk baik (0) Baik (1) .Ada (1) T.Ada (2) 1 Kebersihan (Lantai tidak licin, dinding
tidak kotor) 2 Tidak berbau
3 Bukan tempat penyimpanan barang 4 Kran berfungsi baik
5 Tersedia wastafel 6 Tersedia air panas 7 Tersedia tissue, sabun
Total Nilai
D. DAPUR
No Komponen yang dinilai
Penilaian Keberadaan Vektor Tdk baik (0) Baik (1) .Ada (1) T.Ada (2) 1 Kebersihan (Tidak ada sampah berserakan,
permukaan dinding lembut dan terang) 2 Ada tempat sampah yg memenuhi syarat kes 3 Ada pemisahan sampah organik dan an organik 4 Alat-alat bersih
5 Makanan masak tertutup 6 Ventilasi cukup
7 Pencahayaan 20 fc
8 Mencuci dengan air panas 77 derajat Celcius Total Nilai
E. GUDANG PERSEDIAAN MAKANAN
No Komponen yang dinilai
Penilaian Keberadaan Vektor Tdk baik (0) Baik (1) .Ada (1) T.Ada (2) 1 Kebersihan (Tidak ada sampah
berserakan, barang-barang tersusun rapi) 2 Menyimpan pada rak 15 cm dari deck 3 Tidak berbau
4 Pencahayaan 20 fc
5 Thermometer berfungsi dengan baik 6 Temperatur bahan makanan mudah
membusuk disimpan 0-7 derajat celcius 7 Bahan makanan tidak mudah
membusuk disimpan 10-15 derajat Celcius
Lampiran 2
Dokumentasi Hasil Penelitian
Gambar 1: Dapur Kapal
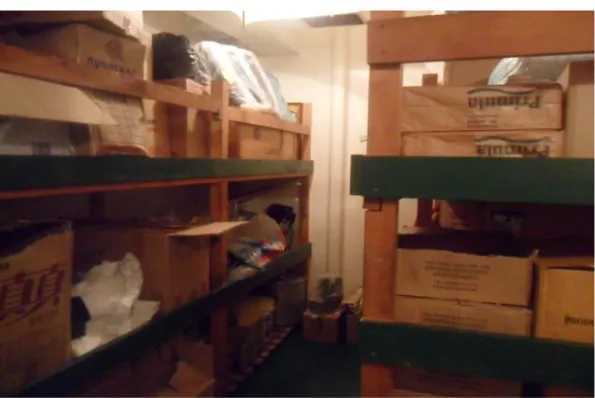
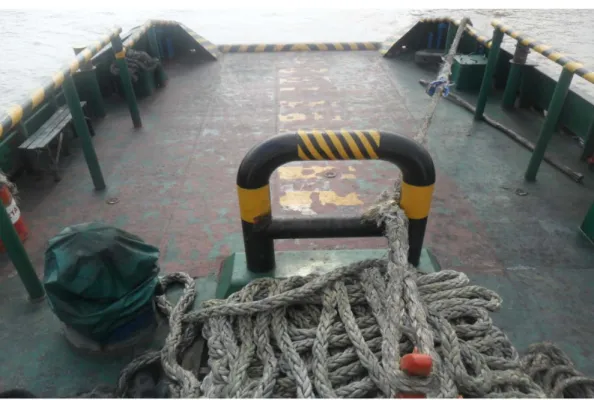
Gambar 3: Deck Kapal
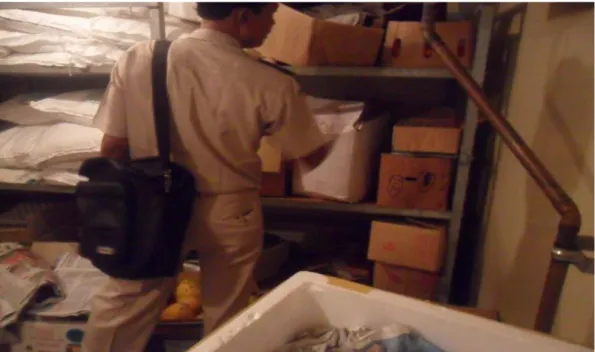
Gambar 5: Gudang Persediaan Makanan di Kapal
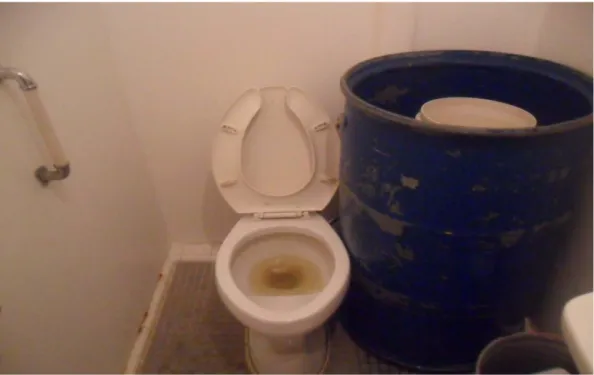
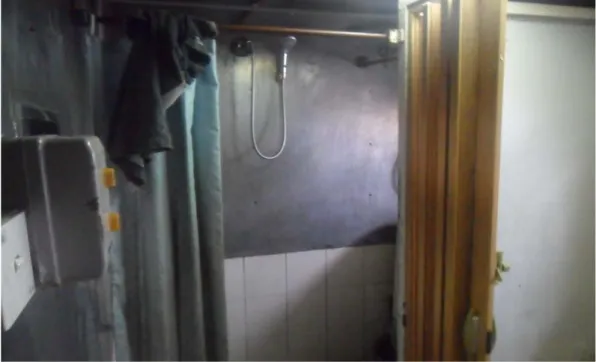
Gambar 7: Toilet di Kapal
Gambar 9: Dapur di Kapal
Gambar 11: Toilet di Kapal
Gambar 13: Kamar Awak kapal
Lampiran 3
Daftar kedatangan kapal yang diobservasi
pada Kantor Kesehatan Pelabuhan Kelas III Tembilahan
Bulan September dan Oktober Tahun 2011
No
Tanggal
Nama kapal
Isi kotor
(M3)
Bendera
Datang dari
1
01 Sept
Tb.Sri jaya Utama
203,76
Indonesia
Singapore
2
05 Sept
Tb.Surya Wira
646,07
Indonesia
Vietnam
3
05 Sept
Klm.Rajawali Sakti
280,17
Indonesia
Slt.Panjang
4
06 Sept
Mv.Didne
115.073,46
Malaysia
Malaysia
5
07 Sept
Tb.Terus Daya
732,97
Indonesia
Malaysia
6
08 Sept
Tb.Marcopolo 107
464,12
Indonesia
Jambi
7
08 Sept
Tb.Marcopolo 29
339,20
Indonesia
K.Tungkal
8
08 Sept
Mt.Pelumin Satu
4.004,45
Indonesia
Tj.buton
9
09 sept
Tb.Armada Asia
291,49
Indonesia
Tj.Balai
10
10 Sept
Tb.TS 293
648.07
Indonesia
Tj.Buton
11
10 Sept
Tb.Maju Daya 21
523,55
Indonesia
Palembang
12
11 Sept
Tb.Tri Daya Aruna
263,19
Indonesia
Tj.Balai K
13
12 Sept
Tb.TS 24.5.1
447,14
Indonesia
Tj.Buton
14
12 Sept
Tb.Asento 296
616,94
Indonesia
Tj.Buton
15
13 Sept
Tb.Surya Cakra 6
721,65
Indonesia
Malaysia
16
13 Sept
Tb.Marcopolo 99
356,58
Indonesia
Batam
17
14 Sept
Tb.Citra Karya
169,80
Indonesia
Tj.Buton
18
15 Sept
Klm.Johnson
251,87
Indonesia
Sumsang
19
15 Sept
Tb.Garuda III
481,10
Indonesia
Tj.Buton
20
16 Sept
Tb.Marcopolo 57
435,83
Indonesia
Jambi
21
17 Sept
Tb.Ocean Arindo
314,13
Indonesia
Tj.Buton
22
17 Sept
MV.Power Stell
110.033,23
Malaysia
Malaysia
23
18 Sept
Tb.Citra Sanjaya
206,59
Indonesia
Tj.Buton
24
19 Sept
Tb.BPW 3
283,00
Indonesia
Tj.Buton
25
20 Sept
Tb.BPW 5
305,84
Indonesia
Tj.Buton
26
21 Sept
Tb.Arwana
249,04
Indonesia
Tj.Buton
27
22 Sept
Tb.Mitra Kencana
421,67
Indonesia
Dumai
28
23 Sept
Tb.Venus I
229,23
Indonesia
Tj.Buton
29
23 Sept
Tb.Maju Agung
192,44
Indonesia
Tj.Buton
30
24 Sept
Klm.Cahaya Indo
311,30
Indonesia
Sumsang
31
25 Sept
Tb.Jangkat
240,55
Indonesia
Tj.Balai K
32
25 Sept
Tb.Marcopolo 296
3.421,79
Indonesia
Jambi
33
26 Sept
Tb.United I
430,16
Indonesia
Tj.Buton
34
27 Sept
Tb.Amethyss I
247,93
Indonesia
Tj.Buton
35
27 Sept
Tb.Honduras
291,43
Indonesia
Tj.Buton
36
27 Sept
MV.AB Jad
85.049,99
India
India
37
28 Sept
Tb.Marcopolo 107
464,12
Indonesia
K.Tungkal
38
28 Sept
Tb.GMS Fortuna
149,99
Indonesia
Siak
39
29 Sept
Klm.Sinar Maju
367,90
Indonesia
Palembang
40
29 Sept
Klm.Indra Jaya
362,64
Indonesia
Sumsang
41
30 Sept
Klm.Mekar Puspita
1.743,28
Indonesia
Pekanbaru
42
01 Okt
Klm.Victory
223,83
Indonesia
Sumsang
43
03 Okt
Tb.Garnet-I
308,47
Indonesia
Tj.Buton
44
04 Okt
Klm.Fajar
642,41
Indonesia
S.Kelapa
45
05 Okt
Klm.Bina Abadi
837,68
Indonesia
S.Kelapa
46
06 Okt
Tb.Cipta Agung-I
266,02
Indonesia
Kijang
47
07 Okt
Tb.Terus daya-25
732,83
Indonesia
Singapura
49
09 Okt
Km.Duta Samudra
990,5
Indonesia
Slt.Panjang
50
10 Okt
Km.Lucky Star
478,83
Indonesia
Palembang
51
11 Okt
Tb.Hufco Flower
232,72
Indonesia
Tj.Buton
52
13 Okt
Km.Dwi Fortuna
1.013,14
Indonesia
Batam
53
14 Okt
Km.Sejahtera-X
840,15
Indonesia
S.Kelapa
54
15 Okt
Tb.Capricon-18
251,87
Indonesia
Tj.Buton
Lampiran 4
HASIL OBSERVASI PENGARUH FAKTOR RISIKO TERHADAP KEBERADAAN VEKTOR DI KAPAL
K pl
FAKTOR RISIKO DI KAPAL DECK Total n ilai k ateg o ri Vek to r KMR AWAK KAPAL T o tal n ilai Kateg o ri Vek to r KAMAR MANDI/TOILET T o tal n ilai Kateg o ri Vek to r DAPUR Total n ilai Kateg o ri Vek to r GUD PERS MAKANAN T o tal n ilai k ateg o ri Vek to r No komponen Penilaian No Komponen Penilaian No Komponen Penilaian No Komponen Penilaian No Komponen Penilaian 1 2 3 4 5 1 2 3 4 1 2 3 4 5 6 7 1 2 3 4 5 6 7 8 1 2 3 4 5 6 7
Nilai Nilai Nilai Nilai Nilai
1 0 0 0 1 0 1 A R Ad 0 0 1 0 1 A R Ad 1 1 1 0 0 0 1 4 TR Ta 0 0 0 1 1 1 0 0 3 A R Ad 0 1 1 1 0 1 1 5 TR Ta 2 0 0 0 0 0 0 A R Ta 1 1 1 0 3 TR Ta 1 1 1 0 1 0 0 4 TR Ta 1 0 0 1 1 1 1 0 5 TR Ad 0 1 1 1 1 0 0 4 TR Ad 3 0 0 0 1 0 1 A R Ta 1 1 1 0 3 TR Ta 0 1 1 0 0 0 0 2 A R Ta 0 0 0 1 1 1 0 0 3 A R Ad 0 0 1 0 0 0 0 6 AR Ad 4 0 0 0 1 0 1 A R Ta 1 1 1 1 4 TR Ta 0 1 1 0 0 0 1 3 A R Ta 1 0 1 1 1 1 1 1 7 TR Ta 1 0 1 1 1 1 1 6 TR Ta 5 1 1 1 1 0 4 TR Ta 1 1 1 0 3 TR Ta 0 1 1 1 0 0 1 4 TR Ad 1 0 0 1 1 1 0 1 5 TR Ad 1 0 1 1 0 1 1 5 TR Ta 6 0 0 0 1 1 2 A R Ta 0 0 1 0 1 A R Ad 0 1 1 0 0 0 0 2 A R Ad 1 0 0 1 1 1 1 0 5 TR Ad 0 1 0 1 0 0 0 2 Ar Ad 7 0 0 0 1 0 1 A R Ta 0 0 1 0 1 A R Ad 0 0 0 0 0 0 1 1 A R Ad 0 0 0 1 1 1 1 1 5 TR Ta 1 1 1 1 0 1 0 5 TR Ad 8 1 1 0 1 0 3 TR Ta 0 1 1 1 3 TR Ad 0 0 0 0 0 0 1 1 A R Ad 0 0 1 1 1 1 1 0 5 TR Ta 1 1 1 1 1 1 0 6 TR Ta 9 0 0 0 1 0 1 A R Ta 0 0 1 0 1 A R Ad 0 1 1 1 1 0 1 5 TR Ad 0 0 0 1 1 1 0 0 3 A R Ad 0 0 0 1 0 0 0 1 AR Ad
10 1 1 1 0 1 4 TR Ad 1 1 1 0 3 TR Ta 0 0 1 0 0 0 0 1 A R Ad 1 0 1 1 1 1 1 0 6 TR Ad 1 1 1 1 1 1 0 6 TR Ta 11 1 1 1 0 1 4 TR Ta 0 0 1 0 1 A R Ad 0 0 1 0 0 0 1 2 A R Ad 1 0 0 1 1 1 1 1 5 TR Ad 1 1 1 1 1 0 0 5 TR Ta 12 1 1 0 1 1 4 TR Ta 0 0 1 0 1 A R Ad 0 1 1 1 0 0 1 4 TR Ta 0 0 0 1 1 0 0 0 2 A R Ad 0 1 0 1 0 0 0 2 AR Ad 13 0 1 1 1 1 4 TR Ad 0 0 1 0 1 A R Ta 0 0 1 0 0 0 1 2 A R Ad 0 1 0 1 1 1 1 0 5 TR Ad 1 1 0 1 0 1 1 5 TR Ad 14 0 1 1 1 1 4 TR Ad 1 1 1 0 3 TR Ad 0 0 1 0 0 0 1 2 A R Ta 0 0 0 1 1 1 0 0 3 A R Ta 0 1 0 0 1 1 1 4 TR Ad 15 0 1 1 1 1 4 TR Ta 1 1 1 0 3 TR Ta 0 0 1 0 0 0 1 2 A R Ad 0 0 1 1 1 1 1 1 6 TR Ad 1 1 1 1 1 1 0 6 TR Ta K pl
FAKTOR RISIKO DI KAPAL DECK T o tal n ilai Kateg o ri Vek to r KMR AWAK KAPAL T o tal n ilai Kateg o ri Vek to r KAMAR MANDI/TOILET T o tal n ilai Kateg o ri Vek to r DAPUR T o tal n ilai Kateg o ri Vek to r GUD PERS MAKANAN T o tal n ilai Kateg o ri Vek to r No Komponen Penilaian No Komponen Penilaian No Komponen Penilaian No Komponen Penilaian No Komponen Penilaian 1 2 3 4 5 1 2 3 4 1 2 3 4 5 6 7 1 2 3 4 5 6 7 8 1 2 3 4 5 6 7
Nilai Nilai Nilai Nilai Nilai
16 0 1 1 1 1 4 TR Ta 0 0 1 0 1 A R Ad 0 0 1 0 0 0 1 2 A R Ad 0 0 0 1 1 0 0 1 3 AR Ad 0 1 1 1 0 0 0 3 AR Ta 17 1 1 1 1 1 5 TR Ta 0 0 0 0 0 A R Ad 0 0 0 0 0 0 1 1 A R Ad 0 0 0 1 1 0 0 0 2 AR Ad 0 1 0 0 0 0 0 1 AR Ad 18 1 0 1 1 1 4 TR Ta 0 1 1 1 3 TR Ad 0 1 1 1 1 0 1 5 TR Ad 0 0 0 1 0 1 0 1 3 AR Ad 0 0 1 1 0 0 0 2 AR Ad 19 1 1 0 1 0 3 TR Ta 1 1 0 1 3 TR Ta 0 1 1 1 1 1 1 6 TR Ta 1 1 0 1 1 1 1 0 6 TR Ta 0 1 0 1 0 0 0 2 AR Ad 20 1 0 1 1 1 4 TR Ad 0 0 1 1 1 A R Ad 0 0 1 0 0 0 1 2 A R Ad 0 0 0 1 0 1 1 0 3 AR Ad 1 1 1 1 0 1 0 5 TR Ad 21 1 1 0 1 1 4 TR Ta 0 0 1 0 1 A R Ta 0 0 1 0 0 0 0 1 A R Ta 0 0 0 1 1 1 0 0 3 AR Ta 1 1 0 0 0 0 0 2 AR Ad 22 0 1 1 1 1 4 TR Ta 1 1 1 1 4 TR Ta 0 0 1 0 0 0 1 2 A R Ta 1 0 1 1 1 1 1 1 7 TR Ta 0 0 0 0 0 0 0 0 AR Ta 23 0 1 1 1 0 3 TR Ta 0 0 1 0 1 A R Ta 1 1 1 1 1 0 1 6 TR Ta 0 0 0 1 1 1 0 0 3 AR Ta 1 1 0 1 0 0 0 3 AR Ad 24 0 1 1 1 1 4 TR Ad 1 0 0 0 1 A R Ta 0 0 1 0 0 0 1 2 A R Ta 0 0 0 1 0 1 1 0 3 AR Ad 0 0 0 0 1 1 1 3 AR Ad 25 1 1 0 0 1 3 TR Ad 0 0 1 0 1 A R Ad 0 0 0 0 0 0 1 1 A R Ad 0 0 0 1 1 0 1 0 3 AR Ta 0 1 0 0 1 1 0 2 AR Ad 26 1 0 1 0 1 3 TR Ad 0 0 1 0 1 A R Ad 0 0 1 0 0 0 1 2 A R Ad 0 0 0 1 1 1 0 0 3 AR Ad 0 1 0 0 0 1 0 2 AR Ad 27 0 1 1 1 0 3 TR Ta 0 0 1 0 1 A Ad 0 0 1 0 1 0 1 3 A Ad 1 0 1 1 1 1 0 1 6 TR Ta 0 0 0 1 1 0 1 3 AR Ad
R R 28 1 0 1 0 1 3 TR Ad 0 0 1 0 1 A R Ad 1 1 1 0 1 0 1 5 TR Ad 0 0 0 1 1 1 0 0 3 AR Ad 0 1 1 0 0 0 0 2 AR Ad 29 1 1 0 1 0 3 TR Ta 0 1 0 0 1 A R Ad 0 0 1 0 0 0 1 2 A R Ad 0 0 0 1 0 0 1 1 3 AR Ad 0 0 0 1 0 0 0 1 AR Ad 30 0 1 1 1 0 3 TR Ad 0 1 1 1 3 TR Ad 0 0 1 0 1 0 1 3 A R Ad 0 0 0 0 1 1 0 0 2 AR Ad 1 1 0 0 0 0 0 2 AR Ad
Kp l
FAKTOR RISIKO DI KAPAL DECK Total n ilai Kateg o ri Vek to r KMR AWAK KAPAL T o tal n ilai Kateg o ri Vek to r KAMAR MANDI/TOILET T o tal n ilai Kateg o ri Vek to r DAPUR Total n ilai Kateg o ri Vek to r GUD PERS MAKANAN T o tal n ilai Kateg o ri Vek to r No Komponen Penilaian No Komponen Penilaian No Komponen Penilaian No Komponen Penilaian No Komponen Penilaian 1 2 3 4 5 1 2 3 4 1 2 3 4 5 6 7 1 2 3 4 5 6 7 8 1 2 3 4 5 6 7
Nilai Nilai Nilai Nilai Nilai
31 0 0 1 1 1 3 TR Ta 1 0 1 1 3 TR Ad 0 0 1 0 0 0 1 2 A R Ad 1 0 0 1 1 1 1 0 5 TR Ad 0 0 0 0 1 0 1 2 AR Ta 32 1 0 1 1 1 4 TR Ta 1 0 0 0 1 A R Ta 0 0 1 0 0 0 1 2 A R Ad 0 1 0 1 1 1 1 0 5 TR Ta 0 0 0 0 0 0 1 6 AR Ta 33 0 1 1 1 0 3 TR Ta 0 0 1 0 1 A R Ad 1 1 1 1 1 1 1 7 TR Ad 1 1 0 1 1 1 0 0 5 TR Ta 1 1 0 1 0 0 0 3 AR Ta 34 1 1 0 1 0 3 TR Ta 1 1 1 0 3 TR Ad 0 0 0 0 0 0 1 6 A R Ad 0 0 0 1 1 1 0 0 3 TR Ad 0 0 0 0 0 0 0 0 AR Ad 35 0 0 1 1 1 3 TR Ta 0 0 1 0 1 A R Ad 0 1 1 0 0 0 1 3 A R Ad 0 0 1 1 1 1 1 0 5 TR Ad 0 1 0 1 0 0 0 2 AR Ad 36 1 1 1 1 0 4 TR Ad 0 0 0 1 1 A R Ta 0 0 1 0 0 0 1 2 A R Ad 1 0 1 1 1 1 1 1 7 TR Ta 0 0 0 0 0 0 0 0 AR Ta 37 1 0 1 1 1 4 TR Ta 0 0 1 0 1 A R Ta 0 0 1 0 0 0 0 1 A R Ad 0 0 0 1 1 1 0 0 3 A R Ad 0 1 1 1 0 0 0 3 AR Ta 38 0 1 1 1 1 4 TR Ad 1 0 0 0 1 A R Ta 0 1 1 0 0 0 0 2 A R Ad 0 0 0 1 1 1 0 0 3 A R Ad 1 1 0 0 0 0 0 2 AR Ta 39 0 0 1 1 1 3 TR Ta 0 0 0 1 1 A R Ad 0 0 1 0 0 0 0 1 A R Ad 0 0 0 1 1 1 0 0 3 A R Ad 0 1 0 1 0 0 0 2 AR Ad
40 1 1 1 1 0 4 TR Ta 1 0 0 0 1 A R Ad 1 1 1 1 1 1 1 7 TR Ad 0 0 0 1 1 1 0 0 3 A R Ad 1 1 0 0 0 0 0 2 AR Ad 41 1 0 1 1 0 3 TR Ad 1 0 0 0 1 A R Ta 0 1 1 1 0 0 1 4 TR Ad 0 0 0 1 1 1 0 0 3 A R Ad 1 1 0 0 0 0 0 2 AR Ad 42 0 1 0 1 1 3 TR Ta 0 1 0 0 1 A R Ad 1 0 1 0 0 0 0 2 A R Ad 0 0 0 1 1 1 0 0 3 A R Ad 0 1 1 0 0 0 0 2 AR Ad 43 1 0 1 1 1 4 TR Ta 1 0 0 0 1 A R Ad 0 0 1 0 0 0 0 1 A R Ad 1 0 1 1 1 1 1 0 5 TR Ta 1 0 1 0 0 0 1 3 AR Ad 44 1 1 0 1 0 3 TR Ta 0 1 0 0 1 A R Ad 0 1 1 1 0 0 0 3 A R Ad 0 0 0 1 0 1 1 0 3 A R Ad 0 1 0 1 0 0 0 2 AR Ad 45 1 0 0 1 1 3 TR Ta 0 1 0 1 3 TR Ta 0 1 1 0 1 1 0 4 TR Ad 0 1 1 0 0 0 0 1 3 A R Ta 0 1 1 0 0 0 0 2 AR Ad
Kp l
FAKTOR RISIKO DI KAPAL DECK Total n ilai Kateg o ri Vek to r KMR AWAK KAPAL T o tal n ilai Kateg o ri Vek to r KAMAR MANDI/TOILET T o tal n ilai Kateg o ri Vek to r DAPUR Total n ilai Kateg o ri Vek to r GUD PERS MAKANAN T o tal n ilai Kateg o ri Vek tor No Komponen Penilaian No Komponen Penilaian No Komponen Penilaian No Komponen Penilaian No Komponen Penilaian 1 2 3 4 5 1 2 3 4 1 2 3 4 5 6 7 1 2 3 4 5 6 7 8 1 2 3 4 5 6 7
Nilai Nilai Nilai Nilai Nilai
46 1 0 0 1 1 3 TR Ad 0 0 1 0 1 A R Ta 1 0 0 1 1 1 1 5 TR Ta 0 1 1 1 0 1 0 1 5 TR Ad 0 0 0 1 0 0 0 1 AR Ta 47 1 0 0 1 1 3 TR Ta 1 0 0 0 1 A R Ta 1 0 0 0 1 1 1 4 TR Ta 0 1 1 0 0 0 0 1 3 AR Ta 0 0 0 0 1 0 1 2 AR Ta 48 1 1 1 1 0 4 TR Ad 0 0 1 0 1 A R Ad 1 0 0 1 1 1 1 5 TR Ta 0 0 0 1 1 1 0 0 3 AR Ad 0 1 1 0 0 0 1 3 AR Ad 49 1 1 0 1 0 3 TR Ad 0 0 0 1 1 A R Ad 1 0 0 1 1 1 1 5 TR Ta 0 0 1 0 0 0 0 1 3 AR Ta 0 0 0 1 0 0 0 1 AR Ad 50 1 1 1 1 0 4 TR Ad 0 0 1 0 1 A R Ta 1 1 1 1 0 0 0 4 TR Ta 0 0 1 0 0 0 1 1 3 AR Ta 0 0 0 1 0 0 0 1 AR Ad 51 1 1 1 0 1 4 TR Ta 0 1 0 0 1 A R Ta 1 1 1 1 1 1 1 7 TR Ta 0 0 1 1 1 0 1 1 5 AR Ad 1 1 0 0 0 0 0 2 AR Ad 52 1 1 0 1 0 3 TR Ad 0 1 0 0 1 A R Ta 0 0 1 0 0 0 1 2 A R Ad 1 1 0 1 1 1 1 0 6 TR Ad 1 1 1 0 0 0 0 3 AR Ad 53 0 0 1 1 1 3 TR Ta 0 0 1 0 1 A R Ad 0 1 1 1 1 0 1 5 TR Ta 0 0 0 1 1 1 0 0 3 AR Ta 0 1 0 1 0 0 0 2 AR Ad 54 1 1 1 1 0 4 TR Ta 0 0 1 0 1 A R Ad 0 1 1 0 0 0 0 2 A R Ad 0 1 1 0 0 0 0 0 2 AR Ad 0 0 0 1 1 0 1 3 AR Ad
Ket :- AR (Ada Risiko)
- TR (Tidak ada risiko)
- Ad (Ada)
Frequencies
deck 7 13.0 13.0 13.0 47 87.0 87.0 100.0 54 100.0 100.0 res ikotidak ada resiko Total
Valid
Frequency Percent Valid Percent
Cumul ative Percent vektordeck 18 33.3 33.3 33.3 36 66.7 66.7 100.0 54 100.0 100.0 ada tidak ada Total Valid
Frequency Percent Valid Percent
Cumul ative Percent
kamar awak kapal
38 70.4 70.4 70.4
16 29.6 29.6 100.0
54 100.0 100.0
res iko
tidak ada resiko Total
Valid
Frequency Percent Valid Percent
Cumul ative Percent vektorkamarawak 37 68.5 68.5 68.5 17 31.5 31.5 100.0 54 100.0 100.0 ada tidak ada Total Valid
Frequency Percent Valid Percent
Cumul ative Percent toilet 35 64.8 64.8 64.8 19 35.2 35.2 100.0 54 100.0 100.0 res iko
tidak ada resiko Total
Valid
Frequency Percent Valid Percent
Cumul ative Percent
vektoroilet 35 64.8 64.8 64.8 19 35.2 35.2 100.0 54 100.0 100.0 ada tidak ada Total Valid
Frequency Percent Valid Percent
Cumul ative Percent dapur 32 59.3 59.3 59.3 22 40.7 40.7 100.0 54 100.0 100.0 res iko
tidak ada resiko Total
Valid
Frequency Percent Valid Percent
Cumul ative Percent vektordapur 40 74.1 74.1 74.1 14 25.9 25.9 100.0 54 100.0 100.0 ada tidak ada Total Valid
Frequency Percent Valid Percent
Cumul ative Percent
gudang persediaan makanan
37 68.5 68.5 68.5
17 31.5 31.5 100.0
54 100.0 100.0
res iko
tidak ada resiko Total
Valid
Frequency Percent Valid Percent
Cumul ative Percent vektorgudang 38 70.4 70.4 70.4 16 29.6 29.6 100.0 54 100.0 100.0 ada tidak ada Total Valid
Frequency Percent Valid Percent
Cumul ative Percent
Crosstabs
deck * keberadaan vektor
Crosstab 6 1 7 4.8 2.2 7.0 85.7% 14.3% 100.0% 11.1% 1.9% 13.0% 31 16 47 32.2 14.8 47.0 66.0% 34.0% 100.0% 57.4% 29.6% 87.0% 37 17 54 37.0 17.0 54.0 68.5% 31.5% 100.0% 68.5% 31.5% 100.0% Count
Ex pec ted Count % within deck % of Total Count
Ex pec ted Count % within deck % of Total Count
Ex pec ted Count % within deck % of Total res iko
tidak ada resik o deck
Total
ada tidak ada keberadaan vektor Total Chi-Square Tests 1.102b 1 .294 .377 1 .539 1.248 1 .264 .412 .281 1.082 1 .298 54 Pearson Chi-Square Continuity Correctiona Likelihood Ratio Fis her's Exact Test Linear-by-Linear As soci ation N of Valid Cases Value df As ymp. Sig. (2-sided) Exact Sig. (2-sided) Exact Sig. (1-sided)
Computed only for a 2x2 table a.
2 cells (50.0%) have expected count less than 5. The mi nimum expected count is 2. 20. b. Risk Estimate 3.0 97 .34 3 27 .985 1.3 00 .90 2 1.8 73 .42 0 .06 5 2.6 89 54 Od ds Ratio for d eck
(re siko / tida k ad a res iko) Fo r coh ort keberadaa n vektor = ada
Fo r coh ort keberadaa n vektor = tida k ad a N o f Va lid Cases
Va lue Lo wer Up per
95 % Co nfid ence Interval
kamar awak kapal * keberadaan vektor
Crosstab 30 8 38 26.0 12.0 38.0 78.9% 21.1% 100.0% 55.6% 14.8% 70.4% 7 9 16 11.0 5.0 16.0 43.8% 56.3% 100.0% 13.0% 16.7% 29.6% 37 17 54 37.0 17.0 54.0 68.5% 31.5% 100.0% 68.5% 31.5% 100.0% CountEx pec ted Count % within kamar awak k apal % of Total Count
Ex pec ted Count % within kamar awak k apal % of Total Count
Ex pec ted Count % within kamar awak k apal % of Total res iko
tidak ada resik o kamar awak
kapal
Total
ada tidak ada keberadaan vek tor
Total Chi-Square Tests 6.466b 1 .011 4.938 1 .026 6.229 1 .013 .022 .014 6.347 1 .012 54 Pearson Chi-Square Continuity Correctiona Likelihood Ratio Fis her's Exact Test Linear-by-Linear As soci ation N of Valid Cases Value df As ymp. Sig. (2-sided) Exact Sig. (2-sided) Exact Sig. (1-sided)
Computed only for a 2x2 table a.
0 cells (.0%) have expected count less than 5. The m inim um expected count is 5. 04. b. Risk Estimate 4.8 21 1.3 70 16 .972 1.8 05 1.0 11 3.2 21 .37 4 .17 6 .79 4 54 Od ds Ratio for kama r
awak kapa l (res iko / tid ak a da re siko )
Fo r coh ort kebe rada an ve ktor = ad a
Fo r coh ort kebe rada an ve ktor = tida k ad a N of Va lid Case s
Va lue Lo wer Up per
95 % Confid ence Interva l
toilet * keberadaan vektor
Crosstab 30 5 35 24.0 11.0 35.0 85.7% 14.3% 100.0% 55.6% 9.3% 64.8% 7 12 19 13.0 6.0 19.0 36.8% 63.2% 100.0% 13.0% 22.2% 35.2% 37 17 54 37.0 17.0 54.0 68.5% 31.5% 100.0% 68.5% 31.5% 100.0% Count Expected Count % within toilet % of Total Count Expected Count % within toilet % of Total Count Expected Count % within toilet % of Total res ikotidak ada resiko toi let
Total
ada tidak ada keberadaan vektor Total Chi-Square Tests 13.636b 1 .000 11.464 1 .001 13.557 1 .000 .000 .000 13.384 1 .000 54 Pearson Chi-Square Continuity Correctiona Likelihood Ratio Fis her's Exact Test Linear-by-Linear As soci ation N of Valid Cases Value df As ymp. Sig. (2-sided) Exact Sig. (2-sided) Exact Sig. (1-sided)
Computed only for a 2x2 table a.
0 cells (.0%) have expected count less than 5. The m inim um expected count is 5. 98. b. Risk Estimate 10.286 2.724 38.837 2.327 1.272 4.256 .226 .094 .546 54 Odds Ratio for toilet
(resiko / tidak ada res iko) For cohort keberadaan vektor = ada
For cohort keberadaan vektor = tidak ada N of Valid Cases
Value Lower Upper
95% Confidence Interval
dapur * keberadaan vektor
Crosstab 28 4 32 21.9 10.1 32.0 87.5% 12.5% 100.0% 51.9% 7.4% 59.3% 9 13 22 15.1 6.9 22.0 40.9% 59.1% 100.0% 16.7% 24.1% 40.7% 37 17 54 37.0 17.0 54.0 68.5% 31.5% 100.0% 68.5% 31.5% 100.0% Count Expected Count % within dapur % of Total Count Expected Count % within dapur % of Total Count Expected Count % within dapur % of Total res ikotidak ada resiko dapur
Total
ada tidak ada keberadaan vektor Total Chi-Square Tests 13.120b 1 .000 11.049 1 .001 13.393 1 .000 .001 .000 12.877 1 .000 54 Pearson Chi-Square Continuity Correctiona Likelihood Ratio Fis her's Exact Test Linear-by-Linear As soci ation N of Valid Cases Value df As ymp. Sig. (2-sided) Exact Sig. (2-sided) Exact Sig. (1-sided)
Computed only for a 2x2 table a.
0 cells (.0%) have expected count less than 5. The m inim um expected count is 6. 93. b. Risk Estimate 10.111 2.624 38.965 2.139 1.273 3.594 .212 .079 .564 54 Odds Ratio for dapur
(resiko / tidak ada res iko) For cohort keberadaan vektor = ada
For cohort keberadaan vektor = tidak ada N of Valid Cases
Value Lower Upper
95% Confidence Interval
gudang persediaan makanan * keberadaan vektor
Crosstab 29 8 37 25.4 11.6 37.0 78.4% 21.6% 100.0% 53.7% 14.8% 68.5% 8 9 17 11.6 5.4 17.0 47.1% 52.9% 100.0% 14.8% 16.7% 31.5% 37 17 54 37.0 17.0 54.0 68.5% 31.5% 100.0% 68.5% 31.5% 100.0% CountEx pec ted Count % within gudang persediaan makanan % of Total
Count
Ex pec ted Count % within gudang persediaan makanan % of Total
Count
Ex pec ted Count % within gudang persediaan makanan % of Total
res iko
tidak ada resik o gudang persediaan
makanan
Total
ada tidak ada keberadaan vek tor
Total Chi-Square Tests 5.297b 1 .021 3.944 1 .047 5.131 1 .023 .030 .025 5.199 1 .023 54 Pearson Chi-Square Continuity Correctiona Likelihood Ratio Fis her's Exact Test Linear-by-Linear As soci ation N of Valid Cases Value df As ymp. Sig. (2-sided) Exact Sig. (2-sided) Exact Sig. (1-sided)
Computed only for a 2x2 table a.
0 cells (.0%) have expected count less than 5. The m inim um expected count is 5. 35. b. Risk Estimate 4.078 1.189 13.991 1.666 .979 2.835 .408 .191 .873 54 Odds Ratio for gudang
persediaan makanan (resiko / tidak ada res iko) For cohort keberadaan vektor = ada
For cohort keberadaan vektor = tidak ada N of Valid Cases
Value Lower Upper
95% Confidence Interval
Logistic Regression
Case Processing Summary
54 100.0 0 .0 54 100.0 0 .0 54 100.0 Unweighted Casesa
Included in Anal ysis Mis sing Cases Total
Selected Cases
Unselected Cas es Total
N Percent
If weight is in effect, s ee class ification table for the total number of cases.
a.
De pe n de n t V a ria ble Enc odi ng 0 1 Or igina l Va lue
ad a
tid ak a da
Int erna l Va lue
Block 0: Beginning Block
Classification Tablea,b
37 0 100.0 17 0 .0 68.5 Observed ada tidak ada keberadaan vektor Overall Percentage Step 0
ada tidak ada
keberadaan vektor Percentage Correct Predicted
Constant is included in the model. a.
The cut value is .500 b.
Variables in the Equation
-.778 .293 7.045 1 .008 .459 Constant
St ep 0
Va riables not in the Equa tion 1.102 1 .294 1.102 1 .294 deck Variables Overall Statistic s St ep 0 Sc ore df Sig.
Block 1: Method = Enter
Omnibus Tests of Model Coefficients
1.2 48 1 .26 4 1.2 48 1 .26 4 1.2 48 1 .26 4 Ste p Blo ck Mo del Ste p 1
Ch i-sq uare df Sig .
Model Summary 66.025a .023 .032 Step 1 -2 Log likelihood
Cox & Snel l R Square
Nagelkerke R Square
Es timation term inated at iteration num ber 5 because param eter estim ates changed by les s than .001. a. Classification Tablea 37 0 100.0 17 0 .0 68.5 Observed ada tidak ada keberadaan vektor Overall Percentage Step 1
ada tidak ada
keberadaan vektor Percentage Correct Predicted
The cut value is .500 a.
Variables in the Equation
1.130 1.123 1.013 1 .314 3.097 .343 27.985 -2.922 2.182 1.793 1 .181 .054 deck Constant Step 1a
B S.E. Wald df Sig. Exp(B) Lower Upper 95.0% C.I.for EXP(B)
Variable(s) entered on s tep 1: deck. a.
Logistic Regression
Case Processing Summary
54 100.0 0 .0 54 100.0 0 .0 54 100.0 Unweighted Casesa
Included in Anal ysis Mis sing Cases Total
Selected Cases
Unselected Cas es Total
N Percent
If weight is in effect, s ee class ification table for the total number of cases.
a.
De pe n de n t V a ria ble Enc odi ng 0 1 Or igina l Va lue
ad a
tid ak a da
Int erna l Va lue
Block 0: Beginning Block
Classification Tablea,b
37 0 100.0 17 0 .0 68.5 Observed ada tidak ada keberadaan vektor Overall Percentage Step 0
ada tidak ada
keberadaan vektor Percentage Correct Predicted
Constant is included in the model. a.
The cut value is .500 b.
Variables in the Equation
-.778 .293 7.045 1 .008 .459 Constant
St ep 0
Va riables not in the Equa tion 6.466 1 .011 6.466 1 .011 ktotk Variables Overall Statistic s St ep 0 Sc ore df Sig.
Block 1: Method = Enter
Omnibus Tests of Model Coefficients
6.2 29 1 .01 3 6.2 29 1 .01 3 6.2 29 1 .01 3 Ste p Blo ck Mo del Ste p 1
Ch i-sq uare df Sig .
Model Summary 61.044a .109 .153 Step 1 -2 Log likelihood
Cox & Snel l R Square
Nagelkerke R Square
Es timation term inated at iteration num ber 4 because param eter estim ates changed by les s than .001. a. Classification Tablea 30 7 81.1 8 9 52.9 72.2 Observed ada tidak ada keberadaan vektor Overall Percentage Step 1
ada tidak ada
keberadaan vektor Percentage Correct Predicted
The cut value is .500 a.
Variables in the Equation
1.573 .642 6.002 1 .014 4.821 1.370 16.972 -2.895 .942 9.444 1 .002 .055 ktotk Constant Step 1a
B S.E. Wald df Sig. Exp(B) Lower Upper 95.0% C.I.for EXP(B)
Variable(s) entered on s tep 1: ktotk. a.
Logistic Regression
Case Processing Summary
54 100.0 0 .0 54 100.0 0 .0 54 100.0 Unweighted Casesa
Included in Anal ysis Mis sing Cases Total
Selected Cases
Unselected Cas es Total
N Percent
If weight is in effect, s ee class ification table for the total number of cases.
a.
De pe n de n t V a ria ble Enc odi ng 0 1 Or igina l Va lue
ad a
tid ak a da
Int erna l Va lue
Block 0: Beginning Block
Classification Tablea,b
37 0 100.0 17 0 .0 68.5 Observed ada tidak ada keberadaan vektor Overall Percentage Step 0
ada tidak ada
keberadaan vektor Percentage Correct Predicted
Constant is included in the model. a.
The cut value is .500 b.
Variables in the Equation
-.778 .293 7.045 1 .008 .459 Constant
St ep 0
Va riables not in the Equa tion 13.636 1 .000 13.636 1 .000 km tot Variables Overall Statistic s St ep 0 Sc ore df Sig.
Block 1: Method = Enter
Omnibus Tests of Model Coefficients
13 .557 1 .00 0 13 .557 1 .00 0 13 .557 1 .00 0 Ste p Blo ck Mo del Ste p 1
Ch i-sq uare df Sig .
Model Summary 53.716a .222 .312 Step 1 -2 Log likelihood
Cox & Snel l R Square
Nagelkerke R Square
Es timation term inated at iteration num ber 5 because param eter estim ates changed by les s than .001. a. Classification Tablea 30 7 81.1 5 12 70.6 77.8 Observed ada tidak ada keberadaan vektor Overall Percentage Step 1
ada tidak ada
keberadaan vektor Percentage Correct Predicted
The cut value is .500 a.
Variables in the Equation
2.331 .678 11.822 1 .001 10.286 2.724 38.837 -4.123 1.077 14.657 1 .000 .016 kmtot Constant Step 1a
B S.E. Wald df Sig. Exp(B) Lower Upper 95.0% C.I.for EXP(B)
Variable(s) entered on s tep 1: kmtot. a.
Logistic Regression
Case Processing Summary
54 100.0 0 .0 54 100.0 0 .0 54 100.0 Unweighted Casesa
Included in Anal ysis Mis sing Cases Total
Selected Cases
Unselected Cas es Total
N Percent
If weight is in effect, s ee class ification table for the total number of cases.
a.
De pe n de n t V a ria ble Enc odi ng 0 1 Or igina l Va lue
ad a
tid ak a da
Int erna l Va lue
Block 0: Beginning Block
Classification Tablea,b
37 0 100.0 17 0 .0 68.5 Observed ada tidak ada keberadaan vektor Overall Percentage Step 0
ada tidak ada
keberadaan vektor Percentage Correct Predicted
Constant is included in the model. a.
The cut value is .500 b.
Variables in the Equation
-.778 .293 7.045 1 .008 .459 Constant
St ep 0
Va riables not in the Equa tion 13.120 1 .000 13.120 1 .000 datotk Variables Overall Statistic s St ep 0 Sc ore df Sig.
Block 1: Method = Enter
Omnibus Tests of Model Coefficients
13 .393 1 .00 0 13 .393 1 .00 0 13 .393 1 .00 0 Ste p Blo ck Mo del Ste p 1
Ch i-sq uare df Sig .
Model Summary 53.880a .220 .308 Step 1 -2 Log likelihood
Cox & Snel l R Square
Nagelkerke R Square
Es timation term inated at iteration num ber 5 because param eter estim ates changed by les s than .001. a. Classification Tablea 28 9 75.7 4 13 76.5 75.9 Observed ada tidak ada keberadaan vektor Overall Percentage Step 1
ada tidak ada
keberadaan vektor Percentage Correct Predicted
The cut value is .500 a.
Variables in the Equation
2.314 .688 11.299 1 .001 10.111 2.624 38.965 -4.260 1.154 13.633 1 .000 .014 datotk Constant Step 1a
B S.E. Wald df Sig. Exp(B) Lower Upper 95.0% C.I.for EXP(B)
Variable(s) entered on s tep 1: datotk. a.
Logistic Regression
Case Processing Summary
54 100.0 0 .0 54 100.0 0 .0 54 100.0 Unweighted Casesa
Included in Anal ysis Mis sing Cases Total
Selected Cases
Unselected Cas es Total
N Percent
If weight is in effect, s ee class ification table for the total number of cases.
a.
De pe n de n t V a ria ble Enc odi ng 0 1 Or igina l Va lue
ad a
tid ak a da
Int erna l Va lue
Block 0: Beginning Block
Classification Tablea,b
37 0 100.0 17 0 .0 68.5 Observed ada tidak ada keberadaan vektor Overall Percentage Step 0
ada tidak ada
keberadaan vektor Percentage Correct Predicted
Constant is included in the model. a.
The cut value is .500 b.
Variables in the Equation
-.778 .293 7.045 1 .008 .459 Constant
St ep 0
Va riables not in the Equa tion 5.297 1 .021 5.297 1 .021 gtotk Variables Overall Statistic s St ep 0 Sc ore df Sig.
Block 1: Method = Enter
Omnibus Tests of Model Coefficients
5.1 31 1 .02 3 5.1 31 1 .02 3 5.1 31 1 .02 3 Ste p Blo ck Mo del Ste p 1
Ch i-sq uare df Sig .
Model Summary 62.142a .091 .127 Step 1 -2 Log likelihood
Cox & Snel l R Square
Nagelkerke R Square
Es timation term inated at iteration num ber 4 because param eter estim ates changed by les s than .001. a. Classification Tablea 29 8 78.4 8 9 52.9 70.4 Observed ada tidak ada keberadaan vektor Overall Percentage Step 1
ada tidak ada
keberadaan vektor Percentage Correct Predicted
The cut value is .500 a.
Variables in the Equation
1.406 .629 4.995 1 .025 4.078 1.189 13.991 -2.693 .935 8.300 1 .004 .068 gtotk Constant Step 1a
B S.E. Wald df Sig. Exp(B) Lower Upper 95.0% C.I.for EXP(B)
Variable(s) entered on s tep 1: gtotk. a.
Logistic Regression
Case Processing Summary
54 100.0 0 .0 54 100.0 0 .0 54 100.0 Unweighted Casesa
Included in Anal ysis Mis sing Cases Total
Selected Cases
Unselected Cas es Total
N Percent
If weight is in effect, s ee class ification table for the total number of cases.
a.
De pe n de n t V a ria ble Enc odi ng 0 1 Or igina l Va lue
ad a
tid ak a da
Int erna l Va lue
Block 0: Beginning Block
Classification Tablea,b
37 0 100.0 17 0 .0 68.5 Observed ada tidak ada keberadaan vektor Overall Percentage Step 0
ada tidak ada
keberadaan vektor Percentage Correct Predicted
Constant is included in the model. a.
The cut value is .500 b.
Variables in the Equation
-.778 .293 7.045 1 .008 .459 Constant
St ep 0
Va riables not in the Equa tion 6.466 1 .011 13.636 1 .000 13.120 1 .000 5.297 1 .021 21.556 4 .000 ktotk km tot datotk gtotk Variables Overal l Statisti cs St ep 0 Sc ore df Si g.
Block 1: Method = Enter
Omnibus Tests of Model Coefficients
24 .286 4 .00 0 24 .286 4 .00 0 24 .286 4 .00 0 Ste p Blo ck Mo del Ste p 1
Ch i-sq uare df Sig .
Model Summary 42.987a .362 .509 Step 1 -2 Log likelihood
Cox & Snel l R Square
Nagelkerke R Square
Es timation term inated at iteration num ber 6 because param eter estim ates changed by les s than .001. a. Classification Tablea 36 1 97.3 7 10 58.8 85.2 Observed ada tidak ada keberadaan vektor Overall Percentage Step 1
ada tidak ada
keberadaan vektor Percentage Correct Predicted
The cut value is .500 a.
Variables in the Equation
1.229 .795 2.392 1 .122 3.418 .720 16.228 1.538 .801 3.683 1 .055 4.655 .968 22.387 1.677 .847 3.923 1 .048 5.348 1.018 28.108 1.466 .833 3.097 1 .078 4.330 .846 22.153 -9.206 2.501 13.544 1 .000 .000 ktotk kmtot datotk gtotk Constant Step 1a
B S.E. Wald df Sig. Exp(B) Lower Upper 95.0% C.I.for EXP(B)
Variable(s) entered on s tep 1: ktotk, kmtot, datotk, gtotk. a.
Logistic Regression
Case Processing Summary
54 100.0 0 .0 54 100.0 0 .0 54 100.0 Unweighted Casesa
Included in Anal ysis Mis sing Cases Total
Selected Cases
Unselected Cas es Total
N Percent
If weight is in effect, s ee class ification table for the total number of cases.
a.
De pe n de n t V a ria ble Enc odi ng 0 1 Or igina l Va lue
ad a
tid ak a da
Int erna l Va lue
Block 0: Beginning Block
Classification Tablea,b
37 0 100.0 17 0 .0 68.5 Observed ada tidak ada keberadaan vektor Overall Percentage Step 0
ada tidak ada
keberadaan vektor Percentage Correct Predicted
Constant is included in the model. a.
The cut value is .500 b.
Variables in the Equation
-.778 .293 7.045 1 .008 .459 Constant
St ep 0
Variables not in the Equation 13.636 1 .000 13.120 1 .000 5.297 1 .021 20.192 3 .000 km tot datotk gtotk Variabl es Overall Statistics Step 0 Score df Sig.
Block 1: Method = Enter
Omnibus Tests of Model Coefficients
21 .827 3 .00 0 21 .827 3 .00 0 21 .827 3 .00 0 Ste p Blo ck Mo del Ste p 1
Ch i-sq uare df Sig .
Model Summary 45.446a .332 .467 Step 1 -2 Log likelihood
Cox & Snel l R Square
Nagelkerke R Square
Es timation term inated at iteration num ber 5 because param eter estim ates changed by les s than .001. a. Classification Tablea 33 4 89.2 6 11 64.7 81.5 Observed ada tidak ada keberadaan vektor Overall Percentage Step 1
ada tidak ada
keberadaan vektor Percentage Correct Predicted
The cut value is .500 a.
Variables in the Equation
1.434 .783 3.351 1 .067 4.194 .904 19.463 1.905 .819 5.414 1 .020 6.721 1.350 33.453 1.390 .809 2.948 1 .086 4.014 .821 19.612 -7. 574 1.993 14.437 1 .000 .001 kmtot datotk gtotk Constant St ep 1a
B S. E. W ald df Sig. Ex p(B) Lower Upper 95.0% C.I. for EXP(B)
Variable(s) ent ered on step 1: k mtot, datotk , gtotk. a.
Logistic Regression
Case Processing Summary
54 100.0 0 .0 54 100.0 0 .0 54 100.0 Unweighted Casesa
Included in Anal ysis Mis sing Cases Total
Selected Cases
Unselected Cas es Total
N Percent
If weight is in effect, s ee class ification table for the total number of cases.
a.
De pe n de n t V a ria ble Enc odi ng 0 1 Or igina l Va lue
ad a
tid ak a da
Int erna l Va lue
Block 0: Beginning Block
Classification Tablea,b
37 0 100.0 17 0 .0 68.5 Observed ada tidak ada keberadaan vektor Overall Percentage Step 0
ada tidak ada
keberadaan vektor Percentage Correct Predicted
Constant is included in the model. a.
The cut value is .500 b.
Variables in the Equation
-.778 .293 7.045 1 .008 .459 Constant
St ep 0
Variables not in the Equation 13.636 1 .000 13.120 1 .000 17.912 2 .000 km tot datotk Variabl es Overall Statistics Step 0 Score df Sig.
Block 1: Method = Enter
Omnibus Tests of Model Coefficients
18 .735 2 .00 0 18 .735 2 .00 0 18 .735 2 .00 0 Ste p Blo ck Mo del Ste p 1
Ch i-sq uare df Sig .
Model Summary 48.538a .293 .412 Step 1 -2 Log likelihood
Cox & Snel l R Square
Nagelkerke R Square
Es timation term inated at iteration num ber 5 because param eter estim ates changed by les s than .001. a. Classification Tablea 33 4 89.2 7 10 58.8 79.6 Observed ada tidak ada keberadaan vektor Overall Percentage Step 1
ada tidak ada
keberadaan vektor Percentage Correct Predicted
The cut value is .500 a.
Variables in the Equation
1.703 .743 5.251 1 .022 5.492 1.279 23.573 1.694 .754 5.052 1 .025 5.441 1.242 23.831 -5.768 1.455 15.713 1 .000 .003 kmtot datotk Constant Step 1a
B S.E. Wald df Sig. Exp(B) Lower Upper 95.0% C.I.for EXP(B)
Variable(s) entered on s tep 1: kmtot, datotk. a.