HIGHER EDUCATION STUDENTS’ PERCEPTION ABOUT PEER ASSESSMENT PRACTICE
Didik Rinan Sumekto
Postgraduate Student of English Education State University of Semarang, Indonesia; Widya Dharma University, Klaten, Indonesia
Abstract: Nowadays classroom’s peer assessment has strategic roles in bridging students’ collaborative writing improvement when conducted peer assessment. This study investigates higher education students’ perception about peer assessment model. Respondents are 179 English education students (N=179) from Muhammadiyah University of Purworejo, Central Java. Research sampling uses stratified random sampling technique. Data analysis is carried out by statistical analysis through descriptive statistics applications. Findings prove that the frequencies analysis shows that higher education students’ perception towards peer assessment practice is supported by the lecturer’s trust, assessment accuracy, and students’ expectation. The effective contribution towards this study constitutes 34%, whereas another 66% of research contribution can be influenced and supported by other factors out of those three variables.
Keywords:Assessment accuracy, collaboration, lecturer’s trust, students’ expectation
Introduction
Assessment in higher education is intended to fulfill about as students have a view expressed in driven assessment through the strategic subject of learning (Campbell and Norton, 2007) and its idea is primarily intended toward the learning enhancement (Hargreaves, 2007). Assessment continues throughout the learning to transform the classroom targets into high quality classroom assessments (Stiggins, 2005). It is also to find out what changes might be made in teaching methods, course organization or content, evaluation and grading procedures, etc., in order to improve student learning (York University, 2002) and ideally to help students plan their learning, identify their strengths and weaknesses and develop transferable skills (Al-A’ali, 2007).
Assessment was used to viewing as a means to determine grades on students’ work results and to find out to what extent students had reached the intended objectives during the learning process for years. But, nowadays there is a realization that the potential benefits of assessing are much wider and affect on all stages of the learning process (Watering et al, 2008). Accordingly, peer assessment is one form of innovation which aims to improve the learning quality and empower the learners from the overall assessment process (Meletiadau, 2012).
The assessment perception in higher education is defined as students’ act of perceiving the assessment activities (Watering et al, 2008), since peer assessment is a novel model to some higher education students (Meletiadau, 2012) and currently adopted technique to improve the learning process (Lai and Lan, 2006). Peer assessment is one of the most popular tools for doing assessment for learning adopted in education. It seems to be a viable alternative to involve students in the assessment process and promote independence in undergraduate level (Meletiadau, 2012) through the learners’ preparation in assessment procedure which depends on how they perceive the assessment–before, during and after the assessment (Watering et al, 2008). One transparent and accountable way in doing peer assessment refers to validity facts which commonly concerns with the introduction, approach how to give mark(s) accordingly representing the performance quality, as well as truly depending on the assessment design and criteria (Verkade and Richardson, 2013), and inspiring learners’ learning enthusiasm and designing next instruction program (Qu and Yang, 2010). Thus, an exploration about students’ views about the validity and the need of providing relevant criteria of implementing peer assessment is quite important when probes students’ perception about peer assessment activities (Wen and Tsai, 2006).
designed to stimulate growth, change and improvement in instruction through reflective practice (York University, 2002).
It is apparent that peer-involvement creates opportunities for interaction while increasing objectivity in assessment. If learners are placed in a situation where they can access information on the quality and level of their own performances or those of their peers, they will be possibly able to clarify and deepen their own understanding of the assessment criteria set and required (Patri, 2002). Students are expected to generate creative answers and are rewarded when they respond differently from other students which have a focus on the mastery of higher level functioning skills that was compatible with peer assessment technique requiring the participants to construct responses using their knowledge, as believed that problem solving and critical thinking skills are more important than merely finding facts and reviewing basic skills (Cunningham, 1998). In peer assessment, students have the opportunity to observe the whole process of learning of their peers. Setting up and facilitating students’ peer-assessment can provide students with deep learning experiences as well as a wealth of feedback to evaluate. In this kind of reflection, students step back from the learning process to think about their language learning strategies and their progress as language learners. Students can promote mutual supervision among members of the group and learn from each other which potentially stimulate their motivation through the peer evaluation (Qu and Yang, 2010). So, one of the easiest ways of helping students is to give feedback which directly and explicitly related to each of the assessment criteria (Campbell and Norton, 2007).
As a part from academic achievement and social interaction amongst the undergraduate students during its implementation, peer assessment model is also aware of containing some deficiencies. Those deficiencies refer to (1) friendship marking–resulting in over-marking; (2) collusive marking–resulting in a lack of differentiation within groups; (3) decibel marking–where individuals dominate groups and get the highest marks; and (4) parasite marking–where students fail to contribute but obtaining benefit from group marks (Sluijsmans, Dochy, and Moerkerke, 1998). Over-marking by peers as ‘friendship marking’ or ‘decibel marking’ could impact peers find it difficult to criticize their friends (Falchikov, 1995; Patri, 2002). Problems can arise when group work is assessed and the same mark is awarded to individual students irrespective of their contribution to the group work. The participants think the assessment in the group as unfair and inequitable if there is equal reward for unequal contributions. Therefore, the negative experience can lead to students feeling meaningless and dissatisfied with the results in group work (Al-A’ali, 2007). Learners over- or under-estimating their own and their peers’ language skills affects the validity of assessments with low achievers over-estimating and high achievers under-estimating (Patri, 2002), because the use of the averaged peer scores as the ‘standard ’ can be questioned that peer assessments are likely to have poor validity and low reliability (Magin, 2001).
Aim and research questions
This study aimed to investigate the role of peer assessment practice in contributing to the higher education students of English education experience during their collaborative writing works in the classroom. To obtain the aim, this study revealed the perceptions of peer assessment practice with the following research questions: (1) how do higher education students perceive the peer assessment practice; and (2) what factors may contribute towards the peer assessment practice amongst the higher education students?
Methods
Population and Sample
The research population was higher education students of English education in undergraduate degree from Muhammadiyah University of Purworejo (UMP), Central Java, Indonesia. All participants had already attended the writing course in semester 4 and 5. The number of sample size (N) was 179 respondents out of 360 population and had been chosen through the stratified random sampling technique. McMillan and Schumacher (2001) pointed out that the sample size determination should impact to the research design, hypothesis, benefits, number of variables focused, data collection method, and findings. The minimum sample size determination herein adopted Cohen’s formulation (1977).
Procedure
Data Analysis
Data analysis technique was to determine the contribution of each item upon lecturer’s trust, assessment accuracy, and students’ expectation data by applying descriptive statistical analysis technique and simple correlation analysis. The variable data description was intended to reveal the data distribution. The central tendency measurement was applied to obtain mean (M), median (Md), mode (Mo), and standard deviation (SD).
Findings and Discussion
Lecturer’s Trust
[image:3.595.170.436.288.390.2]Table 1 summarized that the findings upon lecturer’s trust variable amongst the respondents’ perception had appreciated empirically, in which it could be stated into very important category with the highest contribution of this variable was 64%. Overall, the score distribution on lecturer’s trust could be described in the following: (1) there were 64% or 114 respondents responding that the lecturer’s trust was very important; (2) 19% or 34 respondents definitely appreciating that the lecturer’s trust was important; (3) 16.7% or 30 respondents also proving that the lecturer’s trust was moderate; (4) 0.2% or 1 respondent indicating that lecturer’s trust was less important, and there was no respondent stating that lecturer’s trust was not important. Based on the findings obtained, the lowest score was 21 and the highest score was 84, whereas the mean score was 56.04 and standard deviation was 4.586.
Table 1. Score Distribution on Lecturer’s Trust
Category Interval Frequency Percentage (%)
Very Important 69 - 84 114 64 Important 53 - 68 34 19 Moderate 37 - 52 30 16.7 Less Important 21 - 36 1 0.2 Not Important 5 - 20 0 0
Total - 179 100
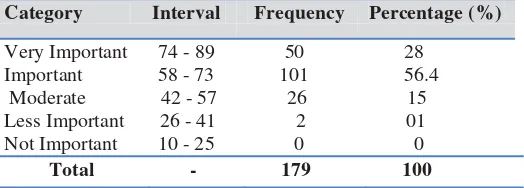
Assessment Accuracy
[image:3.595.173.435.539.633.2]Table 2 precisely described that the findings upon assessment accuracy variable perceived by the respondents had appreciated empirically, where the achievement level showed the important category with the highest contribution of this variable was 56.4%. Overall, the score distribution on assessment accuracy could be described in the following: (1) there were 64% or 114 respondents responding that the assessment accuracy was very important; (2) 19% or 34 respondents definitely appreciating that the assessment accuracy was important; (3) 16.7% or 30 respondents also proving that the assessment accuracy moderate; (4) 0.2% or 1 respondent indicating that assessment accuracy was less important, and there was no respondent stating that assessment accuracy was not important. Based on the findings obtained, the lowest score was 26 and the highest score was 89, whereas the mean score was 55.87 and standard deviation was 6.547.
Table 2. Score Distribution on Assessment Accuracy
Category Interval Frequency Percentage (%)
Very Important 74 - 89 50 28 Important 58 - 73 101 56.4
Moderate 42 - 57 26 15 Less Important 26 - 41 2 01 Not Important 10 - 25 0 0
Total - 179 100
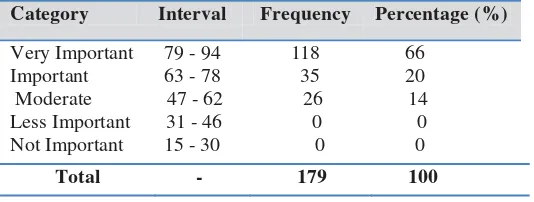
Students’ expectation
was either less important or not important. Based on the findings obtained, the lowest score was 47 and the highest score was 94, whereas the mean score was 54.09 and standard deviation was 5.642.
Table 3. Score Distribution on Students’ Expectation
Category Interval Frequency Percentage (%)
Very Important 79 - 94 118 66
Important 63 - 78 35 20
Moderate 47 - 62 26 14
Less Important 31 - 46 0 0
Not Important 15 - 30 0 0
Total - 179 100
Conclusions and Suggestions
The findings and discussion upon higher education students’ perception about peer assessment practice can be drawn into: firstly, there are 52% or 93 out of 179 respondents contributing that the peer assessment practice can support their collaborative works during the writing course activities. This perception is empirically proved through five categories given in the questionnaire, where the category of ‘very important’ ranks the highest contribution. In contributing its practice, peer assessment gains three supporting variables, such as lecturer’s trust, assessment accuracy, and students’ expectation in this study. Secondly, the determinant coefficients (R²) result of 0.340 or 34% indicates the research contribution of peer assessment practice, in which this contribution is determined by the lecturer’s trust, assessment accuracy, and students’ expectation variable. Meanwhile, another 66% of this research contribution will be influenced and supported by other variables out of these three variables. Thus, there will be advisable that other variables can be academically considered as an approach on designing, implementing, and developing the instruments to support the relevant variables towards peer assessment issues.
References
Al-A’ali, M. (2007). Adoption of peer-to-peer assessment in a computing skills course. American Journal of Applied Sciences, 4(10), 828-833.
Campbell, A. & Norton, L. (2007). Learning, teaching and assessing in higher education: Developing reflective practice. In Norton, L. Using Assessment to Promote Quality Learning in Higher Education, Exeter, Learning Matters Ltd., 92-97.
Cohen, J. (1977). Statistical power analysis for the behavioral sciences (Rev. ed.). New York: Academic Press. Cunningham, G. K. (1998). Assessment in the classroom: Constructing and interpreting texts. London: The
Palmer Press.
Falchikov, N. (1995). Peer feedback marking: Developing peer assessment. Innovation in Education and Training International, 32, 175-187.
Hargreaves, E. (2007). The validity of collaborative assessment for learning. Assessment in Education, 14(2), 1-14.
Lai, K. R., & Lan, C. H. (2006). Modeling peer assessment as agent negotiation in a computer supported collaborative learning environment. Educational Technology & Society, 9(3), 16-26.
Lejk, M., & Wyvill, M. (2001). The effect of the inclusion of self-assessment with peer-assessment of contributions to a group project: a quantitative study of secret and agreed assessments. Assessment & Evaluation in Higher Education, 26(6), 551-561.
Magin, D. J. (2001). A novel technique for comparing the reliability of multiple peer assessments with that of single teacher assessments of group process work. Assessment & Evaluation in Higher Education, 26(2), 139-152.
McMillan, H. J., & Schumacher, S. (2001). Research in education: A conceptual introduction (5thed.). New York: Addison Wesley Longman, Inc.
Meletiadau, E. (2012). The impact of training adolescent EFL learners on their perceptions of peer assessment of writing. Research Papers in Language Teaching and Learning, 3(1), 240-251.
Patri, M. (2002). The influence of peer feedback on self-and peer-assessment of oral skills. Language Testing, 19(2), 109-131.
Qu, W., & Yang, S. (2010). A peer and self-assessment project implemented in practical group work. Journal of Language Teaching and Research, 1(6), 776-781.
Stiggins, R. (2005). Assessment for learning defined. Paper presented at the ETS/Assessment Training Institute’s International Conference: Promoting Sound Assessment in Every Classroom, September 2005, Portland, USA.
Verkade, H., & Richardson, R. J. B. (2013). Student acceptance and application of peer assessment in a final year genetics undergraduate oral presentation. Journal of Peer Learning, 6(1), 1-18.
Watering, G. van de., Gijbels, D., Dochy, F., & Rijt, J. van der. (2008). Student assessment preferences, perceptions of assessment and their relationships to study results.Higher Education, 56, 645-658. Wen, M. L., & Tsai, C-C. (2006). University students’ perceptions of and attitudes towards (online) peer
assessment. Higher Education, 51, 27-44.