Monitoring
137
Cs and
134
Cs at marine coasts in Indonesia between 2011
and 2013
Heny Suseno
⇑, Wahyu Retno Prihatiningsih
Marine Radioecology Group, Center for Radiation Safety Technology and Metrology, National Nuclear Energy Agency, Jl. Lebak Bulus Raya No. 49, Kotak Pos 7043 JKSKL, Jakarta Selatan 12070, Indonesia
a r t i c l e
i n f o
Article history:
Available online 6 September 2014
Keywords:
Fukushima nuclear power plant accident
134Cs 137Cs
Eastern coast of Indonesia Western coast of Indonesia
a b s t r a c t
Environmental samples (seawater, sediments and biota) were collected along the eastern and western Indonesian coasts between 2011 and 2013 to anticipate the possible impacts of the Fukushima radioac-tive releases in Indonesia. On the eastern coasts (south and north Sulawesi), the137Cs concentrations in
the seawater and sediments were 0.12–0.32 Bq m3and 0.10–1.03 Bq kg1, respectively. On the western
coasts (West Sumatra, Bangka Island, North Java, South Java and Madura island), the137Cs concentrations
in the seawater and sediments were 0.12–0.66 Bq m3and 0.19–1.64 Bq kg1, respectively. In general,
the137Cs concentrations in the fish from several Indonesian coasts were <MDA – 109.75 mBq kg1. In
contrast, the137Cs concentrations in mollusk, crab and prawn were 10.65–38.78, 4.02 and 6.16 mBq kg1,
respectively.134Cs was not detected in the seawater, sediments or biota. Thus, it was concluded that137Cs
on the eastern and western Indonesian coasts originated from global fallout.
Ó2014 Elsevier Ltd. All rights reserved.
1. Introduction
Following the Eastern Japanese Earthquake and following the tsunami that occurred on March 11, 2011, the Fukushima Dai-ichi Nuclear Power Plant (1F NPP) of the Tokyo Electric Power Company (TEPCO) was damaged and released137Cs and134Cs radionuclides into the surrounding areas (Maderich et al., 2013). The total amounts of137Cs that were directly released into the sea were esti-mated to equal up to 27 ± 15 PBq (Bailly du Bois et al., 2011).
Tsumune et al. (2012)estimated that 160 PBq 131I and 15 PBq of 137Cs were discharged into the atmosphere from the 1F NPP
reac-tors (No. 1, No. 2 and No. 3).Steinhauser et al. (2014)estimated that more than 80% of the atmospherically released137Cs entered the atmosphere offshore from Fukushima, followed by deposition in the Pacific Ocean.
Due to their chemical properties, the137Cs radionuclides can be soluble in seawater, which allows them to spread over long dis-tances by marine currents and dissipate throughout the oceanic water masses (Povinec et al., 2004). Oceanic currents (e.g., the Oyashio and Kuroshio currents) will transport radionuclides quickly from the western North Pacific Coast off Japan and undergo advection and mixing (Bu et al., 2013). Pacific water that is trans-ferred into the Indian Ocean through this association is well known
as Indonesian Through Flow (ITF) (Sprintall et al., 2009). Thus, the 137Cs and134Cs radionuclides potentially entered the Indonesian
sea from Fukushima through ITF.
In response to the Japan Fukushima Daiichi nuclear accident, the Indonesia National Nuclear Energy Agency (BATAN) conducted an intensified marine environmental radioactivity-monitoring pro-gram. Between 2011 and 2013, monitoring was conducted in some Indonesian estuaries and coastal waters to anticipate the possible impacts of the Fukushima radioactive releases on the Indonesian coastal area. In contrast, Indonesia has followed the IAEA RAS/7/ 021 Project on the marine benchmark study regarding the possible impacts of the Fukushima radioactive release on Asian Pacific regions. 137Cs data must be obtained for the Indonesian marine environment to evaluate the extent and possible impacts in Asian Pacific Regions. Several samples, including surface coastal water, sediments and local biota (fish, mollusk and crustacean) samples, were collected between 2011 and 2013.
2. Methods
2.1. Study area
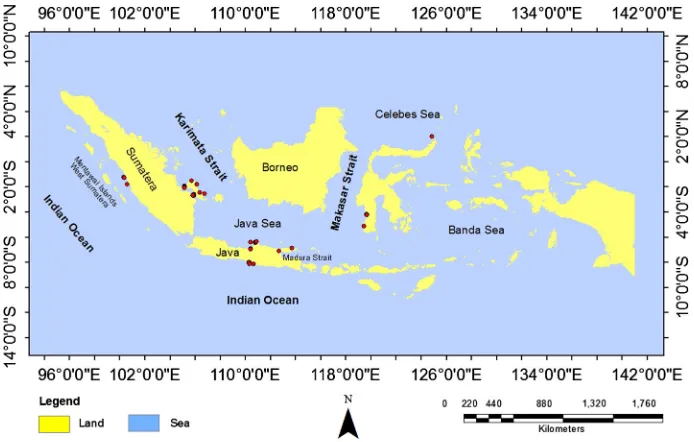
In the present study, sediment samples were collected from various sites of the some Indonesian coastal areas, including West Sumatra, Bangka Island, North and South Java, Madura Island, and north and south Sulawesi. Biota samples were only collected from
http://dx.doi.org/10.1016/j.marpolbul.2014.08.024 0025-326X/Ó2014 Elsevier Ltd. All rights reserved.
⇑ Corresponding author.
E-mail address:henis@batan.go.id(H. Suseno).
Contents lists available atScienceDirect
Marine Pollution Bulletin
Bangka Island Padang and the Java Sea. The sampling locations are shown in Fig. 1. Surface water and sediment samples were col-lected at points that were approximately 1 km off the coast.
Biota samples (fish, shellfish, and crustacean) were bought directly from fish market landings at local harborsides and were stored frozen (20°C) after pooling several specimens into one
sample. Before the radioactivity measurement, each biota sample (wet weights ranged from 1 to 5 kg, or less in the case of benthos) was prepared by drying in a laboratory oven for 2 days at 110°C.
The samples were ashed in a large furnace with a maximum tem-perature of 400°C. After cooling, the ash was transferred to a 7 cm
polyethylene container. The activities of the cesium radionuclides (134Cs and137Cs) were determined using a gamma spectrometer.
Sediment samples were collected with a grab sampler. The sam-ples were dried, homogenized and transferred to plastic contain-ers. Approximately 200 l of the marine water samples were taken from each station before placing into a PVC container. Nearly 10 g of copper(II) nitrate salt was added to the marine water sam-ple and the mixture was stirred until it was homogeneous. Next, 10 g of potassium hexacyanoferrates(II) trihydrate was added and the solution was stirred until red-brownish complexes of copper hexacyanoferrates(II) appeared. The adsorption of cesium onto copper hexacyanoferrates(II) was completed by using sufficient stirring. Next, the precipitate was allowed to settle for 24 h. Then, the precipitate was separated from the marine water sample before washing twice or three times with distilled water and decanting the supernatant solution following centrifugation. The precipitate was dried in a laboratory oven for 1–2 days at 60°C.
This water preparation method was conducted according to the
procedures described by Wo and Ahmad (2004), with minor
modifications.
Radiocesium (137Cs and 134Cs) was measured using gamma counting at photopeaks of 661 keV and 953.8 keV, respectively. We used 3 HPGe detectors with counting efficiencies of 20–25% and FWHM 1.8 keV for a peak60Co of 1332 keV. The measurement time for each sample was 259,200–345,600 s. Canberra type GX 2018, Canberra type GC 2020 and Ortex type GMX 25P4-76 gamma spectrometers were used. The measurement method included detector calibration, the determination of the detector counting efficiency, the cumulative counts of the samples and background at regular intervals, smoothing of the photopeak and linear regres-sion. MDA (Bq/kg) is commonly used to evaluate the measurement
sensitivity and limit detection concentrations of radiocesium, MDA (Bq/kg). The MDA calculation is derived from the following formula
MDA¼2:71þ4:65 ffiffiffi B p
tmEY ; ð1Þ
whereBis background count at the peak energy of interest,tis the counting time (s), m is the sample mass,Eis the detector efficiency
at the energy and geometry of interest, andYis the effective yield at the energy. All reported activities were decay-corrected to the year 2012 using a half-life of 30.07 years.
3. Results and discussion
Atmospheric and coastal waters of the NW Pacific Ocean received large quantities of radioactive materials that were released from the nuclear accident at the Fukushima Dai-ichi nuclear power plant (NPP). Furthermore, the contaminated water that was directly discharged into the marine environment resulted in significantly elevated radionuclide concentrations in the coastal seawater (Povinec et al., 2013). The dissolved radionuclides, such as radiocesium (137Cs or134Cs) can be transported by tidal currents, wind-driven or by dispersion. Most of the radiocesium remains in the surface or near-surface layers and its concentration decreases considerably with depth beginning at approximately 1000 m (Duran et al., 2004). Seawater that contains radioactive materials was transported by the Kuroshio current from the eastern coast of Japan to the north and entered the Pacific Ocean (Maderich et al., 2013).You et al. (2005)explained that the Kuroshio branch within the East/Japan sea transports North Pacific Intermediate Water (NPIW). Therefore, the global ocean circulation is affected by the Mindanao Current and the Indonesian Through Flow (ITF). The upper thermocline of the North Pacific water is a major part of the ITF that is transported from the Mindanao Current into the Indonesian Sea through the Makassar Strait (Ding et al., 2013; Sprintall et al., 2009). Seawater from ITF that enters into Indone-sian marine water area could distribute137Cs from the Fukushima release.
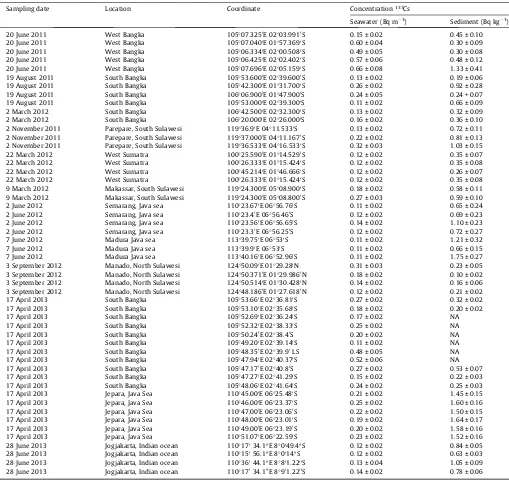
The 137Cs concentrations that were observed in the surface waters and sediments on some Indonesian coasts that have been monitored in the west and east are presented in Table 1. As
observed fromTable 1, the western and eastern coasts of Indonesia have been monitored in South and North Sulawesi. These monitor-ing areas are part of the Makassar Strait. Samplmonitor-ing at the Parepare coast in southern Sulawesi (119°E) was performed on November
2011. The137Cs concentrations in the seawater and sediments in these areas were 0.13–0.32 Bq m3and 0.72–1.03 Bq kg1, respec-tively. Sampling at Makasar-South Sulawesi (119°E) and Manado in
northern Sulawesi (124°E) was performed in March 2012. The
137Cs concentrations in the seawater and sediments in these areas
were 0.12–0.31 Bq m3 and 0.10–0.59 Bq kg1, respectively. In contrast, the MDA of both137Cs and134Cs were 0.03 Bq m3. All monitoring activities (November 2011 and March 2012) in these study areas were performed during a period of northwest mon-soons, when the wind pushes down the warm seawater from the Pacific Ocean to the Indian Ocean.Sprintall et al. (2009)described that the Makassar strait received upper thermocline through
surface waters from the western route of the North Pacific that passed through the Sulawesi Sea. There are 680 m deep Dewakang sills within the Makassar strait that only allow the upper thermo-cline water to enter the Banda sea via the eastward flow of the Flo-res sea, or flows to the shallow (300 m) Lombok Strait before exiting the Indian Ocean. At the ‘‘eastern’’ route, smaller contribu-tions of the North Pacific surface water flow to the Maluku Sea and over the deeper (1940 m) sill of the Lifamatola Strait before enter-ing the Banda Sea (Sprintall et al., 2009). Fukushima-derived radi-ocesium can be estimated by the presence of 134Cs because this radionuclide provides information that can be used to estimate the Fukushima-derived radiocesium (Povinec et al., 2013). In this case,134Cs was not detected in the seawater or sediments in these areas.
As shown inTable 1, monitoring in western Indonesia covered West Sumatra (100°E), Bangka Island (105°E), North Java
Table 1
The concentration of137Cs in marine surface water and marine sediment at some Indonesia coastal (western to eastern).
Sampling date Location Coordinate Concentration137Cs
Seawater (Bq m3) Sediment (Bq kg1)
20 June 2011 West Bangka 105°07.3250E 02°03.9910S 0.15 ± 0.02 0.45 ± 0.10
20 June 2011 West Bangka 105°07.0400E 01°57.3690S 0.60 ± 0.04 0.30 ± 0.09
20 June 2011 West Bangka 105°06.3340E 02°00.5080S 0.49 ± 0.05 0.30 ± 0.08
20 June 2011 West Bangka 105°06.4250E 02°02.4020S 0.57 ± 0.06 0.48 ± 0.12
20 June 2011 West Bangka 105°07.6960E 02°05.1590S 0.66 ± 0.08 1.33 ± 0.41
19 August 2011 South Bangka 105°53.6000E 02°39.6000S 0.13 ± 0.02 0.19 ± 0.06
19 August 2011 South Bangka 105°42.3000E 01°31.7000S 0.26 ± 0.02 0.92 ± 0.28
19 August 2011 South Bangka 106°06.9000E 01°47.9000S 0.24 ± 0.05 0.24 + 0.07
19 August 2011 South Bangka 105°53.0000E 02°39.3000S 0.11 ± 0.02 0.66 ± 0.09
2 March 2012 South Bangka 106°42.5000E 02°32.3000S 0.13 ± 0.02 0.32 ± 0.09
2 March 2012 South Bangka 106°20.0000E 02°26.0000S 0.16 ± 0.02 0.36 ± 0.10
2 November 2011 Parepare, South Sulawesi 119°36.90E 04°11.5330S 0.13 ± 0.02 0.72 ± 0.11 2 November 2011 Parepare, South Sulawesi 119°37.0000E 04°11.1670S 0.22 ± 0.02 0.81 ± 0.13 2 November 2011 Parepare, South Sulawesi 119°36.5330E 04°16.5330S 0.32 ± 0.03 1.03 ± 0.15
22 March 2012 West Sumatra 100°25.5900E 01°14.5290S 0.12 ± 0.02 0.35 ± 0.07
22 March 2012 West Sumatra 100°26.3330E 01°15.4240S 0.12 ± 0.02 0.35 ± 0.08
22 March 2012 West Sumatra 100°45.2140E 01°46.6660S 0.12 ± 0.02 0.26 ± 0.07
22 March 2012 West Sumatra 100°26.3330E 01°15.4240S 0.12 ± 0.02 0.35 ± 0.08
9 March 2012 Makassar, South Sulawesi 119°24.3000E 05°08.9000S 0.18 ± 0.02 0.58 ± 0.11 9 March 2012 Makassar, South Sulawesi 119°24.3000E 05°08.8000S 0.27 ± 0.03 0.59 ± 0.10
2 June 2012 Semarang, Java sea 110°23.670E 06°56.760S 0.11 ± 0.02 0.65 ± 0.24
2 June 2012 Semarang, Java sea 110°23.40E 06°56.460S 0.12 ± 0.02 0.69 ± 0.23
2 June 2012 Semarang, Java sea 110°23.560E 06°56.650S 0.14 ± 0.02 1.10 ± 0.23
2 June 2012 Semarang, Java sea 110°23.30E 06°56.250S 0.12 ± 0.02 0.72 ± 0.27
7 June 2012 Madura Java sea 113°39.750E 06°530S 0.11 ± 0.02 1.21 ± 0.32
7 June 2012 Madura Java sea 113°39.90E 06°530S 0.11 ± 0.02 0.66 ± 0.15
7 June 2012 Madura Java sea 113°40.160E 06°52.960S 0.11 ± 0.02 1.75 ± 0.27
3 September 2012 Manado, North Sulawesi 124°50.090E 01°29.280N 0.31 ± 0.03 0.23 ± 0.05 3 September 2012 Manado, North Sulawesi 124°50.3710E 01°29.9860N 0.18 ± 0.02 0.10 ± 0.02 3 September 2012 Manado, North Sulawesi 124°50.5140E 01°30.4280N 0.14 ± 0.02 0.16 ± 0.06
3 September 2012 Manado, North Sulawesi 124°48.1860E 01°27.6180N 0.12 ± 0.02 0.21 ± 0.02
17 April 2013 South Bangka 105°53.660E 02°36.810S 0.27 ± 0.02 0.32 ± 0.02
17 April 2013 South Bangka 105°53.100E 02°35.680S 0.18 ± 0.02 0.20 ± 0.02
17 April 2013 South Bangka 105°52.690E 02°36.240S 0.17 ± 0.02 NA
17 April 2013 South Bangka 105°52.320E 02°38.330S 0.25 ± 0.02 NA
17 April 2013 South Bangka 105°50.240E 02°38.40S 0.20 ± 0.02 NA
17 April 2013 South Bangka 105°49.200E 02°39.140S 0.11 ± 0.02 NA
17 April 2013 South Bangka 105°48.350E 02°39.90LS 0.48 ± 0.05 NA
17 April 2013 South Bangka 105°47.940E 02°40.370S 0.52 ± 0.06 NA
17 April 2013 South Bangka 105°47.170E 02°40.80S 0.27 ± 0.02 0.53 ± 0.07
17 April 2013 South Bangka 105°47.270E 02°41.290S 0.15 ± 0.02 0.22 ± 0.03
17 April 2013 South Bangka 105°48.060E 02°41.640S 0.24 ± 0.02 0.25 ± 0.03
17 April 2013 Jepara, Java Sea 110°45.000E 06°25.480S 0.21 ± 0.02 1.45 ± 0.15
17 April 2013 Jepara, Java Sea 110°46.000E 06°23.370S 0.25 ± 0.02 1.60 ± 0.16
17 April 2013 Jepara, Java Sea 110°47.000E 06°23.060S 0.22 ± 0.02 1.50 ± 0.15
17 April 2013 Jepara, Java Sea 110°48.000E 06°23.010S 0.19 ± 0.02 1.64 ± 0.17
17 April 2013 Jepara, Java Sea 110°49.000E 06°23.190S 0.20 ± 0.02 1.58 ± 0.16
17 April 2013 Jepara, Java Sea 110°51.070E 06°22.590S 0.23 ± 0.02 1.52 ± 0.16
28 June 2013 Jogjakarta, Indian ocean 110°17034.100E 8°0049.400S 0.12 ± 0.02 0.84 ± 0.05 28 June 2013 Jogjakarta, Indian ocean 110°15056.100E 8°001400S 0.12 ± 0.02 0.63 ± 0.03 28 June 2013 Jogjakarta, Indian ocean 110°36044.100E 8°801.2200S 0.13 ± 0.04 1.05 ± 0.09
28 June 2013 Jogjakarta, Indian ocean 110°17034.100E 8°901.2200S 0.14 ± 0.02 0.78 ± 0.06
NA: Not analysis.
(Semarang, Jepara, 110°E), the coast of the Indian Ocean – South
Java (Yogyakarta, 110°E) and Madura (113°E). We choose these
locations because they were all potentially impacted by the Fuku-shima Accident. Within the North Pacific, Kuroshio is the main western boundary current that flows into the Luzon Strait to the east and connects with the South China Sea (SCS) water. The Kari-mata, Gaspar and Bangka Straits and the Java Sea are connected with the SCS in the south (You et al., 2005). In contrast, West Sumatra and South Java are part of the Indian ocean. Along the southern shorelines of Java and Sumatra, currents are guided by the Indian Ocean waves. In addition, along the west coasts of New Guinea and Australia, the currents are guided by the Pacific Ocean waves. These processes are evident when considering the continuous regions with high correlations between the upper layer and the total transport (Potemra, 2005). Furthermore, Java seawa-ter is originally transported from the west (South China Sea) and east (oceanic). Seasonal mass water movement in the Java Sea is related to the adjacent waters, such as the Flores Sea, South China Sea and Karimata Strait. The southeast monsoon water, with lower temperatures and more saline water, flows from the Flores Sea to the Java Sea. This saline water continuously passes through the Java Sea and the lower salinity water is not completely replaced by the current. Consequently, the higher density mass water will penetrate the Java Sea during this period. During the northwest monsoon, these phenomena are reverse and the less saline water from the West Java Sea is transported to the east. The salinity and density in the Java Sea are relatively lower (Sprintall et al., 2009; Duran et al., 2004; Qu et al., 2005).
Sampling at West Sumatra (100°E) was performed in March
2012. The results of this analysis indicated that the137Cs concen-trations in the seawater and sediments were 0.12 Bq m3 and 0.26–0.35 Bq kg1, respectively. In contrast, hand sampling at South Java (110°E) was performed on June 2013, and the result
of the analysis indicated that the concentrations were 0.12– 0.14 Bq m3 (sea water) and 0.63–1.05 Bq kg1. The data from South Java and West Sumatra were comparable and 134Cs was not detected at either location.
First, sampling at Bangka Strait was performed in June 2011 (West Bangka) and August 2011 (South Bangka). Sampling was conducted during the period of the southeast monsoon. The137Cs concentrations in the seawater and sediments on the coast of the West Bangka Strait were 0.15–0.66 Bq m3and 0.19–1.33 Bq kg1, respectively. On other hand, in South Bangka, the137Cs concentra-tions in the seawater and sediments were 0.11–0.26 Bq m3 and 0.19–0.92 Bq kg1, respectively. The second sampling was per-formed in March 2012 in South Bangka. This sampling time occurred during the period of the northwest monsoon. The137Cs concentration in the seawater and sediments along the coast of
the South Bangka Strait were 0.13–0.16 Bq m3 and 0.32–
0.36 Bq kg1, respectively. The third sampling was performed in April 2013 at South Bangka. This sampling was conducted during the period of the transition monsoon. The137Cs concentrations in the seawater and sediments on the coast of the South Bangka Strait were 0.16–0.27 Bq m3and 0.22–0.36 Bq kg1, respectively. All of the data from the monsoon period were comparable, and 134Cs was not detected in either the seawater or sediments. The Java Sea (north of Java Island, 110°E) was monitored in June 2012 and
April 2013. Both of these sampling periods occurred during the period of the southeast monsoon. The137Cs concentrations in the
seawater and sediments were 0.11–0.25 Bq m3 and 0.65–
1.64 Bq kg1, respectively.
Generally the 137Cs concentrations on the Indonesian coast (100°–124°E) were not directly affected by the Fukushima accident
because134Cs was not detected in all of the sampling areas. Indo-nesian marine water originates from the Pacific Ocean. On other hand, the highest deposition of global fallout radionuclides into
the ocean occurred in the Pacific Ocean (Povinec et al., 2013). Therefore, the radiocesium in the seawater will be detected for many years in this area. In addition, the 137Cs concentration in the surface seawater of the Pacific Ocean was 1–2 Bq m3 just before the FNPP1 accident, which is now incorporated with the Fukushima-derived137Cs (Bailly du Bois et al., 2011;Kumamoto
et al., 2013). Similar quantities of134Cs were released from Fuku-shima and behave as137Cs. Therefore, this 134Cs can be used as an indicator of late contamination (Steinhauser et al., 2014). The radioactive decay half times of137Cs and 134Cs are different (20 and 30 years, respectively), and could be used to quantify the involvement of the Fukushima releases in the North Pacific surface waters by time labeling according to the water masses (Bailly du Bois et al., 2011). Water penetration in the North Pacific before June 2011 had an activity ratio of134Cs/137Cs in the seawater sam-ples that were close to 1, which undoubtedly indicated that the source of these radionuclides was the Fukushima accident (Povinec et al., 2013).Inoue et al. (2012)reported that the seawater that was taken from the southwestern Okhotsk Sea in Japan and the eastern region of the East China Sea have a134Cs/137Cs activity ratio of approximately 1. The same result was reported by
Kaeriyama et al. (2013), who indicated that most surface seawaters in the western and central portions of the North Pacific had 134Cs/137Cs activity ratios of approximately 1 after the Fukushima
accident.
Relative to the data in South and East Asia, the result fromWo and Ahmad (2004) indicated that the 137Cs concentrations in Malaysia were uniformly distributed from 2.33 to 5.00 Bq m3 and from 1.76 to 4.76 Bq m3 in the South China Sea and the Malacca Strait, respectively. The decay correction in 2014 indicated that the137Cs concentrations in the Malaysian marine area remain greater than our measurements.Kameník et al. (2013)reported that the average137Cs concentration on Aloha Hawaii after the Fukushima accident was 1.46 ± 0.06 Bq m3. Furthermore, the 137Cs concentration in the Hawaii surface water (depth 24 m)
was 1.53 ± 0.08 Bq m3.Sartandel et al. (2011) reported that the 137Cs concentrations in the Coastal Marine environment of the
Arabian sea were 0.71–0.91 Bq m3. Compared with the Hawaiian and Arabian Seas, the 137Cs concentrations in the Indonesian coastal waters were very low. Unfortunately, no recent adequate 137Cs data are available for Indonesia’s marine environment before
the Fukushima accident.Suseno and Umbara (2006)reported that the137Cs concentration in the marine surface water from Muria Peninsula Jepara was 1.34 Bq m3.
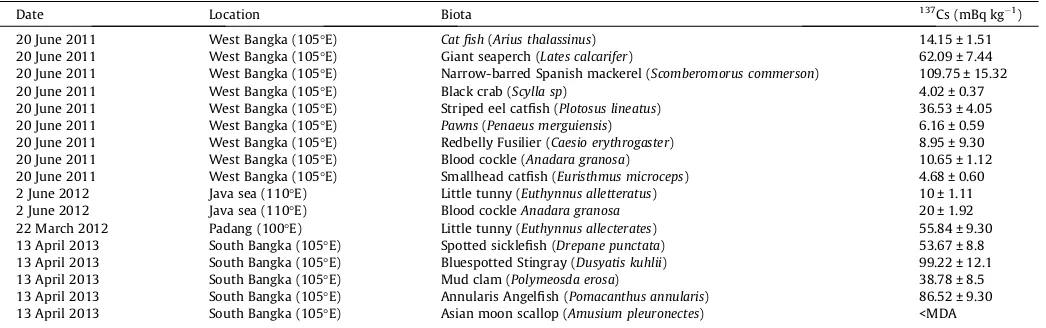
Radionuclides can accumulate in marine biota through aqueous and dietary exposure routes. Fish are a major source of nutrition and protein and are a potential carrier of radionuclides from aqua-tic environments to humans. Radiocesium can be concentrated in skeletal muscle; therefore fish from contaminated areas are an important pathway for human exposure (Malek et al., 2004). Some bivalve species, such as Anadara granosa (blood cockle), Asian moon scallop, and mud clam, are consumed as seafood in Indone-sia. In addition, hand bivalves can accumulate multifarious con-taminant and are resistant to contamination (O’Connor, 2002).
concentrations were very low, which indicated limited accumula-tion in the species studied. However, the137Cs appeared to be more available to Scomberomorus commerson, Dasyatis kuhlii and
Pomacanthus annularis, with mean concentrations of 109.75, 99.22 and 86.52 mBq kg1, respectively. Generally, the137Cs con-centrations that were found in fish from some Indonesian coasts were <MDA – 109.75 mBq kg1. On other hand, the137Cs concen-trations found in mollusk, crab and prawn were 10.65–38.78, 4.02 and 6.16 mBq kg1, respectively.
4. Conclusions
On the eastern coasts of South and North Sulawesi, the 137Cs concentrations in the seawater and sediments were 0.12– 0.32 Bq m3and 0.10–1.03 Bq kg1, respectively. On the western coasts of West Sumatra, Bangka Island, North Java, South Java and Madura Island, the137Cs concentrations in the seawater and sediments were 0.12–0.66 Bq m3and 0.19–1.64 Bq kg1, respec-tively. In general, the137Cs concentrations that were found in fish from some Indonesia coasts were <MDA – 109.75 Bq kg1. In con-trast, the137Cs concentrations in mollusk, crab and prawn were 10.65–38.78, 4.02 and 6.16 mBq kg1 respectively. Furthermore, 134Cs was not detected in the seawater, sediment or biota samples.
Compared with other Asia Pacific regions, such as Hawaii and India, the concentrations of137Cs in the Indonesian coastal waters were very low. The Indonesian marine waters originated from the Pacific Ocean. Consequently, the ratio of134Cs/137Cs should be the same as that of the Pacific Ocean. Soon after the F1-NPP accident, no 134Cs was detected in samples that were collected from two locations in Hawaii (Pacific Ocean) between March 2011 and February 2013 (Kameník et al., 2013). Furthermore, the ratios of 134Cs/137Cs in the seawater from Japan and Hawaii were >1, which
indicated these areas were influenced by global fallout. Based on these data, the137Cs on the eastern and western Indonesian coasts originated from global fallout.
Acknowledgements
This work was supported by the Competitive Research Incen-tive Program (SINAS) 2011–2012 – The Indonesia Ministry Research and Technology.
References
Bailly du Bois, P., Laguionie, P., Boust, D., Korsakissok, I., Didier, D., Fiévet, B., 2011. Estimation of marine source-term following Fukushima Dai-ichi accident. J. Environ. Radioact. doi: 10.1016/j.jenvrad. 2011.11.015.
Bu, W.T., Zheng, J., Aono, T., Tagami, K., Uchida, S., Zhang, J., Honda, M.C., Guo, Q.J., Yamada, M., 2013. Vertical distributions of plutonium isotopes in marine sediment cores of the Fukushima coast after the Fukushima Dai-ichi Nuclear Power Plant accident. Biogeoscience 10, 2497–2511.
Ding, X., Bassinot, F., Guichard, F., Fang, N.Q., 2013. Indonesian Throughflow and monsoon activity records in the Timor Sea since the last glacial maximum. Mar. Micropaleontol. 101, 115–126. <http://dx.doi.org/10.1016/j.marmicro.2013.02.003>. Duran, E.B., Povinec, P.P., Fowler, S.W., Airey, P.L., Hong, G.H., 2004.137Cs and 239/240Pu levels in the Asia-Pacific regional seas. J. Environ. Radioact. 76,
139–160.http://dx.doi.org/10.1016/j.jenvrad.2004.03.023.
Inoue, M., Kofuji, H., Nagao, S., Yamamoto, M., Hamajima, Y., Fujimoto, K., Yoshida, K., Suzuki, A., Takashiro, H., Hayakawa, K., Hamataka, K., Yoshida, S., Kunugi, M., Minakawa, M., 2012. Low levels of134Cs and137Cs in surface seawaters around the Japanese Archipelago after the Fukushima Dai-ichi Nuclear Power Plant accident in 2011. Geochem. J. 46, 311–320.
Kaeriyama, H., Ambe, D., Shimizu, Y., Fujimoto, K., Ono, T., Yonezaki, S., Kato, Y., Matsunaga, H., Minami, H., Nakatsuka, S., Watanabe, T., 2013. Direct observation of 134Cs and137Cs in surface seawater in the western and central North Pacific after the Fukushima Dai-ichi nuclear power plant accident. Biogeosciences 10, 4287–4295.
Kameník, J., Dulaiova, H., Buesseler, K.O., Pike, S.M., Štastná, K., 2013. Cesium-134 and 137 activities in the central North Pacific Ocean after the Fukushima Dai-ichi Nuclear Power Plant accident. Biogeoscience 1, 6045–6052.
Kumamoto, Y., Murata, A., Kawano, T., Aoyama, M., 2013. Fukushima-derived radiocesium in the northwestern Pacific Ocean in February 2012. Appl. Rad. Isotopes 81, 335–339. <http://dx.doi.org/10.1016/j.apradiso.2013.03.085>. Maderich, V., Bezhenar, R., Heling, R., de With, G., Jung, K.T., Myoung, J.G., Cho, Y.-K.,
Qiao, F., Robertson, R., 2013. Regional long-term model of radioactivity dispersion and fate in the Northwestern Pacific and adjacent seas: application to the Fukushima Dai-ichi accident. J. Environ. Radioact. 131, 4–18, <http:// dx.doi.org/10.1016/j.jenvrad.2013.09.009>.
Malek, M.A., Nakahara, M., Nakamura, R., 2004. Uptake, retention and organ/tissue distribution of137Cs By Japanese Catfish (Silurus Asotus Linnaeus). J. Environ.
Radioact. 77, 191–204.http://dx.doi.org/10.1016/j.jenvrad.2004.03.006. O’Connor, T.P., 2002. National Distribution of Chemical Concentrations in Mussels
and Oysters in the USA. Marine Environmental Research 53, 117–143. <http:// dx.doi.org/10.1016/S0141-1136(01)00116-7>.
Potemra, J.T., 2005. Indonesian throughflow transport variability estimated from satellite. Altimetrytroceanography 18 (4), 98–107.
Povinec, P.P., Hirose, K., Honda, T., Ito, T., Scott, E.M., Togawa, O., 2004. Spatial distribution of3H, 90Sr,137Cs and239,240Pu in surface waters of the Pacific and
Indian Oceans – GLOMARD database. J. Environ. Radioact. 7, 113–137.http:// dx.doi.org/10.1016/j.jenvrad.2004.03.022.
Povinec, P.P., Aoyama, M., Biddulph, D., Breier, R., Buesseler, K., Chang, C.C., Golser, R., Hou, X.L., Jeskovsk’y, M., Jull, A.J.T., Kaizer, J., Nakano, M., Nies, H., Palcsu, L., Papp, L., Pham, M.K., Steier, P., Zhang, L.Y., 2013. Cesium, iodine and tritium in NW Pacific waters – a comparison of the Fukushima impact with global fallout. Biogeoscience 10, 5481–5496.
Qu, T., Du, Y., Strachan, J., Meyer, G., Lingo, J., 2005. Sea surface temperature and its variability in the indonesian region. Oceanography 18 (4), 50–61.
Sartandel, S.J., Jha, S.K., Puranik, V.D., 2011. Constrains in gamma spectrometry analysis of fallout137Cs in coastal marine environment of Arabian sea in India. J.
Radioanal. Nucl. Chem..http://dx.doi.org/10.1007/s10967-011-1538. Sprintall, J., Wijffels, S.E., Molcard, R., Jaya, I., 2009. Direct estimates of the
Indonesian Throughflow entering the Indian Ocean: 2004–2006. J. Geophys. Res. 114, C07001.http://dx.doi.org/10.1029/2008JC005257.
Steinhauser, G., Brandl, A., Johnson, T.E., 2014. Comparison of the Chernobyl and Fukushima nuclear accidents: a review of the environmental impacts. Sci. Total Environ. 470–471, 800–817. <http://dx.doi.org/10.1016/j.scitotenv.2013.10.029>. Suseno, H., Umbara ,H., 2006. Determination Natural And Anthropogenic Radionuclides In Muria Peninsula. Proceeding Seminar of Nuclear Safety – Nuclear Energy Regulatory Energy. Jakarta – Indonesia (in Indonesia).
Table 2
Concentration137Cs in marine biota.
Date Location Biota 137Cs (mBq kg1)
20 June 2011 West Bangka (105°E) Cat fish(Arius thalassinus) 14.15 ± 1.51
20 June 2011 West Bangka (105°E) Giant seaperch (Lates calcarifer) 62.09 ± 7.44
20 June 2011 West Bangka (105°E) Narrow-barred Spanish mackerel (Scomberomorus commerson) 109.75 ± 15.32
20 June 2011 West Bangka (105°E) Black crab (Scylla sp) 4.02 ± 0.37
20 June 2011 West Bangka (105°E) Striped eel catfish (Plotosus lineatus) 36.53 ± 4.05
20 June 2011 West Bangka (105°E) Pawns(Penaeus merguiensis) 6.16 ± 0.59
20 June 2011 West Bangka (105°E) Redbelly Fusilier (Caesio erythrogaster) 8.95 ± 9.30
20 June 2011 West Bangka (105°E) Blood cockle (Anadara granosa) 10.65 ± 1.12
20 June 2011 West Bangka (105°E) Smallhead catfish (Euristhmus microceps) 4.68 ± 0.60
2 June 2012 Java sea (110°E) Little tunny (Euthynnus alletteratus) 10 ± 1.11
2 June 2012 Java sea (110°E) Blood cockleAnadara granosa 20 ± 1.92
22 March 2012 Padang (100°E) Little tunny (Euthynnus allecterates) 55.84 ± 9.30
13 April 2013 South Bangka (105°E) Spotted sicklefish (Drepane punctata) 53.67 ± 8.8
13 April 2013 South Bangka (105°E) Bluespotted Stingray (Dusyatis kuhlii) 99.22 ± 12.1
13 April 2013 South Bangka (105°E) Mud clam (Polymeosda erosa) 38.78 ± 8.5
13 April 2013 South Bangka (105°E) Annularis Angelfish (Pomacanthus annularis) 86.52 ± 9.30 13 April 2013 South Bangka (105°E) Asian moon scallop (Amusium pleuronectes) <MDA
Tsumune, D., Tsubono, T., Aoyama, M., Hirose, K., 2012. Distribution of oceanic137Cs
from the Fukushima Dai-ichi nuclear power plant simulated numerically by a regional ocean model. J. Environ. Radioact. 111, 100–108. <http://dx.doi.org/ 10.1016/j.jenvrad.2011.10.007>.
Wo, Y.M., Ahmad, Z., 2004. Determination Of 137Cs In Seawater surrounding peninsular Malaysia – a case study. J. Nucl. Related Technol. 1, 19–28.
You, Y., Chern, C.-S., Yang, Y., Liu, C.-T., Liu, K.-K., Pai, S.-C., 2005. The South China Sea, A Cul-De-Sac Of North Pacific Intermediate Water. J. Oceanography 61, 509–527.
Zalewskam, T., Suplin’ska, M., 2012. Fish pollution with anthropogenic137Cs in the