Full Terms & Conditions of access and use can be found at
http://www.tandfonline.com/action/journalInformation?journalCode=tcem20
Download by: [NATIONAL TAIWAN UNIVERSITY OF SCIENCE AND TECHNOLOGY], [Doddy Prayogo] Date: 11 November 2015, At: 00:51
Journal of Civil Engineering and Management
ISSN: 1392-3730 (Print) 1822-3605 (Online) Journal homepage: http://www.tandfonline.com/loi/tcem20
Predicting productivity loss caused by change
orders using the evolutionary fuzzy support vector
machine inference model
Min-Yuan Cheng, Dedy Kurniawan Wibowo, Doddy Prayogo & Andreas F. V.
Roy
To cite this article: Min-Yuan Cheng, Dedy Kurniawan Wibowo, Doddy Prayogo & Andreas F. V. Roy (2015) Predicting productivity loss caused by change orders using the evolutionary fuzzy support vector machine inference model, Journal of Civil Engineering and Management, 21:7, 881-892, DOI: 10.3846/13923730.2014.893922
To link to this article: http://dx.doi.org/10.3846/13923730.2014.893922
Published online: 10 Jul 2015.
Submit your article to this journal
Article views: 41
View related articles
ISSN 1392-3730 / eISSN 1822-3605
2015 Volume 21(7): 881–892
doi:10.3846/13923730.2014.893922
PREDICTING PRODUCTIVITY LOSS CAUSED BY CHANGE ORDERS
USING THE EVOLUTIONARY FUZZY SUPPORT VECTOR MACHINE
INFERENCE MODEL
Min-Yuan CHENGa, Dedy Kurniawan WIBOWOa, b, Doddy PRAYOGOa, Andreas F. V. ROYc
aDepartment of Civil and Construction Engineering, National Taiwan University of Science and Technology,
#43, Sec. 4, Keelung Rd., Taipei, Taiwan, R. O.C.
bDepartment of Civil Engineering, Sepuluh Nopember Institute of Technology, Nopember, Indonesia cDepartment of Civil Engineering, Faculty of Engineering, Parahyangan Catholic University,
Jalan Ciumbuleuit 94, Bandung, 40141 West Java, Indonesia
Received 07 Dec 2012; accepted 19 Feb 2013
Abstract. Change orders in construction projects are very common and result in negative impacts on various project facets. The impact of change orders on labor productivity is particularly difficult to quantify. Traditional approaches are inadequate to calculate the complex input-output relationship necessary to measure the effect of change orders. This study develops the Evolutionary Fuzzy Support Vector Machines Inference Model (EFSIM) to more accurately predict change-order-related productivity losses. The EFSIM is an AI-based tool that combines fuzzy logic (FL), support vector machine (SVM), and fast messy genetic algorithm (fmGA). The SVM is utilized as a supervised learning technique to solve classification and regression problems; the FL is used to quantify vagueness and uncertainty; and the fmGA is ap -plied to optimize model parameters. A case study is presented to demonstrate and validate EFSIM performance. Simula-tion results and our validaSimula-tion against previous studies demonstrate that the EFSIM predicts the impact of change orders significantly better than other AI-based tools including the artificial neural network (ANN), support vector machine (SVM), and evolutionary support vector machine inference model (ESIM).
Keywords: change orders, productivity loss, fuzzy logic, support vector machine, fast messy genetic algorithm.
Corresponding author: Doddy Prayogo E-mail: [email protected]
881 Copyright © 2015 Vilnius Gediminas Technical University (VGTU) Press www.tandfonline.com/tcem
Introduction
Changes during construction projects are very common,
making construction one of the most complex industries.
Changes can involve adding to or reducing the scope
of project work or correcting or modifying an original
design. Change orders in the construction industry have
negative effects in aspects such as cost, quality, time, and
organization. While most change order items (e.g.
mate-rial, scheduling, rework, equipment) can be relatively easy to measure, quantifying the impact on labor produc -tivity is typically more complicated (Hanna et al. 1999a).
Many studies have reported on the impact of change orders on labor productivity. The methods used in the literature to calculate productivity loss can be grouped into the 3 categories of (1) regression analysis (Leonard 1988; Moselhi et al. 1991; Ibbs 2005), (2) artificial neural
network (ANN) (Moselhi et al. 2005), and (3) statistical-fuzzy (Hanna et al. 2002). Previous studies (Hanna et al. 2002; Moselhi et al. 2005) have reported that ANN and statistical-fuzzy methods outperform regression analy-sis. However, no method is suitable for calculating
productivity loss because prediction accuracies are out-side of acceptable limits.
Construction projects are complex undertakings full
of uncertainty and vagueness. Developing a determin-istic mathematical model to predict productivity loss is
difficult and expensive. An inference model (Cheng, Wu
2009) offering high accuracy and low cost is one fea-sible approach to predicting productivity loss. Inference models derive new facts from historical data. The human brain can learn previous information and deduce new
facts from that information. Artificial intelligence (AI)
can be employed to develop models that simulate human brain functions. AI is concerned with computer systems
able to handle complex problems using techniques such as Artificial Neural Network (ANN), Support Vector
Machine (SVM), and Fuzzy Logic (FL). AI-based infer-ence models thus offer a promising solution to predicting productivity loss.
Several AI hybrid systems have been developed in recent years that have solved various construction man-agement problems (Cheng, Wu 2009; Cheng, Roy 2010).
In an AI hybrid system, fusing different AI techniques can achieve better results than a single AI technique because the advantages of one technique can compen -sate for another’s disadvantages (Cheng, Wu 2009). The Evolutionary Fuzzy Support Vector Machine Inference Model (EFSIM) (Cheng, Roy 2010) was proposed to further improve prediction accuracy. EFSIM is an
arti-ficial intelligence (AI) hybrid system that fuses fuzzy
logic (FL), support vector machine (SVM), and fast messy genetic algorithm (fmGA). In EFSIM, FL deals with vagueness and uncertainty; SVM acts as a
super-vised learning tool; and fmGA works to optimize FL and SVM parameters. EFSIM significantly reduces the level
of human intervention and can be used by professionals
who do not have background in AI (Cheng, Roy 2010).
The objective of this research is to use EFSIM to predict productivity loss caused by change orders. Fea-sibility and capability of the proposed method are evalu-ated and compared with other methods, including ANN, SVM, and ESIM (Cheng, Wu 2009). Validation with pre-vious studies (Moselhi et al. 2005) is also carried out to demonstrate proposed model performance.
1. Literature review
1.1. Productivity loss caused by change orders
Change can be defined as any modification in the original scope, time, or cost of the work (Hester et al. 1991). A change order is issued to formally announce the change and modify the contract between the contractor and owner (Hester et al. 1991). Keane et al. (2010) grouped causes of change into four categories: owner-related, consultant-related, contractor-related, and non-party-related, and effects of change into five categories:
cost-related, quality-related, time-related,
organization-related, other effects (Keane et al. 2010).
Preliminary research into calculating the effects of change orders on labor productivity was accomplished by Leonard (1988). This research attempted to identify the effects of change orders on labor productivity in 90 cases facing change-order-related productivity losses. Results
indicated a significant correlation between change orders
and productivity loss. However, there were limitations to Leonard’s study, including limited number of variables and subjective evaluation (Hanna et al. 1999a, b). This preliminary study motivated other researchers to develop
research in this field further.
Two studies used a statistical method to quantify
the impact of change orders on labor productivity in mechanical and electrical construction projects (Hanna et al. 1999a, b). These studies used the delta method as
an efficiency indicator and regression analysis to ana
-lyze questionnaire data. Hanna et al. (2002) improved
the method by using the statistical-fuzzy technique to quantify the cumulative impact of change orders. Unfor
-tunately, the technique is difficult for stakeholders to
implement due to complicated calculation steps and poor prediction results.
A neural network model (Moselhi et al. 2005) was developed to estimate the impact of change orders on labor productivity, including the timing effect of change orders. Analysis results showed this model estimated the impact of change orders on productivity more accurately than those previously described. However, this method could gain better prediction results by fusing the neural
network model with an AI technique.
1.2. Fuzzy logic (FL)
FL is a popular AI technique invented by Zadeh in the 1960s. FL has been used in forecasting, decision mak -ing, and action control in environments characterized by uncertainty, vagueness, presumptions, or subjectivity (Bojadziev, G., Bojadziev, M. 2007). In general, FL
sys-tems have four major components: fuzzification, fuzzy rule base, inference engine, and defuzzification. Fuzzifi -cation is a process that uses membership functions (MFs) to convert the value of each input variable into a corre-sponding linguistic variable degree. Fuzzy rules repre-sent relations between input and output fuzzy sets and form the basis for fuzzy logic to obtain fuzzy output.
The result of fuzzification, which is used by the inference engine, stimulates the human decision–making process
based on fuzzy implications and available rules. Lastly,
defuzzification reverses the fuzzification process and
converts the fuzzy set into crisp output.
The advantages of FL related to vagueness and uncertainty depend heavily on the appropriate distribution of membership functions (MFs), number of rules, and selection of proper fuzzy set operations. Greater problem
complexity increases the difficulty of MF construction
and rules (Ko 2002). Some researchers have treated this
drawback as an optimization problem because determin
-ing MF configurations and fuzzy rules is complicated and problem-oriented. To overcome such difficulties, some
researchers have tried to fuse FL with AI optimization
techniques such as GA and ant colony (Ishigami et al. 1995; Martinez et al. 2008). These optimization meth-ods have demonstrated their ability to minimize time-consuming operations and reduce the level of human intervention necessary to optimize MFs and fuzzy rules.
1.3. Support vector machine (SVM)
SVM (Vapnik 1995) is an AI paradigm already used in
a wide range of applications. SVM is a learning tool for
solving classification and regression problems. SVM works by plotting input vectors into a higher dimensional feature space. The optimal hyperplane is identified within this feature space with the help of a kernel function, K (xi, xj). A radial basis function (RBF) kernel has been
recommended for general users as a first choice due to
its ability to analyze higher-dimension data, use of only one hyperparameter in searches, and fewer numerical
dif-ficulties (Hsu et al. 2003).
SVM has achieved performance levels compara-ble to or higher than traditional learning tools (Burges
1998; Yongqiao et al. 2005). However, SVM’s generali-zation ability and prediction accuracy are determined by the optimal penalty (C) and kernel (γ) parameters. To
overcome this drawback, an optimization technique (e.g.
fmGA) may be used to identify the optimum values of parameters simultaneously (Cheng, Wu 2009).
1.4. Fast messy genetic algorithm (fmGA)
fmGA is a recently developed machine learning and optimization tool based on a genetic algorithm approach (Goldberg et al. 1993). fmGA is an improvement on messy genetic algorithms (mGAs), which were initially
developed to overcome linkage problems in simple
genetic algorithms (sGAs) resulting from a parameter coding problem that sometimes generates suboptimal
solutions (Deb, Goldberg 1991). Unlike sGAs, which use fixed length strings to represent possible solutions,
fmGA applies messy chromosomes to form strings of
various lengths that can efficiently find optimal solutions
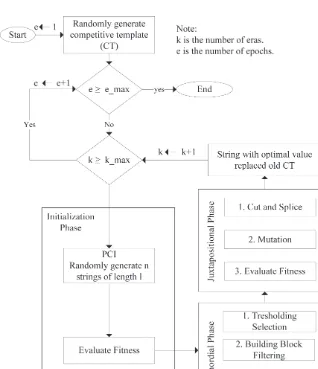
for large-scale permutation problems (Feng, Wu 2006). The fmGA contains two loop types: inner and outer (Fig. 1). The process starts with the outer loop. Firstly,
a competitive template (randomly generated or
problem-specific) is generated. In the inner loop, the fmGA oper -ation is three-phase, including an initializ-ation phase,
primordial phase, and juxtapositional phase. In the initialization phase, an adequately large population con
-tains all possible building blocks (BBs) of order k. fmGA performs the probabilistic complete initialization (PCI) by generating n chromosomes randomly and
evaluat-ing their fitness value. The primordial phase contains
two operations, namely threshold selection and
build-ing-block filtering. In this phase, “bad” genes that do not belong to BBs are filtered out so that, in the end, the result encloses a high proportion of “good” genes belonging to BBs. In the juxtapositional phase, fmGA
operations are similar to sGA operations. The selection
for “good” genes is used together with a cut-and-splice operator to form a high-quality generation that may con
-tain the optimal solution. The next outer loop begins after the respective inner loop is finished. The competi -tive template is replaced by the best solution found so far, which becomes the new competitive template for the
next outer loop. The whole process is performed until the
Fig. 1. Illustration of fmGA
maximum number of eras (kmax) is reached. The fmGA can also be performed over epochs (emax). An epoch is
the complete process between first era and the maxi -mum number of eras (kmax). Epochs can be performed as many times as desired. The algorithm is terminated once a good-enough solution is obtained or no further improvement is made.
2. Evolutionary fuzzy support vector machine inference model
The evolutionary fuzzy support vector machine infer-ence model (EFSIM) is a hybrid AI system developed by Cheng and Roy (2010)that fuses the three different AI
techniques of fuzzy logic (FL), support vector machine
(SVM), and fast messy genetic algorithm (fmGA). In this complementary system, FL deals with vagueness
and approximate reasoning; SVM acts as a supervised
learning tool to handle fuzzy input-output mapping; and
fmGA works to optimize FL and SVM parameters.
In EFSIM, the fuzzy inference engine and fuzzy rules based on the FL system have been replaced by SVM. However, SVM’s generalization ability and prediction accuracy are determined by the optimal penalty (C) and
kernel (γ) parameters. Improper tuning of the parameters
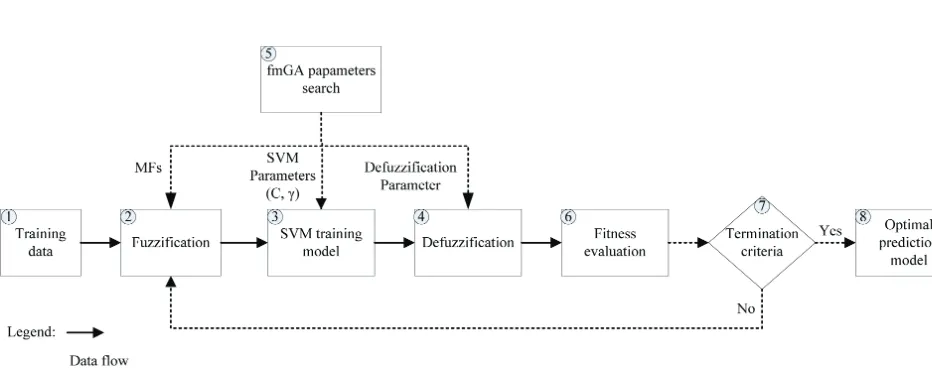
will affect the accuracy of the prediction model. To over-come this shortcoming, EFSIM utilizes fmGA to search simultaneously for optimum SVM parameters and FL parameters. The architecture of EFSIM is shown in Figure 2.
The EFSIM involves eight major steps, beginning with training data and ending with the optimal prediction
model. An explanation of major steps involved in EFSIM
is given below: 1) Training data
Final data for training are obtained from data pre-processing output. Data prepre-processing used in this study included data cleaning, attribute reduction and data trans-formation.
2) Fuzzification
Each normalized input attribute from the previous step is converted into membership grades corresponding
to the specific membership function (MF) set generated
and encoded by fmGA. This model uses trapezoidal and triangular MF shapes (see Fig. 3) that, in general, may be developed by referencing summit points and widths. This study used the Summit and Width Representation Method (SWRM) (Ko 2002) to encode complete MF sets
(Fig. 3 (c)). Figure 4 illustrates the fuzzification process.
3) SVM training model
SVM addresses the complex relationship between fuzzy input and output variables. Fuzzification process
output, in the form of membership grades, is fuzzy input for SVM. SVM trains the dataset to obtain the prediction model, with penalty (C) and kernel (γ) as its parameters, which are randomly generated and encoded by fmGA.
This study used the RBF kernel as a reasonable first
choice (Hsu et al. 2003). 4) Defuzzification
This is a fuzzification reverse process. Once
SVM finishes the training process, output numbers are expressed in terms of a fuzzy set. Output numbers are
then converted into crisp numbers. Employing fmGA,
the model generates a random defuzzification parameter
(dfp) substring and encodes it for conversion into SVM fuzzy output. This evolutionary approach is simple and straightforward, as it uses dfp as a common denominator for SVM output.
5) fmGA parameter search
fmGA is utilized to search simultaneously the fittest
shapes for MFs, dfp, penalty parameter (C), and RBF
kernel parameter (γ). In fmGA, the chromosome that
represents the possible solution for searched parameters consists of four parts: the MFs substring, dfp substring,
penalty parameter substring, and kernel parameter sub -string (Cheng, Roy 2010). The chromosome is encoded into a binary string. Chromosomes consist of two seg-ments: FL and SVM. Figure 5 illustrates the chromosome
Fig. 2. Architecture of EFSIM
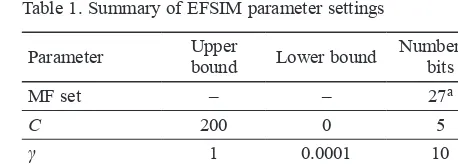
structure. Table 1 summarizes the parameter settings and
number of bits required for the chromosome design. For
more details about fmGA parameter search, readers are
referred to the previous work of Cheng and Wu (2009)
and Cheng and Roy (2010). Fig. 5. EFSIM chromosome structure
Table 1. Summary of EFSIM parameter settings
Parameter Upper
bound Lower bound
Number of bits
MF set – – 27a
C 200 0 5
γ 1 0.0001 10
dfp 1 0.5 9
a Number of bits required for one complete MF set.
6) Fitness evaluation
A fitness function, a function designed to measure
model accuracy and good generalization properties (Ko
2002), is now developed to evaluate fitness value. This function describes the fittest shape of MFs, optimized
dfp number, and SVM parameters. The fitness function consists of parameters to calculate accuracy and model
complexity, as expressed in Eqn (1):
(1)
where caw represents the accuracy weighting coefficient; ser represents the prediction error between actual output Fig. 3. Membership function: trapezoidal (a), triangular (b), complete MF set (c) (Ko 2002)
Fig. 4. Fuzzification process
and desired output; ccw represents the complexity weight
-ing coefficient; and mc represents model complexity,
which can be quantified by counting the number of sup -port vectors.
7) Termination criteria
The process terminates when the termination
crite-rion is satisfied. While still unsatisfied, the model will proceed to the next generation. As EFSIM uses fmGA,
the termination criterion used in this study was either era number (k) or epoch number (e).
8) Optimal prediction model
The loop stops when the termination criterion is
fulfilled. This condition means that the prediction model has identified the input/output mapping relationship with optimal C, γ, and dfp parameters and is ready to predict new facts.
3. Productivity loss prediction using EFSIM
3.1. Historical data
Data used in this research were drawn from 102 cases cited in Assem’s thesis (2000) and covered 33 cases from Assem’s (2000) investigation of the adverse effects of change orders and 69 cases from Leonard’s (1988) inves-tigation of change order impacts. A summary of cases is shown in Table 2.
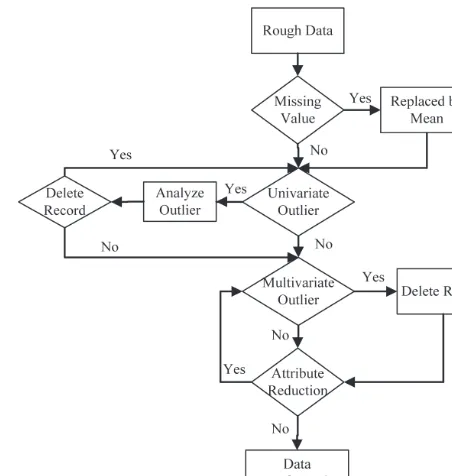
3.2. Data preprocessing
Data preprocessing is an important stage in data
analy-sis that resolves the “unclean” nature of real-world data (Zhang et al. 2003). Several data preprocessing
tech-niques such as data cleaning, attributes reduction, and data
transformation were employed in this study. A systematic
data-preprocessing flowchart (Fig. 6) was developed to
obtain better prediction results. Historical data was
ana-lyzed using this flowchart to obtain training data. Data cleaning can be applied to fill in missing values
and remove noisy data (univariate and multivariate out-liers) (Han, Kamber 2007; Shahi et al. 2009). Attributes reduction was applied to reduce the dimensionality of data attributes and help reduce computational time by eliminat-ing unnecessary attributes. Two methods, correlation anal-ysis (CA) and principal component analanal-ysis (PCA), were employed to compare attributes reduction method results. CA is the simplest way to assess input-output relationships. PCA is used to identify strong predictor variables in a
data-set. Data transformation techniques such as normalization,
where attribute data are scaled to fall within a small
speci-fied range, may improve the accuracy and the efficiency of
mining algorithms involving distance measurements (Han, Kamber 2007; Shahi et al. 2009). The function used to
normalize data in this study is shown in Eqn (2):
, (2)
where: xnorm is the normalized data; xi is the observed data; xmin is the minimum data; and xmax is the maxi -mum data.
3.3. Final data
A total of 96 records were used to train the prediction
model. Two kinds of analyses were done to compare
performance of attribute reduction methods. Analysis 1 used CA to reduce attributes and Analysis 2 used PCA to do the same. As shown in Table 3, CA and PCA
identi-fied 6 and 4 attributes, respectively, as significant factors.
Both analyses transformed the data into values ranging Table 2. Summary cases
Parameter Min Max Mean
Work type (Architectural, Civil, Electrical, Mechanical)
Change orders number 7 2150 106.784 Frequency of change
orders a 0.389 195.454 8.614
Average size of change
orders b 3.214 1595.238 161.964
Change orders hours 100 83000 10528.688
Change orders hours ratio to the planned hours
0.009 2.660 0.323
Change orders hours
ratio to the actual hours 0.006 0.573 0.198
Type of impact (1, 2, or 3)c
a frequency of change order: ratio change orders number to
the actual duration in months;
b average size of change orders: ratio of change orders hours
to the number of change orders;
c 1 represents change-order causes of productivity loss only;
2 or 3 represents change order plus 1 or 2 additional major causes of productivity loss.
Fig. 6. Flowchart of data preprocessing
Table 3. Summary of training data
Analysis 1 (CA) Analysis 2 (PCA)
Work type Work type
Frequency of change orders Type of impact Average size of change
orders
Frequency of change orders
Change order hours Time related
Change order hours ratio to the planned hours
Relative size of change orders
Change order hours ratio to the actual hours
Significant
attribu
tes
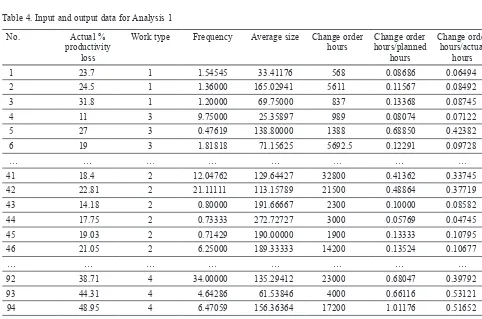
Table 4. Input and output data for Analysis 1
No. Actual %
productivity loss
Work type Frequency Average size Change order hours
1 23.7 1 1.54545 33.41176 568 0.08686 0.06494
2 24.5 1 1.36000 165.02941 5611 0.11567 0.08492
3 31.8 1 1.20000 69.75000 837 0.13368 0.08745
4 11 3 9.75000 25.35897 989 0.08074 0.07122
5 27 3 0.47619 138.80000 1388 0.68850 0.42382
6 19 3 1.81818 71.15625 5692.5 0.12291 0.09728
… … … …
41 18.4 2 12.04762 129.64427 32800 0.41362 0.33745
42 22.81 2 21.11111 113.15789 21500 0.48864 0.37719
43 14.18 2 0.80000 191.66667 2300 0.10000 0.08582
44 17.75 2 0.73333 272.72727 3000 0.05769 0.04745
45 19.03 2 0.71429 190.00000 1900 0.13333 0.10795
46 21.05 2 6.25000 189.33333 14200 0.13524 0.10677
… … … …
92 38.71 4 34.00000 135.29412 23000 0.68047 0.39792
93 44.31 4 4.64286 61.53846 4000 0.66116 0.53121
94 48.95 4 6.47059 156.36364 17200 1.01176 0.51652
95 35.09 4 2.42857 63.23529 4300 0.11406 0.07713
96 45.34 4 2.92857 336.58537 13800 0.31364 0.17143
between 0 and 1. Table 4 shows example input and out -put data from Analysis 1.
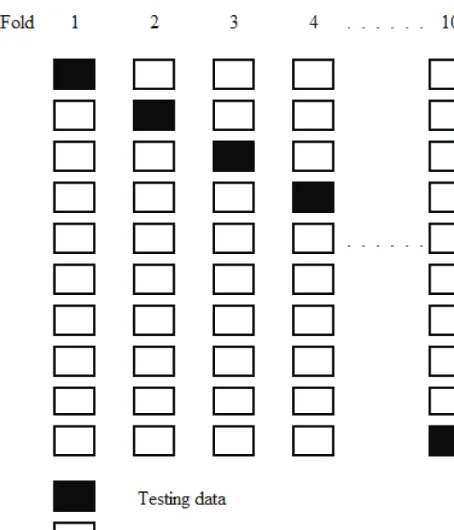
3.4. Cross-validation
Cross-validation is a statistical technique that assesses
how accurately a predictive model will perform by divid-ing data into two segments, of which one is used to learn or train the model and the other is used to test or validate the model. 10-fold cross-validation resulted in the best performance in the simulation (Borra, Di Ciaccio 2010). In 10-fold cross-validation, original data was randomly
portioned into 10 equally (or approximately equally) sized segments. Consequently, 10 independent performance
estimations of training and testing were performed such that, within estimation, a different fold of the data was alternately used for testing while the remaining 9 folds
were used for training (Fig. 7). We then calculated the average of each performance measure to obtain cross-validation accuracy.
3.5. Performance measures
This research used the following four performance meas-ures to evaluate EFSIM:
1. Root mean square error
Root mean square error (RMSE) is the square root of the average squared distance of predicted values by
the model and the observed values. RMSE can be used to calculate the variation of errors in a prediction model and is very useful when large errors are undesirable. The
RMSE is expressed using the following equation:
(3)
where yj is the actual value; is the predicted value; and n is the number of data samples.
2. Mean absolute error
Mean absolute error (MAE) is the average absolute
value of the residual (error). MAE is a quantity used to
measure how close forecasts or predictions are to
even-tual outcomes. The MAE is expressed using the follow
-ing equation:
(4)
3. Mean absolute percentage error
Mean absolute percentage error (MAPE) is a meas-urement of prediction accuracy. It represents prediction percentage error. Small denominators can cause problems in MAPE value because small denominators generate large MAPE values that impact overall value. The MAPE
is expressed using the following equation:
(5)
4. Training time
Training time represents time taken by the proposed
model to train data and obtain the optimum prediction model.
To obtain an overall comparison, a normalized
refer-ence index (RI) (Chou et al. 2011) was created by com-bining the four performance measures (RMSE, MAE, and MAPE, and training time). The RI was obtained by calcu-lating the average of each normalized performance meas-ure. Performance measure values ranged from 1 (best) to 0
(worst). The equation of RI can be described as follows:
(6)
where: xi is the measurement indicator (RMSE, MAPE, MAE, training time); is the maximum value of the indicator among all prediction methods; is the mini-mum value of the indicator among all prediction meth-ods; n is the number of measurement indicators.
4. Results and discussion
4.1. Model performance
A systematic methodology was previously established to calculate prediction performance. Database records contain several attributes related to productivity loss caused by change orders. Data preprocessing was done
to improve data quality. In the data preprocessing stage, two kinds of analysis relate to attributes reduction meth -ods. We performed Analyses 1 and 2 to compare the per-formance of each. Analysis 1 employed the CA method and Analysis 2 employed the PCA method, with each implementing training and testing processes in accord-ance with 10-fold cross-validation.
In the testing process, each fold validates the perfor-mance of the proposed model. A comparison with other methods such as ESIM (Cheng, Wu 2009), ANN, and SVM was developed to show EFSIM as more accurate and reliable. Several performance measures (RMSE, MAE, MAPE, and training time) were employed to eval-uate the proposed model.
Table 5 summarizes our comparison of Analyses 1 and 2 results. Optimal EFSIM parameter of Analysis 1 is
C = 31 and γ = 0.574, founded in fold 3. Meanwhile, C = 31 and γ = 0.566 of fold 9 is regarded as the optimal
EFSIM parameter in Analysis 2. In Analysis 1 earned better results in all EFSIM and ESIM performance
meas-ures except for MAPE. On the other hand, Analysis 2
obtained better results in SVM and ANN. Analysis 1 had a higher EFSIM training time than Analysis 2 because of its larger number of attributes.
However, the difference between the two analyses in terms of the MAPE performance measure was not
sig-nificant. Table 5 shows EFSIM results found both Analy
-sis 1 and Analy-sis 2 to be significantly more accurate than other AI techniques. Longer computation time is required for the EFSIM model due to the FL paradigm.
The more attributes in a training process, the more train-ing time is needed to obtain the prediction model.
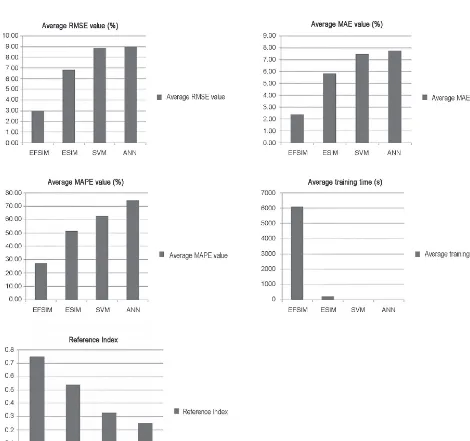
Table 6 shows average Analysis 1 and 2 perfor-mance values. The best model with the smallest RMSE value is EFSIM (2.98%). Moreover, Table 6 shows a Fig. 7. 10-fold cross-validation
Table 5. Performance of predictive techniques for Analyses 1 and 2
Analysis Predictive technique RMSE (%) EFSIM 2.83 2.25 30.44 7065.73
ESIM 6.57 5.62 55.40 231.3
ANN 9.24 8.00 76.43 1
SVM 9.12 7.78 60.70 1
EFSIM 3.13 2.51 23.85 5146.83
ESIM 7.12 6.07 48.12 138.2
ANN 8.79 7.55 72.82 1
SVM 8.61 7.23 65.16 1
Analysis 1
Analysis 2
direct relationship between RMSE and MAE. MAE values are always smaller than RMSE values. EFSIM obtains the smallest MAE value (2.38 %) of all models.
MAPE values are inadequate in all models due to the
series of small denominator values. MAPE values are consistent with other performance measures (RMSE and MAE). The best model is obtained by EFSIM (27.15%).
In terms of training time, both ANN and SVM train data
relatively quickly, while ESIM requires more time and EFSIM requires the most time. This is due to the FL par
-adigm that requires more computational time during the
training process and to the status of ESIM and EFSIM
as hybrid AI techniques. Longer computational time is a
trade off necessary to obtain greater accuracy. Figure 8 illustrates the performance described in Table 6.
The normalized RI obtained a general measure-ment by combining all performance measures. Based on RI values, EFSIM is the best model, followed in order
by ESIM, SVM, and ANN. Although EFSIM requires
the longest training time, it consistently obtains the best results on most other performance measures. Thus, by fusing FL, SVM, and fmGA, EFSIM predicts change-order-related productivity loss more accurately than the other models considered.
Table 6. Average performance values of the predictive techniques
Predictive
technique RMSE (%)
MAE (%)
MAPE (%)
Average training time (s)
RI
EFSIM 2.98 2.38 27.15 6106.28 0.7500
ESIM 6.84 5.84 51.76 184.75 0.5423
ANN 9.01 7.77 74.62 1 0.2500
SVM 8.86 7.70 62.93 1 0.3303
Fig. 8. Average result for performance measures with 10-fold cross-validation
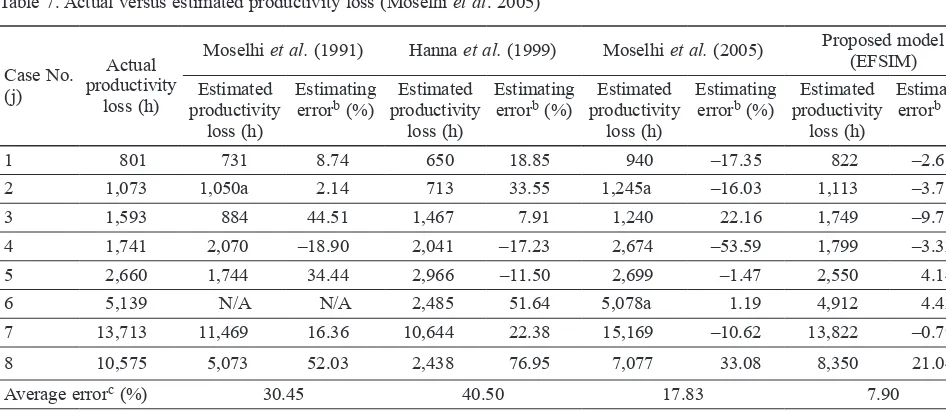
4.2. Validation with previous studies
We compared the performance of EFSIM against other methods such as the general regression model (Moselhi et al. 1991), electrical regression model (Hanna et al. 1999b), and neural network model (Moselhi et al. 2005). Our validation used a dataset of 33 records from Assem (2000) as training data and change-order data from the literature (Bruggink 1997) as testing data. Attributes used in this dataset were (1) timing impact of change orders (TPi); (2) work type; and (3) type of impact (TI), which could be either change orders only or change orders plus 1 or 2 additional causes of productivity related impact. TPi represents the ratio of actual change order hours to
planned hours in each of the five construction periods when change orders occur, where the value of i can range from 1 to 5. This data set used NECA (1983) distribution for electrical work and the trapezoidal distribution of Bent and Thuman (1994) for other types of work to distribute
the planned hours in each of the five construction periods.
The cases were analyzed using EFSIM and results were compared with previous studies found in Moselhi et al. (2005). Table 7 shows comparisons among all methods. Results demonstrate that the EFSIM model pro-posed in this study outperforms all other models in terms of estimating the impact of change orders on productiv-ity. EFSIM obtained the smallest average error (7.90%) and lowest average absolute error of any model. This shows that EFSIM improves prediction model accuracy and reliability.
Conclusions
This research proposes a hybrid AI technique, EFSIM, to predict productivity loss caused by change orders. The EFSIM, developed by fusing complementary AI tech-niques including FL, SVM, and fmGA, achieves predic-tion results superior to tradipredic-tional techniques.
The developed model reduces the level of human intervention necessary to elicit MF shapes from question-naire surveys and expert judgment; it also successfully
identifies optimum penalty and kernel parameters. EFSIM
is easy to apply and convenient for new users, and may be used by professionals without AI domain knowledge.
Test results show that EFSIM prediction perfor-mance is superior to other prediction methods such as ESIM, ANN, and SVM. Although EFSIM requires
Table 7. Actual versus estimated productivity loss (Moselhi et al. 2005)
Case No.
1 801 731 8.74 650 18.85 940 –17.35 822 –2.68
2 1,073 1,050a 2.14 713 33.55 1,245a –16.03 1,113 –3.75
3 1,593 884 44.51 1,467 7.91 1,240 22.16 1,749 –9.78
4 1,741 2,070 –18.90 2,041 –17.23 2,674 –53.59 1,799 –3.32
5 2,660 1,744 34.44 2,966 –11.50 2,699 –1.47 2,550 4.14
6 5,139 N/A N/A 2,485 51.64 5,078a 1.19 4,912 4.42
7 13,713 11,469 16.36 10,644 22.38 15,169 –10.62 13,822 –0.79
8 10,575 5,073 52.03 2,438 76.95 7,077 33.08 8,350 21.04
Average errorc (%) 30.45 40.50 17.83 7.90
Average absolute
errord (%) 25.30 30.00 19.44 6.24
Notes: N/A = not applicable (i.e. off model range);
aTwo additional types of impact are considered in the estimate (i.e. TI = 3);
bEstimating error
more computation time, EFSIM prediction results are
significantly more accurate than competing methods.
Validation results with previous studies in predicting the impact of change orders on productivity loss also indicate that EFSIM provides the smallest margin among
com-peting methods. These results exhibit great potential for
EFSIM as a tool to accurately predict change-order-related productivity loss. Moreover, the developed model manages
to help the project manager to make an adjustment related
to productivity loss caused by change order. Furthermore, this research paper succeed in demonstrating a hybrid
Arti-ficial Intelligence paradigm, FL-SVM-fmGA, for facilitat
-ing the decision mak-ing in the construction industry.
References
Assem, I. 2000. Estimating productivity losses due to change orders. Master’s thesis. Concordia University,
Montreal. 226 p.
Bent, J. A.; Thurman, A. 1994. Project management for engi-neering and construction. 2nd ed. New Jersey: Prentice-Hall Inc. 334 p.
Bojadziev, G.; Bojadziev, M. 2007. Fuzzy logic for business,
finance, and management. 2nd ed. Singapore: World Sci-entific. 232 p. http://dx.doi.org/10.1142/6451
Borra, S.; Di Ciaccio, A. 2010. Measuring the prediction error. A comparison of cross-validation, bootstrap and covari-ance penalty methods, Computational Statistics & Data Analysis 54(12): 2976–2989.
http://dx.doi.org/10.1016/j.csda.2010.03.004
Bruggink, M. J. 1997. An investigation into the impacts of
change orders on labor efficiency in the electrical con -struction industry. Master’s thesis. University of Wiscon -sin-Madison, Madison. 318 p.
Burges, C. J. C. 1998. A tutorial on support vector machines for pattern recognition, Data Mining and Knowledge Discov-ery 2(2): 121–167.
http://dx.doi.org/10.1023/A:1009715923555
Cheng, M.-Y.; Roy, A. F. V. 2010. Evolutionary fuzzy deci-sion model for construction management using support vector machine, Expert Systems with Applications 37(8): 6061–6069. http://dx.doi.org/10.1016/j.eswa.2010.02.120 Cheng, M.-Y.; Wu, Y.-W. 2009. Evolutionary support vector
machine inference system for construction management,
Automation in Construction 18(5): 597–604.
http://dx.doi.org/10.1016/j.autcon.2008.12.002
Chou, J.-S.; Chiu, C.-K.; Farfoura, M.; Al-Taharwa, I. 2011. Opti-mizing the prediction accuracy of concrete compressive strength based on a comparison of data-mining techniques,
Journal of Computing in Civil Engineering 25(3): 242–253.
http://dx.doi.org/10.1061/(ASCE)CP.1943-5487.0000088
Deb, K.; Goldberg, D. E. 1991. mGA in C: a messy genetic algorithm. C. IllGAL technical report 91008. Urbana, Illi -nois, University of Illinois at Urbana-Champaign. 118 p. Feng, C.-W.; Wu, H.-T. 2006. Integrating fmGA and CYCLONE
to optimize the schedule of dispatching RMC trucks,
Automation in Construction 15(2): 186–199.
http://dx.doi.org/10.1016/j.autcon.2005.04.001
Goldberg, D.; Deb, K.; Kargupta, H.; Harik, G. 1993. Rapid accurate optimization of difficult problems using fast messy genetic algorithms, in Proceedings of the 5th Inter-national Conference on Genetic Algorithms, 17–21 July 1993, University of Illinois, Morgan Kaufmann Publish -ers Inc, 56–64.
Han, J.; Kamber, M. 2007. Data mining: concept and tech-niques. 2nd ed. San Fransisco: Morgan Kaufmann Pub-lisher. 800 p.
Hanna, A. S.; Lotfallah, W. B.; Lee, M.-J. 2002. Statistical-fuzzy approach to quantify cumulative impact of change orders, Journal of Computing in Civil Engineering 16(4): 252–258.
http://dx.doi.org/10.1061/(ASCE)0887-3801(2002)16:4(252)
Hanna, A. S.; Russell, J. S.; Gotzion, T. W.; Nordheim, E. V. 1999a. Impact of change orders on labor efficiency for mechanical construction, Journal of Construction Engi-neering and Management 125(3): 176–184.
http://dx.doi.org/10.1061/(ASCE)0733-9364(1999)125:3(176)
Hanna, A. S.; Russell, J. S.; Nordheim, E. V.; Bruggink, M. J. 1999b. Impact of change orders on labor efficiency for electrical construction, Journal of Construction Engineer-ing and Management 125(4): 224–232.
http://dx.doi.org/10.1061/(ASCE)0733-9364(1999)125:4(224)
Hester, W. T.; Kuprenas, J. A.; Chang, T. C. 1991. Construction changes and change orders: their magnitude and impact. Austin: Construction Industry Institute. 125 p.
Hsu, C.-W.; Chang, C.-C.; Lin, C.-J. 2003. A practical guide
to support vector classification. Taipei, Taiwan, National Taiwan University. 16 p.
Ibbs, W. 2005. Impact of change’s timing on labor productivity,
Journal of Construction Engineering and Management
131(11): 1219–1223.
http://dx.doi.org/10.1061/(ASCE)0733-9364(2005)131:11(1219)
Ishigami, H.; Fukuda, T.; Shibata, T.; Arai, F. 1995. Structure optimization of fuzzy neural network by genetic algo -rithm, Fuzzy Sets and Systems 71(3): 257–264.
http://dx.doi.org/10.1016/0165-0114(94)00283-D
Keane, P.; Sertyesilisik, B.; Ross, A. D. 2010. Variations and change orders on construction projects, Journal of Legal Affairs and Dispute Resolution in Engineering and Con-struction 2(2): 89–96.
http://dx.doi.org/10.1061/(ASCE)LA.1943-4170.0000016
Ko, C. H. 2002. Evolutionary fuzzy neural inference model (EFNIM) for decision-making in construction manage-ment. PhD dissertation. National Taiwan University of
Science and Technology, Taipei, Taiwan. 205 p.
Leonard, C. A. 1988. The effects of change orders on productiv-ity. MS thesis. Concordia University, Montreal, Quebec.
156 p.
Martinez, C.; Castillo, O.; Montiel, O. 2008. Comparison between ant colony and genetic algorithms for fuzzy sys-tem optimization, Soft Computing for Hybrid Intelligent Systems 154:71–86.
http://dx.doi.org/10.1007/978-3-540-70812-4_5
Moselhi, O.; Assem, I.; El-Rayes, K. 2005. Change orders impact on labor productivity, Journal of Construction Engineering and Management 131(3): 354–359.
http://dx.doi.org/10.1061/(ASCE)0733-9364(2005)131:3(354)
Moselhi, O.; Leonard, C.; Fazio, P. 1991. Impact of change orders on construction productivity, Canadian Journal of Civil Engineering 18(3): 484–492.
http://dx.doi.org/10.1139/l91-059
National Electrical Contractor’s Association (NECA). 1983.
Rate of manpower consumption in electrical construc-tion. Electrical Construction Peak Workforce Report: 5.
Washington DC.
Shahi, A.; Atan, R. B.; Sulaiman, M. N. 2009. An effective fuzzy C-mean and type-2 fuzzy logic for weather fore-casting, Journal of Theoritical and Applied Information Technology 5(5): 556–567.
Vapnik, V. N. 1995. The nature of statistical learning theory. New York: Springer-Verlag. 188 p.
http://dx.doi.org/10.1007/978-1-4757-2440-0
Yongqiao, W.; Shouyang, W.; Lai, K. K. 2005. A new fuzzy support vector machine to evaluate credit risk, IEEE Transactions onFuzzy Systems 13(6): 820–831.
http://dx.doi.org/10.1109/TFUZZ.2005.859320
Zhang, S.; Zhang, C.; Yang, Q. 2003. Data preparation for data mining, Applied Artificial Intelligence 17(5–6): 375–381.
http://dx.doi.org/10.1080/713827180
Min-Yuan CHENG. He is Distinguished Professor in the Department of Civil and Construction Engineering at the National Taiwan University of Science and Technology, Taipei, Taiwan. He received his PhD degree from University of Texas at Austin, USA. He has about 20 years of teaching and research experience. He has authored about over 100 research papers published in various reputed international journal and conference proceedings. His research interests include: construction business process re-engineering, geo-graphic information system, construction automation & e-business for construction management, project management information system, and artificial intelligence applications in construction management.
Dedy Kurniawan WIBOWO. He joined Dual Degree Master Program between Sepuluh Nopember Institute of Technology, In-donesia and National Taiwan University of Science and Technology, Taiwan in 2010. He received his dual MT and MSc degree in 2012. His area of expertise is construction management.
Doddy PRAYOGO. He is a PhD student in the Department of Civil and Construction Engineering at the National Taiwan University of Science and Technology, Taipei, Taiwan. He received his ST degree in Petra Christian University, Indonesia, his dual MT and MSc degree in Sepuluh Nopember Institute of Technology, Indonesia and National Taiwan University of Science and Technology, Taiwan. He has authored several research papers published in various international journals and conference proceedings. His PhD research is focused on the artificial intelligence applications in construction management.
Andreas F. V. ROY. He is a Lecturer in the Department of Civil Engineering, Faculty of Engineering, Parahyangan Catholic Univer -sity. He is a member of ASCE 481587. His research interests include: infrastructure maintenance management systems, decision & risk analysis, management information system and applications of artificial intelligence in construction engineering and management.