The 2016 International Conference of Management Sciences (ICoMS 2016), March 10, UMY, Indonesia 194
SUPPLY CHAIN ANALYSIS OF DISPOSABLE MEDICAL DEVICES
Hery Suliantoro1, Intan Novita Dewi2, Naniek Utami Handayani3
Departement of Industrial Engineering, Universitas Diponegoro, Semarang, Indonesia [email protected]
ABSTRACT
As a middle-income countries, pharmaceutical cost in Indonesia is high in both public and private sectors. One of pharmaceutical services cost in Indonesia is disposable medical device. Disposable medical device are medical devices intended for single-use and are used to support the treatment process. The price of disposable medical devices in Indonesia may varies, but it should be a concern if there is different price for the same product. There are difference price of disposable medical devices between conventional procurement system and e-catalogue procurement system. This study is conducted to determine the supply chain of disposable medical devices from the two procurement systems that is in the strategic quadrant. From the study with Kraljic Portfolio Matrix methods, disposable medical devices chosen are disposable syringe 5cc. The result of study, the supply chain procurement of e-catalogue system is shorter than conventional procurement system. Shorter supply chain led to less purchase price of disposable syringe 5cc. By using e-catalogue system, the procurement process will be easier and faster.
Keywords :supply chain, kraljic portfolio matrix, disposable medical devices
INTRODUCTION
Pharmaceutical costs in the middle income countriesbecome important and controversial issue. Because most patients do not have insurance and paid for their own pharmacy, the pharmacy fee corresponding to revenue is very important to be accessible by the patient (Danzon et al, 2015). Based on the WHO study (2015), almost 90% of the population in developing countries to pay their own costs of pharmaceuticals that make treatment become the largest type of expenditure after food. In Indonesia, 60 to 80% of people pay the cost of pharmacy itself, it would be a burden on society (Anggriani et al, 2014).
As a middle-income countries, the cost of pharmacy in Indonesia is high in both the public and private sectors. The cost of pharmacy services in Indonesia include pharmaceutical (drug, medicinal materials, traditional medicines and cosmetics), medical devices and disposable medical devices (Permenkes DecreeNo. 58, 2014). For example the price of patented drugs in Indonesia reaches 22 to 26 times higher than international reference prices (IRP) in the public and private sector in 2004. Although generic drugs are cheaper than patented drugs, the price is still 9 times out of IRP (Anggriani et al, 2014).
Disposable medical device are medical devices intended for single use and are used to support the treatment process,the list of products stipulated in the legislation (Permenkes Decree No. 58, 2014). The price of disposable medical devices circulating in Indonesia varies depending on trademarks and product specifications. But it should be questioned if there is a
difference or price discrimination. Price discrimination occurs when a company gives different prices for different consumer groups on the same goods or services (Lichtenberg, 2010).
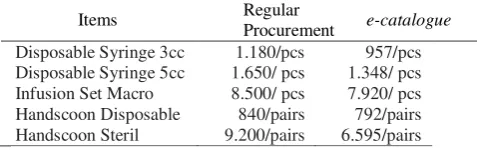
Data on the field shows different price of disposable medical device from two hospitals with different procurement system. The two hospitals use conventional procurement system and e-catalogue procurement system. E-catalogue is electronic information system which contains information about the list of names of drugs and medical devices, type, technical specifications, price smallest units and factories provider (Binfar Ministry of Health, 2013). Here is a comparison of the purchase price of disposable medical devices with conventional procurement system and e-catalog.
Tabel 1. Purchase Price Comparison
Items Regular
Procurement e-catalogue Disposable Syringe 3cc 1.180/pcs 957/pcs Disposable Syringe 5cc 1.650/ pcs 1.348/ pcs Infusion Set Macro 8.500/ pcs 7.920/ pcs Handscoon Disposable 840/pairs 792/pairs Handscoon Steril 9.200/pairs 6.595/pairs
To answer these differences, this study proposedto analyze the structure of the supply chainon both the procurement system.
LITERATURE REVIEW
The 2016 International Conference of Management Sciences (ICoMS 2016), March 10, UMY, Indonesia 195
information, from sources of raw materials to the end user.
In the healthcare industry, the supply chain related to pharmaceutical products is very important in ensuring high standards of care for patients and provide medical supplies and medical material sufficient consumables for pharmacies. In terms of costs , it is estimated that the cost of the supplies 25-30 percent of the cost of hospital operations (Mustaffa& Potter, 2009). Therefore, it is important to be managed effectively to ensure service and cost objectives are met .
This study used Kraljic Portofolio Modelto maximize supply security and reduce costs, by making the most of their purchasing power. In doing so, procurement moves from being a transactional activity to a strategic activity (Kraljic, 1983).Start by classifying all of the commodities, components, products, and services according to the supply risk and potential profit impact of each. Supply risk is high when the item is a scarce raw material, when its availability could be affected by government instability or natural disasters, when delivery logistics are difficult and could easily be disrupted, or when there are few suppliers.Profit impact is high when the item adds significant value to the organization's output. This could be because it makes up a high proportion of the output or because it has a high impact on quality.
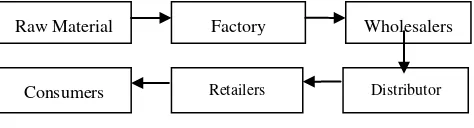
To analyze the structure of the supply chain of disposable medical devices, this studi used conceptual model in a study of pharmaceutical supply chain conducted by Mustamu (2007). He stated that distribution chain of pharmaceutical consist of raw material, factory, wholesalers, subdistributor, retailers and consumen.
RESEARCH MODEL Supply Chain
Supply chain is a network of facilities and distribution options that carry out the functions of procurement of raw materials into semi-finished goods and finished goods , and distribution of finished goods to customers (Ganeshan & Horison in Hugos, 2003, 3). A supply chain includes all the parts involved either directly or indirectly, in the process of fulfilling customer demand.
Supply Risk and Profit Impact supplier, number of potential supplier, political risk, availability to supplier, lead time, financial condition, quality, technology level, supply scarcity and logistic
cost. While profit impact areall factors that affect the profits of the company included purchased volume and impact on business growth.
The conceptual model in this study is based on a conceptual model research by Mustamu(2007). The purpose of this study is to shorten the supply chain of medical consumables material to make it more efficient.
Based on preliminary studies, the problem is difference price of disposable medical devices between conventional procurement system and e-catalogue procurement system. This research is focused to object of research, as well as interviews and discussions with the parties directly involved that understand and analyze the system of procurement of medical consumables such as disposable syringes 3cc, disposable syringes 5cc, infusion set macros, handscoon disposable and handscoon sterile applied at Puri Asih 'high'). The result is a 2x2 matrix and classified into four categories, namely bottleneck, non-critical, leverage and strategic items.
Product items that are included in the category of strategic items are then analyzed the structure of supply chain to see the added value that occurs along the supply chain. This study will compare the supply chain cost structure of conventional procurement system and e-catalog procurement system.
RESULTS AND DISCUSSION
The 2016 International Conference of Management Sciences (ICoMS 2016), March 10, UMY, Indonesia 196 attributes, and assign a Triangular Fuzzy Number to
each point in the linguistic scale.
Step 2: Collect scores of domain-experts on the attributes and convert into fuzzy number. In this research we use 10-point linguistic scale(Table 2).
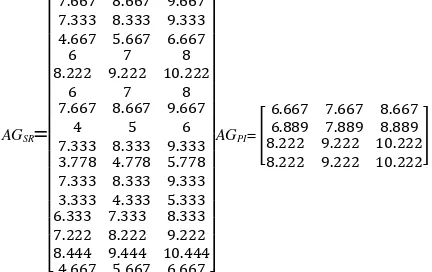
Step 3: Compute the average of the attribute importance scores. We calculated the average of the attribute importance scores given by the 3 procurement staff for each attribute. To compute the average portfolio attribute, where m=1, 2, …, M (here M=16 for supply risk and 4 for profit impact attributes).
We denote the vector of average preference scores as AGSRand AGPI for supply risk and profit impact
Step 4: Obtain the normalized supply risk and profit impact importance scores of the attributes by following Steps 4a through 4c.
AG is an (MxM) matrix. The ratio-based approach is followed to make the pair-wise comparisons. The fuzzy weight vectors are given by :
= ; = ; ….. = ; = (3)
Step 4b: Use Deng’s (1999) approach to determine the fuzzy attribute weights (βm) from the elements of AG’ as
normalized weight of the mth attribute, by dividing the priority weight of the mth attribute by the sum of the priority weights m:
………..……(6)
Step 5: Obtain performance scores from domain-experts on the commodities under consideration, and calculate the average performance scores. Performance of a procurement system (raw material) can be considered a utility value and can be evaluated by multiplying the weight normalized (NWm) for each attribute by averaging
the average achievement score ((1/E) ) and summing all the attributes for each item purchases (of raw materials), by the formula
j= 1,2,….,J……(7
Step 6: Positioning item with Multidimensional scale (MDS). MDS is used to find the dimensions and the pattern of dots within the most appropriate structure from the data. For this case the two axis of MDS is a supply risk and profit impact. For the n-dimensional Euclidean distance formula can be expressed as follows:
……….. (8
Where and shows the utility score of each item purchases (of raw materials) j and k respectively, i = 1,2, ..., n. In this case n = 2 (supply risk and profit impact). The Euclidean distance is shown in table 3.
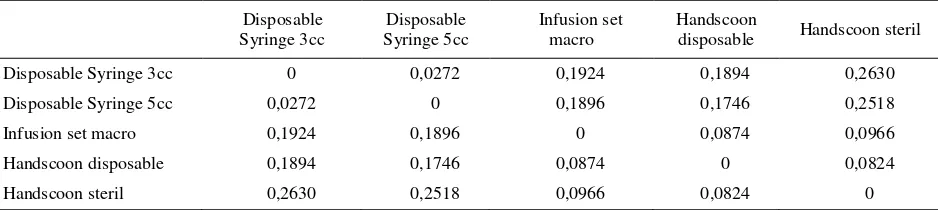
The 2016 International Conference of Management Sciences (ICoMS 2016), March 10, UMY, Indonesia 197 Table 3. Euclidean Distance
Disposable
Syringe 3cc
Disposable Syringe 5cc
Infusion set macro
Handscoon
disposable Handscoon steril
Disposable Syringe 3cc 0 0,0272 0,1924 0,1894 0,2630
Disposable Syringe 5cc 0,0272 0 0,1896 0,1746 0,2518
Infusion set macro 0,1924 0,1896 0 0,0874 0,0966
Handscoon disposable 0,1894 0,1746 0,0874 0 0,0824
Handscoon steril 0,2630 0,2518 0,0966 0,0824 0
Figure 2. Mapping Item
Based on Figure 2, the position of disposable medical device in the strategic quadrant is 5cc disposable syringe. The bottleneck quadrant is the disposable syringe quadrant 3cc, the leverage quadrant are handscoon handscoon disposable and sterile, and the non-critical quadrants is infusion set macros.Based on Kraljick matrix, this study chose 5cc disposable syringe as a case that will be analyzed on the supply chain. The5cc disposable syringe is a strategic item that supply chain risk is high and has a high profit impact
Supply chain of 5cc disposable syringe conventional procurement system is shown by the following picture :
Figure 3. Conventional procurement system
Figure 3 shows that the supply chain of conventional procurement system of disposable syringes 5cc starting from the manufacturer to distributor. Distributor appointed by manufacturers to market their products.
Then the distributor will market the product to the next sub-distributor. Sub distributor offering products to hospitals through sales. Having agreed with the price offered, the hospital will buy the product.
Below is a table of selling price difference of each stakeholder obtained from interviews with relevant parties
Table 4. Price Camparison between Stakeholders
Distributor Sub distributor
Rp 1.400/pcs Rp 1.650/pcs
The price offered by distributors and sub- distributors depending on the volume of purchases and discounts offered. Following the calculation of mark up disposable syringe 5cc :
= 17,86 ≈ 18%
The selling price at the distributor level is Rp 1,348 / pcs. Components of the cost of the e-catalog procurement system and the conventional procurement system the same such as profits, distribution costs, storage costs, fees of Human Resources (HR), and other costs (electricity, rent and others), the difference is the cost of promotion. In the e-catalog procurement system, there is no promotional costs. Distributors do not need to submit offers to the hospital because the hospital directly select items with the desired specifications and price.
Factory
The 2016 International Conference of Management Sciences (ICoMS 2016), March 10, UMY, Indonesia 198
Human Resources (HR) fees 20%
Promotion costs 35%
Other costs (electricity, rent and others) 15%
Table 5 shows that the sub- distributor profits by 5% , the cost of shipping goods to consumers by 20 % , the cost of storage of goods by 5 % . Cost of goods storage consists of a warehouse and inspection fees . Then there is a fee of 20% of human resources which is salaries. Promotion costs by 35 % and other costs by 15 % .
The 5cc disposable syringe supply chain e-catalog procurement system is shown by the following picture :
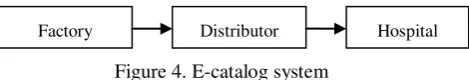
Figure 4. E-catalog system
Figure 4 shows e-catalogprocurement system. supply chain starting from the factory or manufactures. Factories enter the price and specifications of the items into the e–catalog system. When hospitals purchase items through e–catalog, the factory will contact the appointed distributors to deliver the goods to the hospital. Hospitals accept the orders for goods and pay according to the price on the e -catalog through risk in the strategic quadrant, the hospital is advisable to look for a new supplier. Via e-catalog the hospital can easily look for another supplier who could provide such products with varying prices. Through e-catalog can create e-market place for all commodities trading.
In the conventional supply chain procurement system selected items, there are several stakeholders involved such as factories, distributors, sub-distributors and hospitals. Factory as one of the stakeholders have a role as a manufacturer of disposable syringe 5cc. Distributors appointed by the manufacturer and serves to sell and market the item to sub distributors and retailers. Sub distributor will then resell the items at the hospital. The difference between the conventional supply chain and e-catalog is the existing of sub-distributor. In the e-catalog, hospitals do not buy
through sub-distributors but directly to the distributor so that it gets a cheaper price.
Price added occurs at each stakeholder throughout the supply chain. Price added varies between stakeholders and composed of various components such as profits, distribution costs, storage costs, fees of Human Resources (HR), promotional fees and other costs (electricity, rent and others). Thedisposable syringe 5 cc selling price difference obtained hospitals between conventional supply chain and e-catalog at 18.3% cheaper. It proved that buying from the e-catalog system more profitable.
To get a price close to the price of e-catalog, the hospital had to streamline the supply chain of disposable syringe procurement. Conventional supply chain consists of several stakeholders such as factories, distributors, sub-distributors and hospitals. When compared to the supply chain of e-catalog procurement system, the stakeholders involved smaller number that is only the manufacturer, distributor and hospitals. With fewer stakeholders involved, the price can be cheaper. The price difference will be very influential in the hospital with a large volume purchases.
REFERENCES
[1] Anggriani, Y., Ibrahim, M. I. M., Suryawati, S., &Shafie, A. A. (2014). The Impact of Indonesian Generic Medicine Pricing Policy on Medicine Prices. Journal of Generic Medicines Vol. 10(3-4) 219-229
[2] Ballou, R.H (2004). Business Logistics/supply Chain Management: Planning, Organizing, and Controlling the Supply Chain. Prentice Hall international edition
[3] Danzon, P. M., Mulcahy, A. W., &Towse, A. K. (2015). Pharmaceutical Pricing in Emerging Markets: Effects of Income, Competition, and Procurement. Journal of Health Economics 24 : 238-252
[4] Direktorat Jendral Bina Kefarmasian dan Alat Kesehatan Kementrian Kesehatan RI. 2013. Buletin Infarkes Edisi II. Jakarta: KementrianKesehatan
[5] Hugos, M. (2003). Essentials of Supply Chain Management. New Jersey. John Wiley & Sons
[6] Knight, L., Tu, Y. H., & Preston, J. (2014). Integrating Skills Profiling and Purchasing Portfolio Management: An Opportunity for Building Purchasing Capability. International Journal Productions Economics 147 (2014) 271-283
[7] Kraljic, P., 1983. Purchasing must become supply management. Harvard Business Review 61(5),
The 2016 International Conference of Management Sciences (ICoMS 2016), March 10, UMY, Indonesia 199 117.
[8] Lichtenberg, F. R. (2010). Pharmaceutical Price Discrimination and Social Welfare. Capitalism and Society: Vol. 5: Iss. 1, Article 2
[9] Mustaffa, N. H., & Potter, A. (2009). Healthcare Supply Chain Management in Malaysia: a Case Study. Supply Chain Management: An International Journal 14/3 (2009) 234-243
[10] Mustamu, R. H. (2007). ManajemenRantaiPasokanIndustriFarmasi di Indonesia. JurnalManagemendanKewirausahaan, Vol. 9 No. 2 September 2007: 99-106
[11] Padhi, S. S., Wagner, S. M., & Aggarwal, V. (2012). Positioning of Comodities Using the Kraljic Portfolio Matrix. Journal of Purchasing & Supply Management 18, 1-8
[12] Pettersson, A. I., &Segertedt, A. (2013). Measuring Supply Chain Cost. Int. J. Production Economics 143 (2013) 357-363
[13] Seifbarghy, M. (2009). Measurement of Supply Risk and Determining Supply Strategy, Case Study: a refrigerator making company. Teheran, Iran. Alzahra University
[14] WHO. (2015). WHO Guideline on Country Pharmaceutical Pricing Policies. Geneva, Switzerland. World Health Organization