Making Markets Work Better for the Poor
Making Val ue Chains
Wor k Bet t er f or t he Poor
A Toolbook for Pract it ioners of Value Chain Analysis
i
Making Markets Work Better for the Poor
Making Value Chains
Work Better for the Poor
A Toolbook for Practitioners of Value
Chain Analysis
M4P (2008) Making Value Chains Work Better for the Poor: A Toolbook for Practitioners of Value Chain Analysis, Version 3. Making Markets Work Better for the Poor (M4P) Project, UK Department for International Development (DFID). Agricultural Development International: Phnom Penh, Cambodia.
Department For International Development (DFID) 1 Palace Street
London SW1E 5HE United Kingdom www.d d.gov.uk
Publishers:
Agricultural Development International (Cambodia Representative Of ce) No. 38, Street 306
Sangkat Boeung Keng Kang I Khan Chamkar Morn
Phnom Penh, Cambodia
Disclaimer:
The views and opinions of the authors expressed in this publication do not necessarily state or re ect those of DFID.
Graphic Design and Printing:
Boonruang Song-ngam, Desktop Publishing. Cambodia
Photo credits:
Courtesy of SNV, GTZ and ADI
Download this publication from: www.valuechains4poor.org
iii
Foreword
This toolbook is the result of a concerted effort of a large number of people. Currently in its third version, substantial updates have been made since 2005 when this toolbook was fi rst envisaged. This version of the toolbook has benefi ted enormously from the establishment of a network of collaborators from around the world (currently 73 persons) who have contributed to the wikibook hosted at www.valuechains4poor.org. While the wikibook is a continually evolving resource, version 3 of this toolbook presents the state of the book as at 30 November 2008.
The working group of authors would like to gratefully acknowledge the support of the many people who contributed to the conception and preparation of this toolbook. These include Alan Johnson from the Department for International Development (DFID), Thomas Finkel and the staff of the Gesellschaft fűr Technische Zusammenarbeit – Development of Small and Medium Enterprises (GTZ-SME) promotion project, Kees van der Ree, Bas Rozemuller and Ingrid Hultquist of the ILO-PRISED (International Labour Organisation - Poverty Reduction through Integrated Small Enterprise Development Project) project.
Foreword
Table of Contents ... iv
List of gures ... vii
List of tables... viii
List of boxes ...ix
List of Abbreviations ...x
VALUE CHAIN TOOLBOOK – INTRODUCTION ...1
1. Introduction ... 1
2. Who should use the Toolbook? ... 1
3. Organisation of the Toolbook ... 1
4. How to use the Toolbook ... 3
5. Scope and Objective of Value Chain Analysis ... 4
PART 1 – CONCEPTS 1 De nition ...7
2 Value Chain Main Concepts ...8
Filière ...8
Porter’s Framework ...9
The Global Approach ... 10
3 A Pro-Poor Entry Point into Value Chain Analysis ... 11
PART 2 - VALUE CHAIN ANALYSIS TOOL - GENERAL TOOLS TOOL 1 - PRIORITISING VALUE CHAINS FOR ANALYSIS ... 17
1. Introduction ... 19
2. Objectives ... 19
3. Key Questions ... 19
4. Steps ... 19
Step 1 Determine criteria and build understanding of priorities ... 19
Step 2 Weighting of criteria ... 21
Step 3 Identifying a list of potential products/activities ... 21
Step 4 Ranking of products/activities ... 22
5. What Should be Known after Analysis is Complete ... 24
TOOL 2 - MAPPING THE VALUE CHAIN ... 27
1. Introduction ... 29
2. Objectives ... 29
3. Key Questions ... 29
4. Steps ... 29
Step 1 Mapping the core processes in the value chain ... 30
Step 2 Identifying and mapping the main actors involved in the processes ... 32
Step 3 Mapping fl ows of products ... 33
Step 4 Mapping knowledge and fl ows of information ... 34
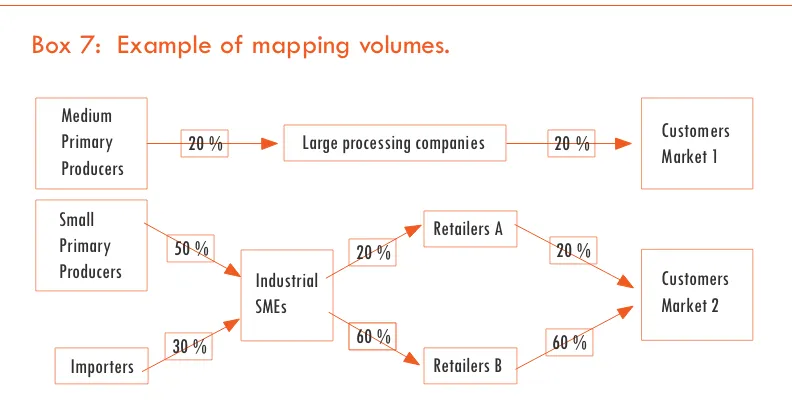
Step 5 Mapping the volume of products, numbers of actors and jobs ... 35
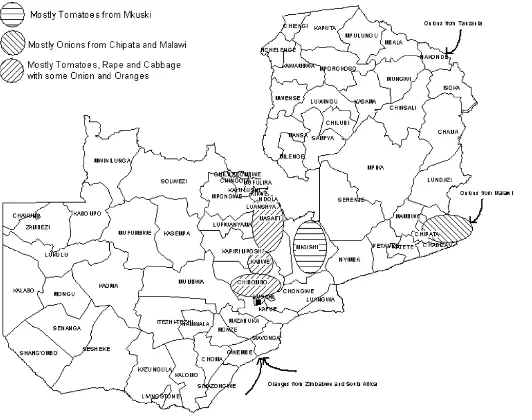
Step 6 Mapping the geographical fl ow of the product or service ... 37
Step 7 Mapping the value at different levels of the value chain ... 40
Step 8 Mapping relationships and linkages between value chain actors ... 40
v
Step 10 Mapping constraints and potential solutions ... 42
Step 11 Making a value chain map matrix ... 43
5. What Should be Known after Analysis is Complete ... 44
PART 3 - VALUE CHAIN ANALYSIS TOOLS - QUALITATIVE TOOLS TOOL 3 - GOVERNANCE: COORDINATION, REGULATION, AND CONTROL ... 45
1. Introduction ... 47
2. Objectives ... 48
3. Key Questions ... 48
4. Steps ... 49
Step 1 Map actors ... 49
Step 2 Determine the demand and supply conditions of the value chain ... 49
Step 3 Determine the dominant coordination arrangement(s) in the value chain ... 51
Step 4 Analyse how target populations participate in the value chain ... 52
Step 5 Identify rules and regulations ... 53
Step 6 Analyse impact of rules on value chain participants (including enforcement, rewards, and sanctions) ... 58
Step 7 Analyse target sector knowledge and awareness of rules, norms and standards, and identify key gaps ... 58
Step 8 Analyse how information and services are provided internally through the value chain and externally ... 59
5. What Should be Known after Analysis is Complete ... 60
TOOL 4 - RELATIONSHIPS, LINKAGES AND TRUST ... 63
1. Introduction ... 65
2. Objectives ... 66
3. Key Questions ... 66
4. Steps ... 66
Step 1 Map respondents and create categories ... 66
Step 2 Identify dimensions ... 67
Step 3 Survey actors ... 67
Step 4 Analyse the results of the survey ... 67
Step 5 Identifi cation of power distribution ... 69
Step 6 Analyse trust ... 71
5. What Should be Known after Analysis is Complete ... 72
TOOL 5 - ANALYSING OPTIONS FOR DEMAND-DRIVEN UPGRADING: KNOWLEDGE, SKILLS, TECHNOLOGY AND SUPPORT SERVICES... 73
1. Introduction ... 75
2. Objectives ... 76
3. Key Questions ... 76
4. Steps ... 77
Step 1 Analyse (mapping and diagnosis) the variation/differences in knowledge, skills and technology in the separate processes in the value chain ... 77
Step 2 Determine and describe standards along the chain (both in terms of market demand and supply) ... 82
Step 3 Identify distinct market chains based on applied knowledge, skills and technology and product grade levels achieved ... 82
Step 4 Identify opportunities for upgrading in knowledge, skills and technology for improving market chains ... 83
5. What Should be Known after Analysis is Complete ... 88
PART 4 - VALUE CHAIN ANALYSIS TOOLS - QUANTITATIVE TOOLS TOOL 6 – ANALYSING COSTS AND MARGINS ... 91
1. Introduction ... 91
2. Objectives ... 91
3. Key Questions ... 92
4. Steps ... 93
Step 1 Opportunity costs or nancial costs? ... 93
Step 2 Calculating costs and required investments ... 95
Step 3 Calculating revenues per actor ...100
Step 4 Calculating nancial ratios ...101
Step 5 Changes over time ...103
Step 6 Relative nancial position of actors in the value chain ...103
Step 7 Benchmarking ...106
Step 8 Going beyond the quantitative data ...106
5. What Should be Known after Analysis is Complete...106
TOOL 7 - ANALYSING INCOME DISTRIBUTION ...109
1. Introduction ...111
2. Objectives ...111
3. Key Questions ...111
4. Steps ...112
Step 1 De ne categories ...112
Step 2 Calculating incomes per unit of output...113
Step 3 Calculating the net income at each level of the value chain ...114
Step 4 Calculate the wage income distribution ... 116
Step 5 Calculate income variability over time ...118
Step 6 Appraising the place of income in livelihood strategies ...119
Step 7 Comparing incomes across different value chains ...122
5. What Should be Known after Analysis is Complete...124
TOOL 8 - ANALYSING EMPLOYMENT DISTRIBUTION ...127
1. Introduction ...129
2. Objectives ...129
3. Key Questions ...129
4. Steps ...130
Step 1 De ne the categories of actors ...130
Step 2 Determining employment at each level ...131
Step 3 Calculate the employment distribution at different levels of the value chain ...133
Step 4 Analysis of the employment distribution contribution ...135
Step 5 Determine the impact of governance on employment ...137
Step 6 Determine the impact of technology structures on employment ...138
Step 7 Determine the employment variability over time ...139
5. What Should be Known after Analysis is Complete...142
vii
List of Figures
Figure 1: Porter’s value chain ... 10
Figure 2: The value system ... 10
Figure 3: Pro poor growth ... 12
Figure 4: A schematic of a value chain analysis ... 14
Figure 5: Example of mapping core processes in the cassava value chain ... 31
Figure 6: An example of the type of information ows ... 35
Figure 7: Example of geographical mapping of the sugar value chain ... 38
Figure 8: Example of geographical mapping of fresh produce supply in Zambia ... 39
Figure 9: Initial matrix prepared after value chain mapping exercise ... 43
Figure 10: Dimensions of social capital related to value chains ... 48
Figure 11: Example of bargaining power, chances for contracting systems and chain governance for perishable goods ... 50
Figure 12: Global value chain classi cation ... 51
Figure 13: Value chain classi cation applied to pro-poor markets ... 52
Figure 14: A graphic example of the different levels in the value chain that individual rules might apply to ... 57
Figure 15: Linkages with different organisations by farm family respondents ... 69
Figure 16: Value chain margins for the actors in each level of the value chain as a percentage of the overall value added ...104
Figure 17: Rice value chain - categorisation of actors ...113
Figure 18: Comparison of net incomes from rice production with the of cial poverty line – minimum area of rice land required to support a four person household in the Red River Delta of Vietnam ...116
Figure 19: Monthly cash constraint by wealth category ...119
Figure 20: Comparison of pro t margins across governance systems in cotton in Zambia ...122
Figure 21: Income distribution and employment across value chains in Zambia ...124
Figure 22: Example of employment over different stages in the value chain ...134
Figure 23: Example of analysing labour utilization using participatory approaches in the Philippines ...140
Figure 24: Graphic presentation of grouped labour use ...141
Table 1: Tools for analysing various dimensions of the value chain ...2
Table 2: Examples of different points of entry for value chain research. ... 15
Table 3: MPDF sub-sector selection criteria for value chain identification ... 23
Table 4: NESDB sub-sector selection criteria for value chain identification ... 23
Table 5: Matrix ranking of products by scoring ... 24
Table 6: Participatory commodity priority setting exercise results ... 25
Table 7: An example of mapping constraints and possible solutions ... 42
Table 8: Information transferred to final matrix ... 44
Table 9: Types of rules and standards affecting value chains ... 55
Table 10: Example of matrix for actors and regulations. ... 57
Table 11: Example of farmer marketing school grading table (yard long bean in Kampot, Cambodia) ... 59
Table 12: External actors assisting firms to meet value chain rules ... 60
Table 13: Extract from a survey questionnaire on value chain linkages in the Bangladesh shrimp industry ... 68
Table 14: Identifying the key governors in the chain. ... 70
Table 15: Differences between chains characterised by low and high levels of trust ... 71
Table 16: Example of matrix of trust levels between actors ... 72
Table 17: Example of knowledge and technology matrix - cassava production and processing . 77 Table 18: Examples of questions that can be asked to the different actors in the value chain ... 78
Table 19: Product standards table with specified visible key features and grades ... 79
Table 20: Matrix for market channel analysis of poultry ... 82
Table 21: Example – upgrading possibilities matrix for Longan ... 84
Table 22: Example of different technology options available relative to investment levels ... 85
Table 23: Important issues to consider when selecting the best potential upgrading options for the poor ... 86
Table 24: Overview of potential services for upgrading ... 87
Table 25: Examples of costs in a value chain... 95
Table 26: A virtual example of costs for milk collection centres and dairy plant ... 97
Table 27: An example of presenting cost compilation across actors in the value chain ...100
Table 28: Calculation of marketing margins – formulas for calculating ratios...103
Table 29: Calculation of marketing margins - example of presenting a calculation of value chain margins ...104
Table 30: Cotton crop budgets for smallholder farmers in Zambia ...107
Table 31: Costs, revenues and margins for rice farming ...108
Table 32: Example of income distribution along the value chain for silk in Thailand ...114
Table 33: Estimates of family commercial farmers’ incomes compared with subsistence income ...115
Table 34: A virtual example of calculation of total wage costs for a farmer to process 50 tonnes of vegetables ...117
Table 35: Distribution of incomes and profits in the Zambian cotton value chain ...117
Table 36: Source of farm family incomes in Lao PDR - average percentage reported ...121
Table 37: Income distribution and employment across value chains in Zambia ...123
Table 38: Estimation of incomes of various actors of the vegetable chains (USD) ...125
Table 39: Distribution of incomes from onion production in Niger to retail sale in Abidjan in 1995 ...126
Table 40: Average utilisation of labour by livelihood activities in Lao PDR ...133
ix
Table 42: Income distribution and employment across value chains in Zambia ...137
Table 43: Seasonal labour patterns in Houysan Village, Savannakhet Province, Lao PDR ...139
Table 44: Average use of labour (%) by livelihood activities - poor families in Houysan Village, Lao PDR ...140
List of Boxes
Box 1: List of potential value chains in Son La, Vietnam ... 22Box 2: Example of mapping core processes ... 30
Box 3: Example of mapping actors ... 32
Box 4: Example of mapping of speci c activities undertaken by actors from core processes ... 33
Box 5: Example of product ows in the pig value chain, Ben Tre Vietnam ... 34
Box 6: Example of mapping knowledge ... 34
Box 7: Example of mapping volumes ... 35
Box 8: Example of mapping volumes in a bamboo value chain ... 36
Box 9: An example of volume mapping in the cat sh value chain ... 36
Box 10: Example of mapping the number of actors and employees involved in vegetable retail in Hanoi, Vietnam ... 37
Box 11: Example of mapping value added throughout the chain ... 40
Box 12: Example of mapping relationships and linkages ... 41
Box 13: Example of mapping business services ... 42
Box 14: Example of possible positions of smallholders in a value chain ... 53
Box 15: Example of power imbalance - The shrimp export industry in Bangladesh ... 54
Box 16: Coordination structures in the cotton value chain in Zambia - the Distributor Model ... 61
Box 17: Norm table developed for dried longan in North Vietnam ... 79
Box 18: Of cial grading tables for certain Indian cashew types ... 80
Box 19: Quality criteria for green leaf vegetables along a value chain in North Vietnam ... 81
Box 20: Quality criteria along a pig value chain in North Vietnam ... 81
Box 21: An example of technology development – Longan drying technology development ... 83
Box 22: An example of factors in uencing upgrading possibilities in the cassava value chain .... 84
Box 23: Possibilities for upgrading Thieu Thanh Ha Litchi value chains by combining local and scienti c knowledge ... 88
Box 24: Opportunity cost of choosing different cropping systems ... 94
Box 25: Example of calculating transport costs ... 98
Box 26: Calculating costs on losses ... 98
Box 27: An example of calculating the weighted average selling price ...100
Box 28: Revenues, costs and pro t per unit in the value chain of 1 litre sh sauce (quality 2) ...105
Box 29: Example of survey question to examine seasonal cash constraints ...118
Box 30: Extract of survey questionnaire on calculating household income ...120
Box 31: Examples of other categories of actors ...130
Box 32: Example of employment impact evaluation ...135
Box 33: Example of employment across different governance structures in cotton in Zamia ...134
Box 34: Example of employment generation for poor in a supermarket-driven chain in Vietnam ...138
Box 35: Survey questionnaire for calculating distribution of employment ...139
ABD Agro Business Development A/S (Denmark)
BCAS Bangladesh Center for Advanced Studies
CAMIP Cambodia Agricultural Market Information Project
CF Collaborating Farmers
CIDA Canadian International Development Assistance
CIEM Central Institute for Economic Management (Vietnam)
DFID Department for International Development
DVC Domestic Value Chain
EU European Union
FMS Farmer Marketing School
FTE Full Time Equivalent
GAP Good Agricultural Practices
GTZ Gesellschaft für Technische Zusammenarbeit (German Development Cooperation)
HACCP Hazard Analysis and Critical Control Point
IFAD International Fund for Agricultural Development
IFC International Finance Corporation
ILO International Labour Organisation
IPM Integrated Pest Management
ITTCP Information for Tourism and Trade Promotion Center (Vietnam)
LF Lead Farmers
M4P Making Markets Work Better for the Poor
MPDLC Micro Projects Development through Local Communities (Vietnam)
MPFD Mekong Private Sector Development Facility
NEED North-East Economic Development Project (Thailand)
NERI National Economic Research Institute (Vietnam)
NESDB National Economic and Social Development Board (Thailand)
NCF Non-Collaborating Farmers
OEM Original Equipment Manufacturer
OTOP One Tambon (Village) One Product
PRISED Poverty Reduction through Integrated Small Enterprise Development
R&D Research and Development
RDMA Rural Development in Mountainous Areas
ROI Return on Investment
Rs Rupees
SME Small and Medium Enterprise
SNV Netherlands Development Organisation
UK United Kingdom
UNDP United Nations Development Programme
USD United States Dollar
VND Vietnam Dong
1
1 Part 1 – Concepts
A Toolbook for Practitioners of Value Chain Analysis
Value Chain Toolbook – Introduction
1. Introduction
The toolbook provides value chain practitioners with an easy to use set of tools for value chain analysis, with a focus on poverty reduction. Although a number of handbooks on value chain analysis already exist, the aim of this toolbook is to strengthen the links between value chain analysis and development interventions that improve the opportunities available to the poor. Hence, the tools presented here are similar to those presented in other handbooks, but the unique feature of the toolbook is that each of the tools has a clear focus on analysing the impact of the value chain from the point of view of the poor.
2. Who should use the Toolbook?
The toolbook is designed as a concise manual to be used in the fi eld and by those involved in project development and/or assessment of investment opportunities. The focus is on providing easy to follow tools and clear explanations about their use. This includes examples of how these can and have been used in real value chain analyses in the past. Although the value chain analysis theory that underpins the tools presented in the toolbook is an important element, the practical aspects of analysis dominate the toolbook content.
One of the basic assumptions for using this toolbook is that the starting point of the value chain analysis is market development aimed at making an impact on the poor by providing them with better income or employment security through market participation. This means that farmers/producers are not looked upon as small surplus sellers from within a self-suffi ciency strategy but rather as commercial (micro-) entrepreneurs for whom participation in the market is a deliberate and focused choice.
As much as the toolbook is developed for fi eld-based practitioners it is also a useful resource for local policy and decision makers. The toolbook can provide them with a better understanding on how markets can be organised, and the role they can play as decision makers to facilitate the development of value chains and improve the position of the poor within the value chain. The principles presented in the toolbook can also help inform the decision to select certain value chains in which e.g. a province or district wants to be more competitive and to commission value chain analysis research to determine development strategies.
3. Organisation of the Toolbook
The toolbook is organised in two sections. The fi rst section gives a theoretical background to value chains and also explains the pro-poor entry points for value chain analysis described in this toolbook.
The second section contains eight practical value chain analysis tools that can be used to analyse different dimensions within value chains; see Table 1.
Par
Table 1: Tools for analysing various dimensions of the value chain.
The eight tools presented in the toolbook relate more closely with some dimensions than others, as indicated by a greater number of ticks for that association.
Access to infrastructure D D DD D D
1
3 Part 1 – Concepts
A Toolbook for Practitioners of Value Chain Analysis
Terminology: dimension
Dimension in this toolbook means an area of interest or focus for the analysis. For example, a specifi c dimension targeted in this toolbook is the participation of the poor.
The eight tools are grouped in three sub-sets. The fi rst sub-set contains two general tools on value chain selection and mapping of value chains. The second sub-set contains three qualitative tools to analyse the governance structure, linkages, and opportunities for upgrading. The third sub-set contains three quantitative tools to analyse costs and margins, income distribution and employment distribution.
Specifi c examples of the use of these different tools in value chain analysis appear in the toolbook as boxes, or are presented at the end of each tool. Other important points in the toolbook are highlighted with the following icons:
Take Note Terminology Warning Try This Idea
4. How to use the Toolbook
Using the tools presented in the toolbook is not meant to be a linear process of working one’s way from Tool 1 to 8. Value chain analysis is not a linear process but should try to capture the dynamics and fl exibility within the value chain as well. Depending on the main pro-poor interests, time available for analysis and experience with value chain work, some tools may be used more intensely than others.
Table 1 shows various dimensions of pro-poor value chain analysis and the tools that could be utilised to analyse those dimensions. The relevance of each tool to a specifi c dimension is indicated by the number of ticks; the greater the number of ticks (to a maximum of three ticks), the more relevant the tool is for analysing that particular dimension.
5. Scope and Objective of Value Chain Analysis
Having various tools available to analyse value chains does not mean that all of the tools should be used at all times. The choice of tools to be used (general, qualitative and/or quantitative) will depend largely on the scope and objective of the analysis itself (often dictated by fi nancial or time constraints, or other limitations).
Pro-poor growth has been chosen as the main objective of value chain analysis in this toolbook. Therefore, the focus of the analysis should be on gaining a good understanding of the context in which producers and/or small traders operate as participants of the value chain. In chains that are in an early stage of development the same persons often carry out these two functions. It should be taken into account also that actors at the producer/trader level are often involved in more than just the single activity that is being analysed.
Terminology: actor
The term actor refers to any person (e.g. farmer, trader, supplier, buyer) who plays a role in the value chain.
Once the direct context of the activity to be analysed is understood, it becomes important to look at the wider environment in which the value chain operates. For example, the broad government economic policies and the extent to which pro-poor policies have been integrated into and are in tune with these broader government policies, rather than standing on their own.
PART 1 CONCEPTS
PART 2 - VALUE CHAIN
ANALYSIS TOOLS -
GENERAL TOOLS
PART 3 - VALUE CHAIN
ANALYSIS TOOLS
- QUALITATIVE
TOOLS
PART 4 - VALUE CHAIN
1
1
PART 1 – CONCEPTS
Contents
1 De nition ...7
2 Value Chain Main Concepts ...8
Filière
...8
Porter’s Framework ...9
The Global Approach ... 10
6 Part 1 – Concepts
1
Concepts
1 De nition
The idea of value chain is quite intuitive. The term value chain refers to the full range of activities that are required to bring a product (or a service) from conception through the different phases of production to delivery to fi nal consumers and disposal after use (Kaplinsky 1999; Kaplinsky and Morris 2001). Further, a value chain exists when all of the actors in the chain operate in a way that maximises the generation of value along the chain.
This defi nition can be interpreted in a narrow or broad sense.
In the narrow sense, a value chain includes the range of activities performed within a fi rm to produce a certain output. This might include the conception and design stage, the
process of acquisition of input, the production, the marketing and distribution activities, and the performance of after-sale services. All of these activities constitute the ‘chain’ which links producers to consumers and each activity adds ‘value’ to the fi nal product.
For example, the availability of post-sale assistance and repair services for a mobile phone company increases the overall value of the product as a consumer may be willing to pay a higher price for a mobile phone that has a good after-sale service. The same is true for an innovative design or for a highly controlled production. For example, in agribusiness enterprises an appropriate system of storing fresh raw materials (e.g. fruits) positively impacts on the quality of the fi nal product and, consequently, increases its value.
The broad approach of defi ning a value chain looks at the complex range of activities implemented by various actors (primary producers, processors, traders, service providers) to bring a raw material through a chain to the sale of the fi nal product. The ‘broad’ value chain starts from the production system of the raw materials and will move along the linkages with other enterprises engaged in trading, assembling, processing, etc.
The broad approach does not only look at the activities implemented by a single enterprise. Rather, it includes all its backward and forward linkages, until the level in which the raw material is produced will be linked to the fi nal consumers. In the remaining part of this handbook, the term ‘value chain’ will refer exclusively to this broad defi nition.
The concept of value chain encompasses the issues of organisation and coordination, the strategies and the power relationships of the different actors in the chain. These and other relevant issues will be discussed in this toolbook. For now it is important to understand that conducting a value chain analysis requires a thorough investigation of what is going on between the actors in a chain, what keeps these actors together, what information is shared, and how the relationships between actors is evolving.
8 Part 1 – Concepts
Making Value Chains Work Better for the Poor
social ties and traditional norms. For example, power relationships within households or communities may be modifi ed or the vulnerable or poorest population groups may be negatively affected by the operations of value chain participants.
These concerns are highly relevant to agricultural value chains because agricultural value chains are critically dependant on environmental resources. Also, the agricultural sector is often characterised by the prevalence of traditional social norms. Finally, due to the high incidence of the poor in the agricultural sector, the value chain framework can be used to draw conclusions on the participation of the poor and the potential impact of value chain development on poverty reduction.
2 Value Chain Main Concepts
This section provides an overview of the main concepts of value chain from an academic perspective. This serves to clarify the concept and the concise literature review presented here introduces some of the main issues related to value chain analysis. The three main research streams in the value chain literature are: (i) the fi lière approach (Durufl é, Fabre et al. 1988), (ii) the conceptual framework elaborated by Porter (1985) and (iii) the global approach proposed by Kaplinsky (1999) and Gereffi et al (Gereffi 1994; Gereffi and Korzeniewicz 1994; Gereffi 1999; Gereffi , Humphrey et al. 2003).
Filière
The ‘fi lière’ approach (fi lière means thread or chain) includes various schools of thought and research traditions. Initially, the approach was used to analyse the agricultural system of developing countries under the French colonial system. The analysis mainly served as a tool to study the ways in which the agricultural production systems (especially rubber, cotton, coffee and cocoa) were organised in the context of developing countries. In this context, the fi lière framework paid special attention to how local production systems were linked to processing industry, trade, export and fi nal consumption.
The fi lière concept has therefore always encompassed a strong empirical perspective which was used to map the fl ow of commodities and to identify actors and activities. The rationale of the fi lière is similar to the broader concept of value chain presented above. However, the fi lière mainly focused on issues of physical and quantitative technical relationships, summarised in fl ow-charts of commodities and mapping of transformation relationship.
There are two strands of fi lière approach which share some insights with value chain analysis:
1
the strategy-focused analysis of fi lière, especially used in the university of Paris-Nanterre, some research institutes (e.g. CIRAD and INRA) and NGOs working on agricultural development (e.g. IRAM), researching in a systemic way the interplay of objectives, constraints and results of each type of actors in the chain. Individual and collective strategies are analysed, as well as patterns of regulations, for which Hugon (1985) defi nes four main types of commodity chains in Africa: domestic regulation, market regulation, state regulation and international agri-business regulation. Moustier and Leplaideur (1999) have provided an analytical framework on the organisation of the commodity chains (mapping, individual and collective strategies), and its performance in terms of price and income generation, taking into account African food farmers’ and traders’ specialisation versus diversifi cation strategies.
Porter’s Framework
The second research stream refers to the work of Porter (1985) on competitive advantages. Porter has used the framework of value chains to assess how a fi rm should position itself in the market and in the relationship with suppliers, buyers and competitors. The idea of competitive advantage of an enterprise can be summarised as follows: how can a fi rm provide customers with a product or service of equivalent value compared with competitors, but at lower cost (strategy of cost reduction)? Alternatively, how can an enterprise produce a product or service that customers are willing to pay a higher price for (strategy of differentiation)?
In Porter’s (1985) framework the value chain provides a tool that fi rms can use to determine their source (current or potential) of competitive advantage. In particular, Porter argued that the sources of competitive advantage cannot be detected by looking at the fi rm as a whole. Rather, the fi rm should be separated into a series of activities and competitive advantage found in one (or more) of such activities. Porter distinguishes between primary activities, which directly contribute to add value to the production of the product or services and support activities, which have an indirect effect on the fi nal value of the
product.
In the framework of Porter the concept of value chain does not coincide with the idea of physical transformation. Porter introduced the idea that a fi rm’s competitiveness does not relate exclusively to the production process. Enterprise competitiveness can be analysed by looking at the value chain which includes product design, input procurement, logistics, outbound logistics, marketing, sales, after-sales and support services such as strategic planning, human resources management and research activities.
10 Part 1 – Concepts
Making Value Chains Work Better for the Poor
Figure 1: Porter’s value chain.
The model created by Porter identifi es a number of primary and support activities that are common to a range of businesses. The value chain highlights specifi c activities through which fi rms can create value and therefore is a useful tool to simplify analysis.
An alternative way of approaching the search of competitive advantage is based on the concept of a value system; see Figure 2. Instead of limiting the analysis of competitive advantage to a single fi rm, the fi rm’s activities are considered as a part of a larger stream of activities, termed ‘the value system’. A value system includes the activities implemented by all fi rms involved in the production of a good or service, starting from basic raw materials to those engaged in the delivery of the fi nal product to consumers. The concept of value system is therefore broader compared to the one of ‘enterprise value chain’ and resembles what this toolbook refers to when dealing with value chains (broad approach). However, it is important to point out that in Porter’s framework the concept of value system is mostly a tool for assisting executive management in strategic decisions.
Figure 2: The value system.
With this approach the value chains of each fi rm are analysed to provide an overview of the value system.
The Global Approach
More recently, the concept of value chains has been applied to the analysis of globalisation (Gereffi and Korzeniewicz 1994; Kaplinsky 1999). This literature used the framework of value chain to examine the ways in which fi rms and countries are globally integrated and to assess the determinants of global income distribution.
1
Firstly, by mapping the range of activities along a chain, a value chain analysis breaks downtotal value chain earnings into the rewards that are achieved by different parties in the chain. This method will be introduced in the second part of this toolbook. A value chain analysis is the most accurate way of understanding the distribution of earnings. Other ways of viewing global distributional patterns provide only partial insights into these areas. For example, trade statistics only provide data on aggregate, gross returns rather than on net earnings, and branch-specifi c analyses (agriculture, industry, services) only capture part of the story.
Secondly, a value chain analysis can show how fi rms, regions and countries are linked to the global economy. This will largely determine the distributional outcomes of global production systems and the capacity which individual producers have to build in order to upgrade their operations and thus to launch themselves onto a path of sustainable income growth.
In the value chain framework international trade relations are considered part of networks of producers, exporters, importers, and retailers, whereby knowledge and relationships are developed to gain access to markets and suppliers. In this context, the success of developing countries and market actors in developing country lies in the ability of accessing these networks.
A key contribution of this tradition is a well-developed theory of governance of globally integrated production systems that is relevant to the power of lead fi rms to set standards that defi ne the terms on which producers participate in these systems. Particularly, Gereffi , Humphrey, and Sturgeon (2003) attribute the mode of governance of a value chain to a combination of complexity of transactions, ability to codify (or formally describe) transactions, and the competency of the supplier base, the combination(s) of which result in different coordination structures of value chains. According to this approach, low supplier competency is a key barrier to participation of the poor in globally integrated chains.
3 A Pro-Poor Entry Point into Value Chain Analysis
Value chain analysis is reasonably fl exible and the value chain can be analysed from the point of view of any one of the large number of actors in the chain. Value chain analysis as presented above can help design projects and programs to provide support to a value chain, or set of value chains, in order to achieve a desired development outcome.
Examples of desired development outcomes could include: increasing the level of exports, generating maximum employment, benefi ting a particular group in society, using locally produced raw materials, or concentrating development benefi ts in underdeveloped or disadvantaged regions of a country. The entry point, and therefore the concentration of the value chain analysis, is directly related to the desired development outcome from supporting the value chain.
12 Part 1 – Concepts
Making Value Chains Work Better for the Poor
the poor do not only gain more absolute income but also relative income compared to the other actors in the value chain; see Figure 3. This is shown as T = 2 and can be defi ned as pro-poor growth.
Figure 3: Pro poor growth.
The baseline situation is shown as T = 0. Economic growth in which all participants of the value chain see increased income is shown in T = 1. In T = 2 the poor actors in the value chain get a relative increase in growth compared with the other actor in the value chain.
The value chain approach is mainly a descriptive tool to look at the interactions between different actors. One advantage of value chain analysis is that it forces the analyst to consider both the micro and macro aspects of production and exchange activities. The commodity-based analysis can provide better insights into the organisational structures and strategies of different actors and an understanding of economic processes which are often studied only at the global level (often ignoring local differentiation of processes) or at the national/local levels (often diminishing the larger forces that shape socio-economic change and policy making).
Kaplinsky and Morris (2001) stress that there is no “correct” way to conduct a value-chain analysis; rather, the approach taken fundamentally depends on the question that is being asked. However, four aspects of value-chain analysis of agriculture are particularly important.
First, at its most basic level, a value-chain analysis systematically maps the actors
participating in the production, distribution, marketing, and sales of a particular product (or products). This mapping assesses the characteristics of actors, profi t and cost structures, fl ows of goods throughout the chain, employment characteristics, and the destination and volumes of domestic and foreign sales (Kaplinsky and Morris 2001). Such details can be gathered from a combination of primary survey work, focus groups, participatory rural appraisals (PRAs), informal interviews, and secondary data.
Second, value-chain analysis can play a key role in identifying the distribution of benefi ts of actors in the chain. That is, through the analysis of margins and profi ts within the chain, it is possible to determine who benefi ts from participation in the chain and which actors could benefi t from increased support or organisation. This is particularly important in the context of developing countries (and agriculture in particular), given concerns that the poor in particular are vulnerable to the process of globalisation (Kaplinsky and Morris 2001). One can supplement this analysis by determining the nature of participation within the chain to understand the characteristics of its participants.
Poor Poor
Poor
T = 0 T = 1
Economic growth: pie grows
T = 2
Poverty reduction: piece stays same or grows
1
Third, value-chain analysis can be used to examine the role of upgrading within thechain. Upgrading can involve improvements in quality and product design or diversifi cation in the product lines served, allowing producers to gain higher value. An analysis of the upgrading process includes an assessment of the profi tability of actors within the value chain as well as information on limitations that are currently present. Governance issues (see below) play a key role in defi ning how such upgrading occurs. In addition, the structure of regulations, entry barriers, trade restrictions, and standards can further shape and infl uence the environment in which upgrading can take place.
Finally, value-chain analysis highlights the role of governance in the value-chain, which can be internal or external. Governance within a value-chain refers to the structure of relationships and coordination mechanisms that exist between actors in the value-chain. Governance is a broad concept which basically ensures that interactions between chain participants are organised, rather than being simply random. Generally speaking, governance within the chain occurs when some actors in the chain work to criteria set by other actors in the chain, for example quality standards or delivery times and volumes set by processing industries. Commercial rules that govern commercial relationships in global or local value chains may constrain or restrict the role of the poor, but also may create important learning and upgrading opportunities. Commercial rules can be very specifi c (codifi ed), e.g. clearly set and described quality grades of agricultural produce with corresponding transparent prices or pricing formulas.
External governance is important from a policy perspective by identifying the institutional arrangements that may need to be targeted to improve capabilities in the value-chain (e.g. research), remedy distributional distortions, and increase value-added in the sector. External governance also relates to chain specifi c legislation and regulation, but also describes general public sector interventions relevant to value chain development.
Figure 4 illustrates the methodology used in value-chain analysis. At the heart of the analysis is the mapping of sectors and key linkages. The value-added of the value-chain approach, however, comes from assessing these intra- and inter-actor linkages through the lens of issues of governance, upgrading, and distributional considerations. By systematically understanding these linkages within a network, one can better prescribe policy recommendations and, moreover, further understand their impact on the chain.
Value chains are complex, and particularly in the middle levels, one fi rm may feed into several of chains. Which chain (or chains) is the subject of enquiry depends on the point of entry for the research inquiry. Table 2 lists some possible points of entry.
14 Part 1 – Concepts
Making Value Chains Work Better for the Poor
The key entry point that will be used in this toolbook is the impact of the development and operation of value chains on the poor. This entry point will be incorporated into each of the tools described in the toolbook. Although the tools contained in the toolbook are a standard set of tools for value chain analysis, the distinguishing feature of the tools presented in the following sections are that they are explicitly slanted toward the analysis of how the value chain is “working for the poor”.
Figure 4: A schematic of a value chain analysis.
In this analysis the value chain linking actors from production to final consumption is overlaid with the three main issues of governance structures, upgrading strategies and distributional and equity.
Source: (Rich 2004)
Governance
Upgrading
Distributional Issues
A hypothetical value-chain in agricultureFarmers/Producers
Assemblers/Traders
Processors
- Governance - Upgrading - Distributional Issues
Retailers Traders Exporters End-users
Foreign Traders
Foreign Distributors
Foreign Retailers - Governance
1
Table 2: Examples of different points of entry for value chain research.
The entry point in to the value chain will be determined by the primary research interest. Note in this table OEM denotes Original Equipment Manufacturer and SME denotes Small Medium Enterprises.
Primary area of research interest The global distribution of income 2nd and 3rd tier suppliers Commodity producers Agricultural producers Small rms and farms Informal economy producers and traders advertising agencies or large rms with global brands Home based workers, street traders
Female labour
What to map Backwards down whole chain to retailers, buyers and producers Forwards to type of customer, backwards though buyers, producers and their suppliers Backwards to producers and their suppliers in same chain, forwards to retailers
Forwards to retailers in various nal markets, backwards to variety of producers and their suppliers
Forwards to retailing, backwards to suppliers and their suppliers Forwards to OEMs and their customers, perhaps in more than one sector; backwards to suppliers and their suppliers Forwards to customers in a variety of sectors, backwards to suppliers and their suppliers Forwards to producers, buyers and nal markets and backwards to machinery and input suppliers
Forwards to processors, buyers and their customers, backwards to input suppliers
Buyers in a range of value chains, input suppliers Forwards to processors, assemblers or third party organisers/distributors, backwards to retailers Use of female labour throughout value chain
Example
For furniture, begin with groups of customers of department and specialist stores in rich countries
For food, begin with supermarkets
For shoes, begin with specialist buyers, in fruit and vegetables with category buyers For clothing, begin with Prada and the GAP in the volume markets and to Gucci in Haute Couture markets
For autos, Ford; in consumer electronics, Sony
For autos, Magna and Delphi; in computers, with motherboard and monitor manufacturers For food, to rms printing packaging materials; in banking, to providers of software modules
For copper, to major buyers at London Metal Exchange and to suppliers to the telecoms sector Fresh vegetables to salad packers and category buyers in nal markets
16 Part 1 – Concepts
PART 2 VALUE CHAIN
ANALYSIS TOOLS -
GENERAL TOOLS
PART 3 - VALUE CHAIN
ANALYSIS TOOLS
- QUALITATIVE
TOOLS
PART 4 - VALUE CHAIN
17 Part 2 - Value Chain Analysis Tools - General Tools
A Toolbook for Practitioners of Value Chain Analysis
2
PART 2 - VALUE CHAIN ANALYSIS TOOLS
GENERAL TOOLS
Tool 1 - Prioritising Value Chains for Analysis
Contents
1. Introduction
... 19
2. Objectives
... 19
3. Key Questions
... 19
4. Steps
... 19
Step 1 Determine criteria and build understanding of priorities ... 19
Step 2 Weighting of criteria ... 21
Step 3 Identifying a list of potential products/activities ... 21
Step 4 Ranking of products/activities ... 22
5. What Should be Known after Analysis is Complete ... 24
19 Part 2 - Value Chain Analysis Tools - General Tools
A Toolbook for Practitioners of Value Chain Analysis
2
Tool 1 - Prioritising Value Chains for Analysis
1. Introduction
Prior to starting a value chain analysis it is necessary to decide which sub-sectors, products or commodities should be prioritised for analysis. As resources for undertaking analyses will invariably be limited, it is important to identify appropriate value chains for analysis and follow up activities.
2. Objectives
To involve value chain actors in the learning process and select a limited number of value chains to be analysed.
3. Key Questions
1. What are the key criteria on which to base the selection of value chains to be analysed? 2. Which value chains are most appropriate to analyse?
Participants in assessment of value chain priority
Participants involved in this exercise should have a common understanding of the value chain’s development in the region. It may be helpful to carry out a pre-evaluation by visiting sub-sectors, product or commodity partners to identify representatives, actors and/or key informants to ensure that the participants have (i) relevant knowledge and (ii) adequate representation on the value chains. It is advisable to keep participant numbers small. Likely participants are local policy and decision makers, farmers, private sector actors, service providers, development organisations and community representatives.
4. Steps
The prioritising process follows four steps that are common to processes of making allocation choices under a situation of scarce resources. The fi nal priority can be determined on the basis of the ranking obtained. For each of the following steps, two methodologies will be proposed; a rigorous participatory methodology and a less rigorous methodology that could be adopted if time and resources are limited or participatory methods are not appropriate.
Step 1 Determine criteria and build understanding of priorities
(1) Potential of the value chains to improve livelihoods of the poor people;
Present integration of the poor in the market (what are they producing, selling, employment)
Potential of the product/activity for poverty reduction Potential for labour intensive technology
Low barriers to entry for the poor (capital, knowledge) Low risk
Poverty incidence and/or absolute poverty fi gures (2) Market potential
Strong domestic and/or international demand for the product Growth potential of certain products/activities
Possibility for scaling up
Potential for leveraging public investment with private investment Involves a large number of people
(3) Other criteria, such as
The value chain actors have entrepreneurial capacity to achieve improvement. Environmental sustainability
Within framework of national and regional strategies Social inclusion and gender
Take Note
These are not the only criteria that could give a pro-poor outcome, and the list above should be viewed as a starting point for deciding which criteria to use. The criteria used will vary according to the local conditions and situation.
If time and resources permit, then the decision of which specifi c criteria to use for value chain selection should be made in a participatory manner, with discussions among participants as to which criteria are most relevant for the local conditions and requirements of the analysis. This serves to increase ownership of the process and also can strengthen common understanding among participants in identifying the potential value chains for the fi nal selection. Once selection of the criteria is agreed upon, participants should move to weighting of the criteria (Step 2).
21 Part 2 - Value Chain Analysis Tools - General Tools
A Toolbook for Practitioners of Value Chain Analysis
2
Step 2 Weighting of criteria
Some of the criteria will probably be considered to have a higher level of importance in the decision making process and so should have a greater infl uence on the ranking of value chains.
Weightings are commonly assigned in two main ways:
1. Simple numeric– for example, 1, 2, 3 or 4 - where the relative importance of criteria is in direct proportion to the numeric weighting. This means that a criterion with a weighting of 4 is considered to be twice as important as a criterion with a weighting of 2, and 4 times as important as a weighting of 1.
2. Proportional, where all of the criteria have a combined weighting of 100 %, and the relative importance of each criteria is refl ected in the proportion of the total weighting that is assigned to that criteria. For example, if there are three criteria, then they could be weighted as Criteria 1 (50%); Criteria 2 (30%) and Criteria 3 (20%).
Take Note
Regardless of which weighting system is used, a rough rule is that the more pro-poor you wish the selection of value chain to be, the higher the weighting that should be given to the criteria that emphasise pro-poor characteristics.
If time and resources permit, deciding on the weighting of the various criteria should be undertaken in a participatory manner, with inclusion of all participants in the decision making process. As was the case with the selection of criteria, this is important in building ownership of the process and increasing understanding of the reason for value chain selection. However, if time and resources are limited then the weightings for various criteria can also be pre-determined prior to a participatory identifi cation process.
Step 3 Identifying a list of potential products/activities
Once the criteria for selecting the value chain to analyse have been chosen and weighted, the next step is to make a list of all the potential value chains/ products/commodities in the geographic area under consideration. This list could be developed in a participatory manner with actors, who may or may not be the same as the actors who developed the criteria in Step 1. The value chains identifi ed are usually based on products that are already produced in the area, products which are technically feasible to produce in the area, products which have a pro-poor focus, or products that are judged to have a good market (local, regional, national or international market).
Box 1: List of potential value chains in Son La, Vietnam
The range of value chains identifi ed may be quite broad. A value chain exercise conducted by the SNV Market Access for the Poor Program in Son La Province, Viet Nam identifi ed the following value chains as having potential:
Mushroom Longan Mong apple Local rice Pumpkin Village pig
Bamboo shoots Medicinal plants Honey Handicrafts Maize
Source: (Boomsma 2006)
Take Note
The participatory process of identifying potential value chains can often result in a large number of potential chains being identifi ed. To increase the effi ciency of the value chain ranking undertaken in Step 4, it is advisable to reduce this “long list” of potential value chains to a “short list” of a more manageable size (potentially between three and six chains). The case study presented in the Useful Examples section of this tool demonstrates how this can be done.
Step 4 Ranking of products/activities
A set of criteria can be developed to differentiate between potential value chains depending on the purpose of the analysis.For example, Table 3 shows some criteria used by the International Finance Corporation Mekong Private Sector Development Facility (IFC/ MPDF) in evaluating potential value chains, while Table 4 shows alternative criteria used by the National Economic and Social Development Board of Thailand in selecting value chains for further study and development
Once the criteria have been agreed upon, relative weightings of importance can be attached to each of them. For example, it may be decided that “Poverty and Sustainability” is more important than “Structure of Chain”, so that the sub-criteria under the fi rst of these two categories are worth 70% of the total score.
Once the weightings have been determined, then a matrix for ranking the value chains can be constructed; see Table 5.
23 Part 2 - Value Chain Analysis Tools - General Tools
A Toolbook for Practitioners of Value Chain Analysis
2
Table 3: MPDF sub-sector selection criteria for value chain identification
Positive
Multi-country potential Reliable existing data available Opportunities for cooperation with other
development agencies and NGOs
Potential to attract additional funding Links to strong private sector demand IFC clients or interests
MPDF already has knowledge or expertise in the
sub-sector
Impact potential: large workforce, low income,
importance to the economy etc.
Presents expansion and replication opportunities No clear MPDF role
“Overcrowded”
Previous negative experience Risk, reputation
Previous negative experience Risk, reputation
Impact time frame too long Insufficient resources
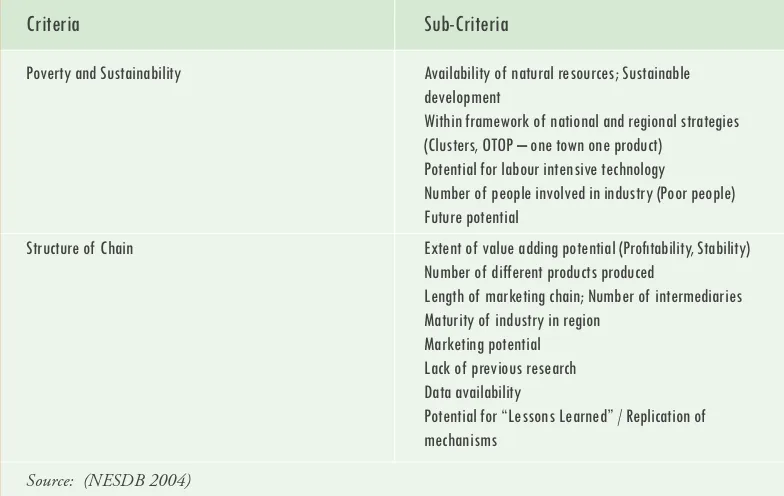
Table 4: NESDB sub-sector selection criteria for value chain
identification
Sub-Criteria
Availability of natural resources; Sustainable development
Within framework of national and regional strategies (Clusters, OTOP – one town one product)
Potential for labour intensive technology
Number of people involved in industry (Poor people) Future potential
Extent of value adding potential (Profitability, Stability) Number of different products produced
Length of marketing chain; Number of intermediaries Maturity of industry in region
Marketing potential Lack of previous research Data availability
Potential for “Lessons Learned” / Replication of mechanisms
Criteria
Poverty and Sustainability
Structure of Chain
Table 5: Matrix ranking of products by scoring
Take Note
If there are a large number of criteria, participants, or value chains, more data is generated by the ranking process. Allow enough time to calculate the fi nal rankings.
5. What Should be Known after Analysis is Complete
After completing these four steps, one should have a thorough understanding of the potential value chain development in the region and which value chains have a high pro-poor potential and market demand.
From experience we can say that, in general, value chains which call for: • high levels of investment
• use high levels of knowledge and technology
• demand for high risk taking strategies are not pro-poor.
Useful Examples
Example 1: Value chain selection in Thailand.
A participatory priority setting exercise was carried out with staff from the National Economic and Social Development Board of Thailand (NESDB) staff and the North-East Economic Development Project (NEED) Steering Committee (NESDB 2004). Six commodities (rice, cassava, rubber, beef, silk, and broilers) were evaluated against 13 criteria; fi ve criteria addressing the dimension of poverty alleviation and sustainability against the backdrop of the national strategies, and eight criteria addressing the dimension of the value chain structure.
Once the criteria were defi ned by the Steering Committee, the commodities were ranked against each criterion. Each commodity was ranked in relation to the other commodities. In this example there were six commodities and therefore a score of 6 meant that the particular commodity best met that criterion, and a score of 1 meant that the commodity did not meet that criterion.
Each criterion was evaluated through consensus of the Steering Committee. Once each criterion was evaluated, a simple average score was calculated, and the commodities ranked accordingly; see Table 6 below.
Criteria Weighting (%) Value Chain 1 Value Chain 2 Value Chain 3
Criteria 1 50 %
Criteria 2 15 %
Criteria 3 20 %
25 Part 2 - Value Chain Analysis Tools - General Tools
A Toolbook for Practitioners of Value Chain Analysis
2
The results of the priority setting exercise indicated that silk and rice were the twocommodities most appropriate for study under the pilot project.
Table 6: Participatory commodity priority setting exercise results
Poerty and Sustainability
Structure of Chain
Dimension Criteria Rice Cassava Rubber Beef Silk Broilers
Availability of natural 4 1 2 5 6 3 resources; Sustainable
development
Within framework of national 4 2 5 1 6 3 and regional strategies
(Clusters, OTOP – one town one product)
Potential for labour intensive 4 3 5 1 6 2 technology
Number of people involved in 6 5 1 2 4 3 industry (Poor people)
Future potential 3 2 6 1 5 4 Sub-Total Poverty and 4.2 2.6 3.8 2.0 5.4 3.0 Sustainability
Extent of value adding 3 2 5 1 6 4 potential (Pro tability, Stability
Number of different products 2 5 4 1 6 3 produced
Length of marketing chain; 1 5 4 3 6 2 Number of intermediaries
Maturity of industry in region 5 4 1 2 6 3 Marketing potential 4 2 3 1 6 5 Lack of previous research 1 4 5 6 3 2 Data availability 6 4 1 2 3 5 Potential for “Lessons 5 3 2 1 6 4 Learned” / Replication of
mechanisms
Subtotal Chain Structure 3.4 3.6 3.1 2.1 5.2 3.5 Ranking 3.8 3.2 3.4 2.1 5.3 3.3
27 Part 2 - Value Chain Analysis Tools - General Tools
A Toolbook for Practitioners of Value Chain Analysis
2
Tool 2 - Mapping the Value Chain
Contents
1. Introduction ...29 2. Objectives ...29 3. Key Questions ...29
4. Steps
... 29
Step 1 Mapping the core processes in the value chain ...30 Step 2 Identifying and mapping the main actors involved in the processes ...32 Step 3 Mapping ows of products ...23 Step 4 Mapping knowledge and ows of information ...30 Step 5 Mapping the volume of products, numbers of actors and jobs ...31 Step 6 Mapping the geographical ow of the product or service ...33 Step 7 Mapping the value at different levels of the value chain ...40 Step 8 Mapping relationships and linkages between value chain actors ...40 Step 9 Mapping services that feed into the value chain ...41 Step 10 Mapping constraints and potential solutions ...42 Step 11 Making a value chain map matrix ...43
29 Part 2 - Value Chain Analysis Tools - General Tools
A Toolbook for Practitioners of Value Chain Analysis
2
Tool 2 - Mapping the Value Chain
1. Introduction
After initial selection of value chains is complete (Tool 1), the next step is to map the value chain. This is a vital step in guiding the analysis of selected value chains. This chapter provides the tools and examples on how to capture the different dimensions of a value chain. To understand the value chain that is to be analysed, models, tables, fi gures and diagrams are used: ‘A picture is worth a thousand words’. Making a value chain map is a way of making what is seen and encountered more easily understood. This chapter provides tools and examples on how to capture the different dimensions of a value chain.
2. Objectives
Mapping the value chain has a number of objectives:
Gain a basic overview of the value chain to guide the full value chain analysis to be undertaken
Identify constraints and possible solutions at different levels in the value chain Identify the location and position of the poor in the value chain
Visualise networks to get a better understanding of connections between actors and processes
Demonstrate interdependency between actors and processes in the value chain Create awareness of actors to look beyond their own involvement in the value chain
3. Key Questions
There is no such thing as a comprehensive, all-encompassing value chain map. There are many potential dimensions of the value chain that could be included in an initial mapping exercise: the product fl ows, the actors involved in the chain, costs and margins at different levels, etc. Therefore it is crucial to choose which dimensions are to be mapped, based on the available resources, the scope and objective of the value chain analysis and the mandate of the organisation.
The following questions can guide what dimensions to map:
What are the core processes in the value chain?
Who are the actors involved in these processes and what do they actually do? What are the fl ows of product, information and knowledge in the value chain? What is the volume of products, the number of actors and jobs?
Where does the product (or service) originate from and where does it go? How does the value change along the chain?
What types of relationships and linkages exist? What types of services are feeding into the chain?
What is the location and position of the poor in the value chain?
What key constraints exist at various levels in the chain and what are potential solutions to those constraints?
These questions will be used to provide the basis for the steps described this chapter.
Take Note
Many of the mapping dimensions covered in this tool are also addressed in other tools in this book. The difference lies in the depth of the analysis. The mapping tool is designed to provide an initial overview of the key aspects of the value chain. This initial overview will be used to guide the subsequent analysis of the chain, based on the later tools in this book.
In all dimensions that need to be mapped, the practitioner is to consider the position and role of the poor as actors in the value chain.
4. Steps
Step 1 Mapping the core processes in the value chain
The fi rst question that must be asked in any value chain analysis is what the different (core) processes in the value chain are. In other words, what processes occur from inputs to raw material through to fi nal consumption of end products?
The fi rst step is to fi nd the core processes in your value chain. As a rough guide, try to distinguish a maximum of six or seven major processes that the raw material goes through before it reaches the fi nal consumption stage, including the provision of inputs to produce raw materials. These core processes will differ, depending on the characteristics of the chain you are mapping: industrial products undergo different phases compared to agro-products or services.
Box 2: Example of mapping core processes
One of the main products in Ninh Binh province, Vietnam is handicrafts made of sedge or sea grass. Typically, boxes or baskets are produced for export markets. As an example, the core processes in the basket export chain are as follows.
Source: Sedge handicrafts in Ninh Binh, SNV 2005.
The example in Box 2 above shows a relatively simple linear value chain, with two major fi nal products (baskets or boxes) produced from the raw material (sea grass). However, for many value chains there are more than one or two products produced from the initial raw material, each of which will follow its own set of processes to fi nal consumption. In these cases the process map will be more complex, and involve parallel sets of processes. An example of this type of value chain is cassava, where the fi nal product could be cassava chips for animal feed, or cassava starch for numerous end uses. Figure 5 below shows the potential complexity of a full map of value chain processes.
Input
31
Figure 5: Example of mapping core processes in the cassava value chain.
This value chain demonstrates the potential complexity of a chain where there are numerous end products.
Exporters
Is the best way to view the map vertical or horizontal? Depending on the context, a choice needs to be made. There is no right or wrong. Regardless of which choice is made, try to be consistent throughout the analysis.