CHAPTER IV
RESULT AND DISCUSSION
In this chapter, descriptive analyses were used
to identify the respondents’ big five personality.
Frequencies were computed for the independent as
well as the dependent variables, the two stock
categories, value stock and growth stock. It also
provided the results of the hypothesis tests. The
results from regression analyses were used to identify
the investors’ stock preference.
A. RESULT
1. Descriptive Statistics
Respondents’ Big Five Personality Types
The big five personality types consisted of
neuroticism, extravert, openness to experience,
conscientiousness, and agreeableness. However,
among five personalities, agreeableness would not be
investigated in this study since the previous research
found that agreeableness did not influence the
tendency to prefer certain stocks. There were about
of big five personality types. The result of investors’
big five personality types could be seen in table 4.1.
Among twelve statements, the total average was
3.39. It meant that most of the investors are in the
medium of all personality types. For the neuroticism,
there were 58.7% investors at the level of low
neuroticism. Thus, most of investors did not really
worry about their investment, which would influence
their decision making process. In addition there were
61.9% of the investors were in the high level of
extraversion. Individual in this level indicated that
they are highly motivated and risk takers. While for
openness to experience, there were a slightly different
percentage of low and high openness, 49.2% of low
openness and 50.7% for high openness. With this
result, it could be stated that the investors did not
have any tendency to be low or high openness.
Furthermore, 41.3% high level of openness, which
meant that only a few of the investors had creative
idea and enjoy new experience. Finally, 53.9% were in
the low level of conscientiousness, which meant that
most of the investors had a mature planning of their
investment and also good management of their own
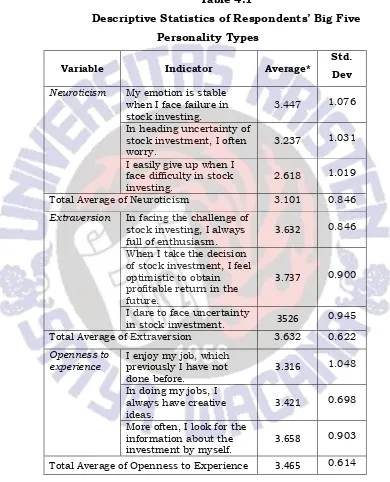
Table 4.1
Descriptive Statistics of Respondents’ Big Five
Personality Types
Variable Indicator Average*
Std. Dev Neuroticism My emotion is stable
when I face failure in stock investing.
3.447 1.076
In heading uncertainty of stock investment, I often worry.
3.237 1.031
I easily give up when I face difficulty in stock investing.
2.618 1.019
Total Average of Neuroticism 3.101 0.846
Extraversion In facing the challenge of stock investing, I always full of enthusiasm.
3.632 0.846
When I take the decision of stock investment, I feel optimistic to obtain profitable return in the future.
3.737 0.900
I dare to face uncertainty
in stock investment. 3526 0.945
Total Average of Extraversion 3.632 0.622
Openness to experience
I enjoy my job, which previously I have not done before.
3.316 1.048
In doing my jobs, I always have creative ideas.
3.421 0.698
More often, I look for the information about the investment by myself.
3.658 0.903
Variable Indicator Average*
Std. Dev
Agreeable-ness
I tend to easily trust someone when he/she offers me the stock investment.
2.803 1.071
The excessive money I have will be better to be invested than to help others.
3.408 1.009
Before deciding to invest, I
often argue with others. 3.289 1.017 Total Average of Agreeableness 3.167 0.685
Conscien-tiousness
I always examine the risk as well as the profit of stock investment I will take.
3.671 0.900
Before deciding to invest in stocks, I do not need a lot of time to think of.
3.303 0.994
I have well-done planning
in stock investment 3.724 0.826
Total Average of Conscientiousness 3.566 0.566 Source: Primary Data, 2013
Note: * The answers’ interval categories: 1.00-1.80 (very low); 1.81-2.60 (low); 2.61-3.40 (medium); 3.41-4.20 (high); 4.21-5.00 (very high).
The data above explained that mostly investors
were at the medium level of neuroticism, openness to
experience and agreeableness. It was explained by the
average result, which was around the interval
2.61-3.40. While for extraversion and Conscientiousness,
the investors were at the level of high
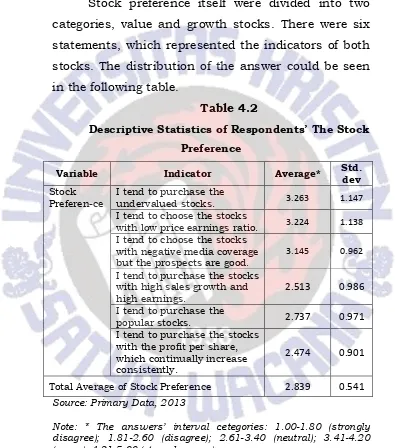
Stock Preferences
Stock preference itself were divided into two
categories, value and growth stocks. There were six
statements, which represented the indicators of both
stocks. The distribution of the answer could be seen
in the following table.
Table 4.2
Descriptive Statistics of Respondents’ The Stock
Preference
Variable Indicator Average* Std.
dev Stock
Preferen-ce
I tend to purchase the
undervalued stocks. 3.263 1.147
I tend to choose the stocks
with low price earnings ratio. 3.224 1.138 I tend to choose the stocks
with negative media coverage but the prospects are good.
3.145 0.962
I tend to purchase the stocks with high sales growth and high earnings.
2.513 0.986
I tend to purchase the
popular stocks. 2.737 0.971
I tend to purchase the stocks with the profit per share, which continually increase consistently.
2.474 0.901
Total Average of Stock Preference 2.839 0.541 Source: Primary Data, 2013
The above data showed that most of the
investors were at the level of neutral. In other world,
there were slightly similarities in stock preference,
because the average of both growth stocks and value
stocks were in the level of neutral criteria.
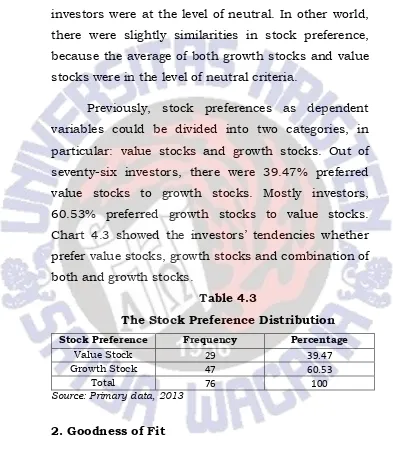
Previously, stock preferences as dependent
variables could be divided into two categories, in
particular: value stocks and growth stocks. Out of
seventy-six investors, there were 39.47% preferred
value stocks to growth stocks. Mostly investors,
60.53% preferred growth stocks to value stocks.
Chart 4.3 showed the investors’ tendencies whether
prefer value stocks, growth stocks and combination of
both and growth stocks.
Table 4.3
The Stock Preference Distribution
Stock Preference Frequency Percentage
Value Stock 29 39.47
Growth Stock 47 60.53
Total 76 100
Source: Primary data, 2013
2. Goodness of Fit
Prior the hypotheses testing, the regression
model’s goodness of fit should be measured. There
measured, in particular: normality, absence of
multicollinearity, and the absence of autocorrelation.
Normality was a test to see whether there was
normal distribution or not. The result of
Kolmogorov-Smirnov test showed that the score was 0.676 and
significant at the level of 0.750. It meant that the
Kolmogorov-Smirnov Z was less than the significance,
which meant that the data normally distributed.
The absence of multicollinearity test used to
test the model whether any correlation
inter-independent variables. The coefficient correlation
showed that the variable extraversion had the highest
correlation above all -.430 or 43%. This correlation
was under 95%, so the multicollinearity was not
serious. From the coefficient table (see appendix 8)
the tolerance score was under 0.10 and the Variance
Inflation Factor (VIF) was under 95%. Thus this
model was adequate to see the influence of the
independent variables towards the dependent
variable.
Then, to see the absence of autocorrelation,
this study would see the Durbin-Watson score. The
score was 1.992. This score was greater than 1.227
from the Durbin-Watson table. Thus, there was no
However, since the result of some goodness of
fit did not show the good result, in the following
subchapter provided three kinds of analyses. The
analyses consisted of numerical, logs, and binary
analyses.
3. Hypotheses Testing
To test the hypotheses, regression was used.
Below was provided the result of the regression for
numerical, logs and binary analyses. The log data
was used to examine the model, which were not
normally distributed. Whereas, binary data was used
to examine the model in which this analysis was used
to see equates numbers of respondents of each
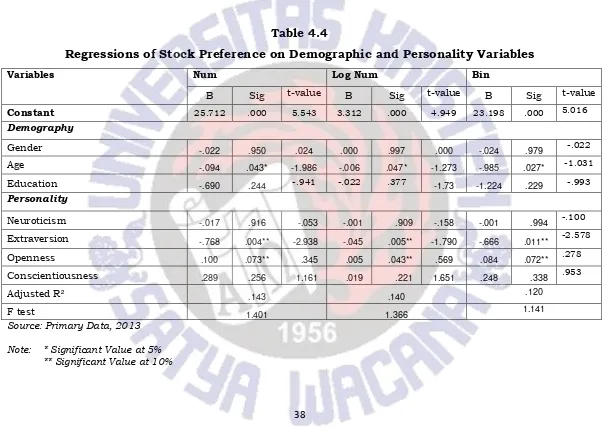
Table 4.4
Regressions of Stock Preference on Demographic and Personality Variables
Variables Num Log Num Bin
B Sig t-value B Sig t-value B Sig t-value
Constant 25.712 .000 5.543 3.312 .000 4.949 23.198 .000 5.016
Demography
Gender -.022 .950 .024 .000 .997 .000 -.024 .979 -.022
Age -.094 .043* -1.986 -.006 .047* -1.273 -.985 .027* -1.031
Education -.690 .244 -.941 -.022 .377 -1.73 -1.224 .229 -.993
Personality
Neuroticism -.017 .916 -.053 -.001 .909 -.158 -.001 .994 -.100
Extraversion -.768 .004** -2.938 -.045 .005** -1.790 -.666 .011** -2.578
Openness .100 .073** .345 .005 .043** .569 .084 .072** .278
Conscientiousness .289 .256 1.161 .019 .221 1.651 .248 .338 .953
Adjusted R² .143 .140 .120
F test 1.401 1.366 1.141
Source: Primary Data, 2013
The table above showed the result of the
regression with three analyses in particular:
numerical, log and binary. The adjusted R² was in the
range of 12% up to 14.3%, meant that the variability
of dependent variable could be explained 12%-14.3%
by the variability of independent variables. While,
85.7 % of the variability would be explained by other
variables outside the demographic factors and
personality traits, in particular the excessive cash
flow the investors owned and the emotion stability.
Although the R² value was relatively small, the F test
for this model showed the result 1.401 up to 1.366
and significant at .000. That meant that the
independent variable simultaneously influence the
income. Furthermore, the result of F-test showed the
linearity of the model, where the F-test were bigger
than F-table (1.27), meant that this model was linear.
Among three demographic factors, which
consisted og age, gender and education, only age was
significantly influence the stocks preference. With the
significant value expected was less than 5%, the
numeric analysis’ result showed that age was
significant towards the stock preference, with the
significant value 0.043. Both numeric and logs
stock preference. Even though it was significant, the
coefficient was negative, which meant that the elder
investors tend to prefer growth stocks instead of
value stocks. Thus, the hypothesis H1a that the elder investors tend to prefer value stocks was not
acceptable. In addition, gender and education did not
significantly influence to stock preference because
gender had significant value at 0.950 and Education
0.244, which more than 5%.
Furthermore, the personality types, which were
tested, consisted of neuroticism, extraversion,
openness, and conscientiousness. With the
significant value expected was less than 10%. Among
five personality being tested, extraversion and
openness was significantly influence the stock
preference. Extraversions had significant value at
0.004. The expected significant value was 10%. It
meant that extraversions were significant toward
stock preferences. The coefficient was -0.768. The
negative coefficient showed that the extraversions
tend to prefer growth stocks. Thus, the hypothesis
H3: Investors with extraversions tend to prefer
growth stocks, was acceptable. Openness had
significant value at 0.073. The coefficient was
prefer value stocks. Therefore, H4: Investors with openness tend to prefer value stocks, was acceptable.
B. Discussion
In making a choice such as stock preference,
investors were led by some aspects. One of them was
demographic features. Mayfield, Perdue and Wooten
(2008) stated that demographic features provide the
explanation of investment management decisions.
This study explored the influence of demographic
features, for instance: age, gender, and education
toward the investors’ stock preference, whether they
prefer value or growth stocks.
Age described their actual number of age as
well as how long the investors experiencing stock
investment, level of certainty and emotional stability
the investors possessed. However, this study only
focused on the actual number of investors’ age.
Normally, the elder investors would prefer the value
stocks. Moreover, Deaves and Bhandari (2006) stated
that the investors who closely to the retirement will
hold the long-term investment. It meant that the
elder investors supposed to prefer value stocks. The
result of this study showed that age was significantly
positive impact towards growth stocks. This could
happen because their experience was not adequate to
predict the value stock prospects. Their lack of
experience might be influenced by how long they were
engaged in stock investment, which mostly not more
than two years. Most of the investors involved in this
study were beginners. Those investors started the
investment after 2012 (27%).
Moreover, in this study, gender and education
were not significantly influence the stock preference.
Though in previous studies such as Bhandari &
Deaves (2006) who stated that women had less
certainty, but men were more overconfident than
women, proved that men supposed to hold growth
stocks. However, according to Mayfield, Perdue, and
Wooten (2008), men tend to prefer both short-term
and long-term investment. In other words, men were
likely to engage in either value or growth stocks.
The result of this study showed that gender did
not influence the stock preference, which might
happen because of their investors’ marital status,
which 44% of them were men and married. The
hypothesis that men tend to prefer growth stocks
were not proven because married men tended to
explained that the amount of both gender were not
balance. Women investors, who preferred value
stocks were 9.2%, while for men investors 30.2%.
Women investors, who preferred growth stocks were
13.1%, while men investors 47.4%.
The third one of demographic features involved
in this study was education. Education also played
important role in decision-making process. According
to Bhandari & Deaves (2006), higher education levels
were associates with certainty. The more highly
educated the investors, the more certain they are, the
more risk takers they are. Unfortunately, this study
showed that education did not significantly influence
the stock preference. The cross tabulation data
showed that most of the investors were in the group
of bachelor degree, which were 51.3%. While, the
group of investors not included in the group of
bachelor degree were in the small percentage. Thus,
the result did not significant. Another factor of
education, which might play important role to prove
that education was not significant, was that the
investors came from various background of the study.
Their background of education was probably not
sufficient to support the investors’ ability in stock
The other aspects, which might influence stock
preference, were the investors’ personality, which was
measured by using the big five personality traits. The
big five personality traits was a viable approach for
examining economic behavior (Mayfield, Perdue, and
Wooten, 2008). This study only used four of them to
determine whether the personality traits influence the
stock preference or not.
Two personalities, neuroticism and
conscientiousness did not significantly influence the
stock preference, though it had positive impact
towards growth stock preference. Mayfield, Perdue,
and Wooten (2008), and Jamhidinavid, Chavoshani,
and Amiri (2012) stated that investors with
neuroticism were indicated by having anxiety,
unstable emotion, moodiness, and tenseness.
Investors in this type surely would avoid risk as well
short-term investment in order to avoid nervous and
tenseness. Thus, investors with neuroticism would
probably tend to prefer value stock. However, the
result of this study did not prove the previous
studies. It might be influenced by the unstable
emotion triggered the feeling of avoid loss.
In addition, conscientiousness was indicated by
and strong willed (Mayfield, Perdue and Wooten,
2008). Furthermore, Jamhidinavid, Chavoshani, and
Amiri (2012) stated that investors in this type
believed that their own performance in investments
were better than the other investors. Thus, the
investors with conscientiousness supposed to prefer
growth stocks. The analysis of this study proved
conversely, where the investors prefer value stocks to
growth stocks. It might happen because the investors
in this type were seeking for excellence, so they could
predict the undervalue stocks and its potential to rise
up.
The rests personality, extraversions and
openness to experience clearly gave significant
influence towards stock preference. Extraversion,
according to Mayfield, Perdue, and Wooten (2008)
and Peterson (2011), agreed that extraversion was
people who had characteristics as enthusiasm,
optimistic, seeking excitement, social and emotional
ability to achieve positive feelings. Investors in this
type were more likely to be risk averse. In addition,
Larson (2005) found that investors with extraversions
engaged to long-term investing. While,
Jamshidinavid Chavoshani, and Amiri (2012) stated
excitement tend to be very confidence to take risk.
Thus, investors in this type tend to prefer growth
stocks. This study’s result showed the same premise
with previous studies that extravert investors prefer
growth stocks.
At the final was openness to experience is
characterized by both imagination and intellectual
expression (John and Srivastava, 1999).
Furthermore, Mayfield, Perdue, and Wooten (2008)
stated that investors who are categorized in openness
were likely engaged in long-term investing. While,
Jamshidinavid, Chavoshani, and Amiri (2012) stated
that the investors with openness meant that
individuals interested in novelty and new
experiences, action-oriented, and curious about
others’ ideas buy and sell their shares because of
their high confidence. Investors in this type of
personality trait might engage in long-term
investment, which referred to value stocks. Thus, the
hypothesis that investors with openness tend to
prefer value stock was proven.
Some of demographic factors and personality
traits did not adequately prove the hypotheses. It was
probably because most of the investors were
most of investors were getting information from their
friends or colleagues. It meant that the social
interaction may influence the investors stock
preference. Nofsinger and Hirschey (2008)
emphasized that people often leant by interacting
with others. When investors learn what others think,
herding happened. Consequently, when herding
movement happened, most of investors took decision
based on what happen in their group. The
demographic factors and investors’ personality
seemed not play important role in decision-making