Full Terms & Conditions of access and use can be found at
http://www.tandfonline.com/action/journalInformation?journalCode=vjeb20
Download by: [Universitas Maritim Raja Ali Haji] Date: 13 January 2016, At: 00:04
Journal of Education for Business
ISSN: 0883-2323 (Print) 1940-3356 (Online) Journal homepage: http://www.tandfonline.com/loi/vjeb20
Assessing Success on the Uniform CPA Exam: A
Logit Approach
Tantatape Brahmasrene & Donna Whitten
To cite this article: Tantatape Brahmasrene & Donna Whitten (2001) Assessing Success on the Uniform CPA Exam: A Logit Approach, Journal of Education for Business, 77:1, 45-50, DOI: 10.1080/08832320109599670
To link to this article: http://dx.doi.org/10.1080/08832320109599670
Published online: 31 Mar 2010.
Submit your article to this journal
Article views: 36
View related articles
Assessing Success on the Uniform
CPA Exam:
A
Logit Approach
TANTATAPE
BRAHMASRENE
DONNA WHllTEN
zyxwvutsrqponmlkjihgfedcbaZYXWVUTSRQPONMLKJIHGFEDCBA
Purdue University North Central Westville, Indiana 11 states require students to pass the
A
Uniform Certified Public Accoun- tant (CPA) Examination to become licensed. The examination is given twice each year, in May and November. Suc- cessful passing of the exam indicates that the student possesses the knowledge nec- essary for beginning practice in this field. Success rates for the Uniform CPA Examination remain relatively low com- pared with other certification exams. For example, Bar Examination pass rates in Arizona ranged from 69.9% in 1996 to more than 80% in 1997 (Supreme Court of Arizona, 1996, 1997). In 1999, pass rates for the February Bar Examination in Arkansas hovered at 50% (Lovel, 1999) and then slid to 48% for the Feb- ruary 2000 exam (Moritz, 2000). The Uniform CPA Examination pass rates have traditionally remained much lower. The overall pass rate for the May 2000 CPA Examination administered in Indi- anapolis, Indiana was 17.82% (or 168 out of 943 candidates). The number was lower for first-time candidates, of which 2.23% (or 21 candidates) passed all four parts, whereas the number of re-exam passing was 15.59% (or 147 candidates). The overall pass rate for the November 2000 CPA Examination administered in the same location was 16.86% (or 163 out of 967). The number was lower for first-time candidates, of which 1.76% (or 21 candidates) passed all four parts,ABSTRACT. In this study, the authors surveyed Indiana certified public accountant (CPA) candidates to investigate factors that may determine the likelihood of passing the Uniform CPA Exam. The authors used a logit model to test the likelihood of success in the exam as a function of factors such as undergraduate grade point average (GPA), credit hours, high school GPA, high school class size, age, high school rank, educational level, type of preparation, nature of experience, gender, and race. By and large, a full model and the models resulting from forward and backward stepwise selection indicated that undergraduate GPA, age, private accounting experience, and gender are significant determinants in success in the CPA exam.
whereas the number of re-exam passing was 15.09% (or 146 candidates).
Normally, the first-time, sitting pass rate is reported to hover around 10%. Recently, this number has been lower for these exams, in part because of the 150-hour rule. Probably fewer exam takers were prepared, and they were not representative of previous exams prior to the 150-hour rule. However, the over- all rate had decreased only slightly.
In this study, we surveyed Indiana CPA candidates to investigate factors that may determine the likelihood of passing the exam. A comparison of our results with those from other studies provided some insight into how region-
al factors might produce different results.
Relatively few studies have been con- ducted to determine factors that con- tribute to success on the Uniform CPA Examination. A 1989-1990 study of Iowa CPA candidates indicated that grades received on CPA review courses, high school class size, and rank were significant factors in exceptional perfor- mance, which is defined as passing all
four parts on the first sitting (Ashbaugh
zyxwvutsrqponmlkjihgfedcbaZYXWVUTSRQPONMLKJIHGFEDCBA
& Thompson, 1993). In a previous study of Pennsylvania CPA candidates sitting for the November 1978 exam, Zook and Bremser (1982) concluded that accounting courses, number of hours spent studying for the exam, review courses, overall grade point average (GPA), vocational experience in accounting, and performance in mathe- matics, computer science, and law courses contributed to success on pass- ing each section individually. The results indicated that the number of hours a candidate studied before taking the exam, participation in a review course, and high school SAT scores were all positively correlated to passing one or more parts.
Our study expands earlier research in a number of ways. First, because the format of the exam has changed since the two previous studies, we address rel-
evant factors that contribute to success
zyxwvutsrqponmlkjihgfedcbaZYXWVUTSRQPONMLKJIHGFEDCBA
on the Uniform CPA Exam in its current format. Second, we gather information from the previous studies and present new hypothesized factors. Finally, we provide information on a state not cov- ered in previous studies and thus can also
explore potential regional differences.
zyxwvutsrqponmlkjihgfedcbaZYXWVUTSRQPONMLKJIHGFEDCBA
Theoretical Model
In previous studies, discriminant analysis has been used to define mathe- matical functions that could distinguish successful members of a population of graduate engineering students (Mal-
strom, Klecka,
zyxwvutsrqponmlkjihgfedcbaZYXWVUTSRQPONMLKJIHGFEDCBA
& Shell, 1984). In addi- tion, it has been used to facilitate theselection of college freshman (Krishnan
& Cleland, 1973). In discriminant
analysis, the assumption
zyxwvutsrqponmlkjihgfedcbaZYXWVUTSRQPONMLKJIHGFEDCBA
of multivariate normality of the independent variablesand equal variance-covariance matrices in the two groups are required for the prediction rule to be optimal. The logis- tic regression model used in our study requires fewer assumptions than does discriminant analysis. Indeed, logistic regression performs well even though the assumptions required under discrim- inant analysis are satisfied (Hosmer &
Lemeshow, 1989).
Ultimately, we present a model that tests the likelihood of success on the CPA exam as a function of the relative determinants specified below. The dependent variable is a binary variable equal to one for successful outcome and zero otherwise. Therefore, we used a logistic regression technique to estimate the probability of the candidates’ suc- cess in May 1999. In logistic regression, the probability of an event occurring or
success in this study
zyxwvutsrqponmlkjihgfedcbaZYXWVUTSRQPONMLKJIHGFEDCBA
(Pi)
can be estimat- ed directly from a set of independentvariables. The logistic regression model can be written as
In (q/l -
9 )
zyxwvutsrqponmlkjihgfedcbaZYXWVUTSRQPONMLKJIHGFEDCBA
= BozyxwvutsrqponmlkjihgfedcbaZYXWVUTSRQPONMLKJIHGFEDCBA
+
B,Xjwhere B<, and Bi are coefficients estimat- ed from the data and X i are independent
variables. We developed the conceptual framework herein to investigate how the likelihood of passing the CPA exam is determined ultimately by the specified determinants. In Tables 2 and 3, we pro-
vide a model. We describe the variables to be used in the estimations and the data sets.
Data
Our data source was an original sur- vey of candidates who took the May 1998 Uniform CPA exam in Indiana. We chose this time period to represent the exam before the additional educa- tional requirement (150-credit-hour rule) went into effect in January 2000 for the May 2000 exam. We obtained a list of all 1,072 Indiana candidates from the National Association of State Boards of Accountancy (NASBA). There were 402 first-time candidates, and 12.9% of those passed all four parts. Among 670 repeat candidates, 24% suc- cessfully completed all four parts, including parts that may have been passed on a conditional status during previous sittings. Overall, 20% succeed- ed in passing all four parts, regardless of the number of sittings. The survey was mailed to all 1,072 May 1998 Indiana CPA candidates in October 2000. By the end of the survey completion period in January 2001, 138 envelopes were returned as undeliverable. The number of returned surveys totaled 238, indicat- ing a response rate of 26%. Of those surveys completed and returned, 7 had one or more items on the survey left blank. Therefore, 23 1 observations were analyzed.
Dependent Variable
Outcome is a dichotomous dependent variable that equals I for success and 0 otherwise. According to the NASBA, passed status requires the candidate to achieve at least 75% on all four parts. Candidates attaining a conditional sta- tus are successful on at least two parts but are not considered to have passed the exam and must repeat the failed sec- tions. Conditional status requires the candidate to have achieved a score of at least 50% on all four parts and at least 75% on two parts. The candidate could return for a maximum of six consecu- tive examinations, or within 3 years, and take only the sections for which he or she had not received credit. One deter- mination that we had to make for this study was whether to consider a candi- date attaining conditional status on this exam as having a successful outcome or an unsuccessful outcome.
Several factors influenced this deci- sion. First, we determined that a candi- date who attained conditional status had to perform nearly as well as a candidate who passed on this sitting. Second, such a candidate was considered to have “passed” two or more sections. Because the focus of the study was to determine factors that led to success, not necessar- ily passing, we determined that individ- uals who attained conditional status had more in common with those who passed all four parts on the first sitting or passed after attaining conditional status than with those who failed all four parts. Candidates who successfully attain a “pass” status generally do so after repeated sittings. Therefore, a candidate who had attained conditional status on this exam would be considered to have achieved a successful outcome.
Independent Variables
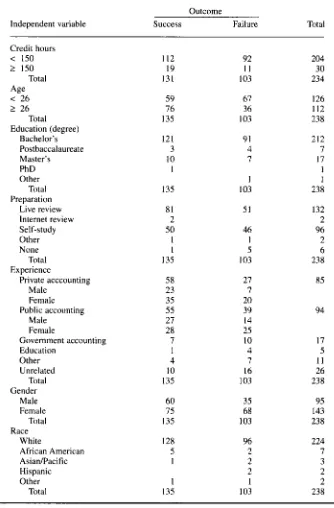
The 11 independent variables included in the model were either con- tinuous or categorical. Continuous variables included undergraduate GPA, credit hours, high school GPA, high school class size, and age. Other remaining variables were categorical; with the exception of gender, the cate- gorical variables contained more than two categories. Hence, we used an indicator-variable coding scheme to create new variables for high school rank, educational level, type of prepa- ration, nature of experience, and race. In Table 1, we present the cross-tabula- tion of selected variables to investigate the relationship among them. Data per- taining to the various factors in Table 1 are presented in actual raw numbers, not in percentages. Additional nature and characteristics of variables are
described as follows:
zyxwvutsrqponmlkjihgfedcbaZYXWVUTSRQPONMLKJIHGFEDCBA
UGPA. The average undergraduate GPA of the respondent in this survey was 3.3 on a 4.0 scale. Higher GPA was expect- ed to increase the likelihood of success.
CRHR. Number of credit hours com-
pleted at the baccalaureate level was divided between those attaining fewer than 150 credit hours and those attain- ing 150 credit hours or more at the time of this sitting. We chose the 150-credit- hour division to provide baseline num-
TABLE 1. Crosstabulatlon of Selected Variables by Outcome
zyxwvutsrqponmlkjihgfedcbaZYXWVUTSRQPONMLKJIHGFEDCBA
OutcomeIndependent variable Success Failure Total
Credit hours
zyxwvutsrqponmlkjihgfedcbaZYXWVUTSRQPONMLKJIHGFEDCBA
< 150 112 92 204
zyxwvutsrqponmlkjihgfedcbaZYXWVUTSRQPONMLKJIHGFEDCBA
2 150 19 1 1 30 Total 131 103 234 Age
< 26 59 67 126
zyxwvutsrqponmlkjihgfedcbaZYXWVUTSRQPONMLKJIHGFEDCBA
t 26 76 36 112 Education (degree)
Total 135 103 238 Bachelor’s 121 91 212 Postbaccalaureate 3 4 7 Master’s 10 7 17 PhD 1 1
Other 1 1
Total 135 103
zyxwvutsrqponmlkjihgfedcbaZYXWVUTSRQPONMLKJIHGFEDCBA
238Preparation
Live review 81 51 I32 Internet review 2 2 Self-study 50 46 96 Other 1 I 2
None I
zyxwvutsrqponmlkjihgfedcbaZYXWVUTSRQPONMLKJIHGFEDCBA
5 6 Total 135 103 238Private acccounting 58 27 85
Public accounting 55 39 94 Experience
Male 23 7 Female 35 20 Male 27 14
Female 28 25
Government accounting 7 10 17 Education 1 4 5
Other 4 7 1 1
Unrelated 10 16 26 Total I35 103 238 Gender
Male 60 35 95 Female 75 68 143 Total 135 103 238 Race
White 128 96 224 African American 5 2 7 AsiadPacific 1 2 3 Other 1 1 2 Hispanic 2 2 Total 135 103 238 bers for future research concerning the
implementation of the 150-credit-hour rule as a new requirement for sitting for the Uniform CPA Examination. As of this exam, 87.2% of respondents had attained less than 150 credit hours and represented 85.5% of those achieving a successful outcome and 89.3% of those who were unsuccessful. Similarly, 12.8% had 150 credit hours or more and represented 14.5% and 10.7%, respec- tively, of successful and unsuccessful candidates. The average undergraduate
credit hours for respondents in this sur- vey was 135. We included this variable to determine whether credit hours would have a significant effect on the candidate’s outcome on the exam.
AGE. The ages of the respondents were
divided into two categories. Those who were under 26 years of age, the typical age of the traditional full-time student upon exam candidacy, and those who were 26 or older at the time of this sit- ting. The average age of the samples
was 29. Though 52.9% of the respon- dents were under age 26, they made up only 43.7% of those achieving a suc- cessful outcome and 65% of those who were unsuccessful. In contrast, 47. I %
were 26 or older but made up 56.3% of successful candidates and only 35% of unsuccessful ones. We anticipated that age would vary directly with the log of odds of success.
HSGPA. The average high school GPA
of the respondents was 3.4, a score only slightly higher than the average college GPA. Students with a greater high school GPA were disproportionately represented as candidates. Increased high school GPA was expected to increase the likelihood of success.
HSSIZE. We included high school class
size along with the high school class rank. As suggested by Ashbaugh and Thompson (1993), inclusion of high school class rank without the considera- tion high school class size in an analysis results in output of limited value. The
average reported high school class size
zyxwvutsrqponmlkjihgfedcbaZYXWVUTSRQPONMLKJIHGFEDCBA
of the respondents was 275.
HSRANK. We found that 52% of the
respondents ranked in the upper 10% of their high school classes.
E D U . Most respondents (89.1 %) pos- sessed a bachelor’s degree at the time of the exam. The cross-tabulation of edu- cation by outcome shows candidates who possessed a bachelor’s degree at the time of the sitting. The rates for suc- cessful and unsuccessful ones were 89.6% and 88%, respectively. For the
remaining education categories, the per- centages varied only slightly. Higher educational attainment was assumed to contribute to a higher degree of success.
PREP. Use of a live review course as
preparation for the exam was an impor- tant variable in predicting a successful outcome on the exam in previous stud- ies (Ashbaugh & Thompson, 1993; Zook & Bremser, 1982). In previous studies, researchers considered only a live review course as the form of prepa- ration. In this study, we considered dif- ferent forms of preparation. The major- ity of respondents (97.5%) used some
[image:4.612.50.384.65.573.2]form of preparation for the exam. Most chose either a live review course (55.5%) or self-study (40.3%). Fewer than 1% of those who had a successful outcome did not use any form of prepa- ration. The form of preparation does seem to matter. Of the 55.5% who used a live review, 60% were successful and only 49.5% were unsuccessful. The results for the self-study group were very different. Although 40.3% used self-study as a form of preparation, only 38% of those achieving a successful outcome did. The rates of those who were unsuccessful were revealing: Over 44% used self-study. Preparation was an indicator variable, which compared each type of preparation in comparison
with none.
zyxwvutsrqponmlkjihgfedcbaZYXWVUTSRQPONMLKJIHGFEDCBA
EXt? Most respondents (84.5%) report-
ed having worked in the accounting field in some capacity before sitting for the exam. The majority worked in either public accounting (35.7%) or private accounting (39.5%), and a small per- centage had worked in government and education. Those who had worked in the accounting field represented a slightly higher proportion (89.6%) of the respondents achieving a successful out- come and a slightly lower percentage (77.7%) of those who were unsuccess- ful. Respondents having private experi- ence made up 35.7% of the total but accounted for 43% of those achieving a successful outcome and only 26.2% of those who were unsuccessful. Other experience categories showed only slight variations. We assumed that some type of accounting work experience, as compared with a complete lack of it,
would affect the outcome directly.
zyxwvutsrqponmlkjihgfedcbaZYXWVUTSRQPONMLKJIHGFEDCBA
RACE. Most respondents (94.1 %)
zyxwvutsrqponmlkjihgfedcbaZYXWVUTSRQPONMLKJIHGFEDCBA
were White, with minority representationmuch lower (5.9%). We included race in the model to investigate whether it could influence the likelihood of suc- cess. Nevertheless, it is possible that non-Whites are less inclined to pursue this exam because of restricted opportu- nities or limited access to quality accounting education and other perti- nent resources.
GENDER. There were 1.5 times more female respondents than male respon-
dents. However, the outcome for females was not as successful as it was for males. Females made up 60% of the respondents but only 55.5% of success- ful candidates and 66% of unsuccessful ones. Males, who represented only 40% of the respondents, represented 44.5% of those who achieved success and only 34% of those who were unsuccessful. Gender was a dummy variable coded 1
for male and 0 for female.
zyxwvutsrqponmlkjihgfedcbaZYXWVUTSRQPONMLKJIHGFEDCBA
The Empirical Analysis
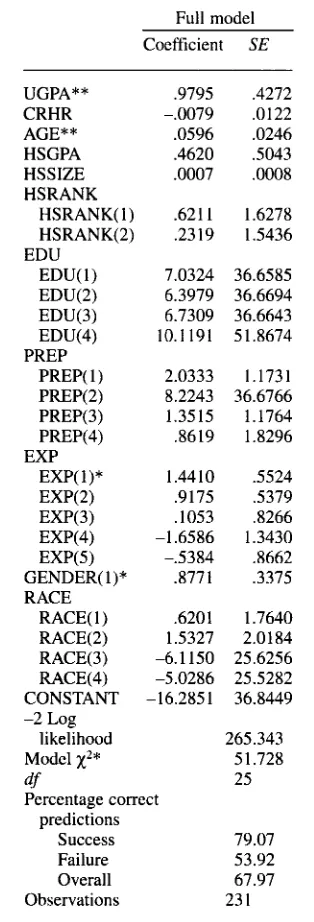
In Table 2, we present estimated coef- ficients from logistic regression of all variables. We found that only 4 out of the 11 independent variables were signifi- cant. Undergraduate GPA and age were significantly different from zero at .05,
whereas experience (private accounting in comparison to no related work expe- rience) and gender (male relative to female) were highly significant at .01.
Zook and Bremser (1982) also found that undergraduate GPA and work expe- rience were significant factors in pre- dicting a successful outcome on the exam. The age of the candidate was a significant variable in determining suc- cess, as was found in a previous study by Gustin and Corazza (1994). These variables have a direct impact on the log odds of success, as indicated by the pos- itive coefficients. Credit hour, high school GPA, high school class size, high school class rank, level of education, preparation method, and race were non- significant variables. Also noteworthy was the negative coefficient of credit hour, which seems to imply that increased credit hours may reduce the log odds of success.
With categorical variables, the effect of a particular category must be mea- sured in comparison with some other category. This means that compared with “no related work experience,” pri- vate, public, and government account- ing experience were associated with increased log odds of success. However, only private accounting, in comparison with “no related work experience,” was significantly different from zero, at a significance level of .01.
We used both forward and backward stepwise methods to select variables through the Wald statistic, the likeli-
TABLE 2. Estimated Parameters of Logit Probability: Full Model
Full model
Coefficient
zyxwvutsrqponmlkjihgfedcbaZYXWVUTSRQPONMLKJIHGFEDCBA
SEUGPA** .9795 .4272 CRHR -.0079 ,0122 AGE** .0596 .0246 HSGPA .4620 SO43 HSSIZE .0007 ,0008 HSRANK
HSRANK( 1) .621 I 1.6278 HSRANK(2) .2319 1.5436 EDU(1) 7.0324 36.6585 EDU(2) 6.3979 36.6694 EDU(3) 6.7309 36.6643 EDU(4) 10.1 191 51.8674 PREP( 1 ) 2.0333 I . 173 1
PREP(2) 8.2243 36.6766 PREP( 3) 1.3515 1.1764 PREP(4) .8619 1.8296 EXP(l)* 1.4410 3 2 4 EXP(2) .9175 S379 EXP(3) .I053 .8266 EDU
PREP EXP
EXP(4) -1.6586 1.3430 EXP(5) -.5384 ,8662 GENDER( 1)* .8771 .3375 RACE
RACE(1) .6201 1.7640 RACE(2) 1.5327 2.0184 RACE(3) -6.1150 25.6256 RACE(4) -5.0286 25.5282 CONSTANT -16.2851 36.8449 -2 Log
likelihood 265.343 Model
x2*
5 1.728df 25 Percentage correct
predictions
Success 79.07 53.92 Failure
Overall 67.97
0 b s e r
zyxwvutsrqponmlkjihgfedcbaZYXWVUTSRQPONMLKJIHGFEDCBA
v a t i o n s 23 1Nore. UGPA = undergraduate grade point average, CRHR = no. of credit hours, HSGPA = high school grade point aver- age, HSSIZE = high school class size, HSRANK = high school class rank, EDU = degree attained, PREP = previous preparation for the CPA exam, and EXP =
previous experience in accounting. *Significant at the .01 level. **Signifi- cant at the .05 level.
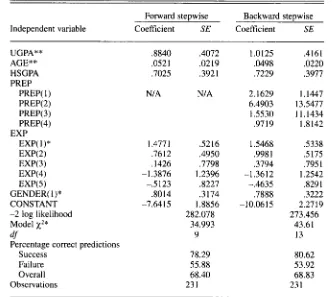
hood ratio statistic, and the conditional statistic. All three types of statistics yielded the same result, as shown in Table 3. Moreover, forward and back-
ward stepwise selection provided the same significant variables, though the
[image:5.612.406.563.76.537.2]TABLE 3. Estimated Parameters of Logit Probability: Forward and
Backward Stepwise Selection Models
zyxwvutsrqponmlkjihgfedcbaZYXWVUTSRQPONMLKJIHGFEDCBA
Forward stepwise Backward stepwiseIndependent variable Coefficient
zyxwvutsrqponmlkjihgfedcbaZYXWVUTSRQPONMLKJIHGFEDCBA
SE Coefficient SEUGPA** AGE** HSGPA PREP
PREP( 1 )
zyxwvutsrqponmlkjihgfedcbaZYXWVUTSRQPONMLKJIHGFEDCBA
PREP( 2) PREP(3) PREP(4) EXP( 1 )*
EXP(2) EXP(3) EXP(4) EXP(5) GENDER( l)* CONSTANT -2 log likelihood
Model
zyxwvutsrqponmlkjihgfedcbaZYXWVUTSRQPONMLKJIHGFEDCBA
x2*
Percentage correct predictions
EXP
zyxwvutsrqponmlkjihgfedcbaZYXWVUTSRQPONMLKJIHGFEDCBA
4f Success Failure Overall Observations ,8840 .0521
.I025
zyxwvutsrqponmlkjihgfedcbaZYXWVUTSRQPONMLKJIHGFEDCBA
N/A
1.477 1
.76 12 .I426 -1.3876
3014
-.5 123 -7.6415 .4072 .02 19 ,3921 N/A S216 .4950 .7798 I .2396 .8227 .3174 1.8856 282.078 34.993 9 78.29 55.88 68.40 23 1 1.0125 ,0498 ,7229 2.1629 6.4903 1.5530 ,9719 1 S468 .9981 .3794 -1.3612 -.4635 .7888 -10.06 15
,4161 .0220 .3977 1.1447 13.5477 11.1434 1.8142 S338
.5 175
.795 1 1.2542 ,829 1
.3222 2.2719 273.456 43.61 13 80.62 53.92 68.83
23 1
zyxwvutsrqponmlkjihgfedcbaZYXWVUTSRQPONMLKJIHGFEDCBA
Note. UGPA = undergraduate grade point average, CRHR = no. of credit hours, HSGPA = high school grade point average, HSSIZE = high school class size, HSRANK = high school class rank, EDU = degree attained, PREP = previous preparation for the CPA exam, and EXP = previous experience in accounting.
*Significant at the .01 level. **Significant at the .05 level.
forward selection precluded the prepa- ration variable. By and large, a full model and models resulting from for- ward and backward stepwise selection indicated that undergraduate GPA, age, private accounting experience relative to “no related work experience,” and gender (male in comparison with female) were significant in increasing the likelihood of success on the CPA exam.
In assessing the model’s goodness of fit, we found that the percentage of cor- rect predictions for success varied from
78% to 81% (see Tables 2 and 3). We also checked the model chi-square, which tests the null hypotheses that the coefficients for all independent vari- ables in each model-except the con- stant-are zero. This is exactly the hypothesis tested by the overall F statis- tic in regression analysis. All chi-square values in all models were significant at the .01 level.
Summary and Conclusions
We conducted this study to deter- mine which factors will improve the likelihood of a candidate’s passing the Uniform CPA Examination. We found that only undergraduate GPA, age, gen- der, and experience were significant. Ideas for further research might include investigating not only GPA but other factors-such as good study habits and university retention initiatives-that may enhance GPA as possible con- tributing factors. Previous researchers have found differences between men’s and women’s test scores in high school and in college, and more obvious dif- ferences when multiple-choice tests were used. One possible explanation for the gender-based difference may be the presence of “biased” items on the exam. Elimination of biased items should reduce gender differences, and the Uniform CPA Examination may
benefit from an analysis identifying such items. However, a previous study of gender differences on multiple- choice tests in economics concluded that even after biased items were removed, differences remained (Walst- ed & Robson, 1997). Certainly more research is needed in this area. Although females represented a sub- stantial proportion of candidates, racial minorities did not. It is clear that accounting schools must work harder to recruit racial minorities to the profes- sion and to determine which factors may be preventing them from entering the field.
Though older candidates performed better, postponement of the exam is not advised. It is imperative to address the factors that contribute to older students’ performance. Among candidates partic- ipating in a live review as preparation, those aged 26 years and over achieved
greater success rates than did those under 26. Perhaps older students are more mature, spend more time study- ing, or possess other factors that con- tribute positively. However, the models in our study implied that this difference is not a result of increased credit hours. Even though the variable preparation was insignificant, it appears that some form of preparation is better than none at all. For some individuals, using a live review in preparation for the exam may improve their chance for a successful outcome. In view of the fact that private sector work experience contributes to higher success rate, inquiry about this factor may provide further insight.
REFERENCES
Ashbaugh, D. L., & Thompson, A. E (1993). Fac- tors distinguishing exceptional performance on the Uniform CPA Exam. Journal of Educarion
for Business, 68(6), 336337.
Gustin, W. C., & Corazza, L. (1994). Mathemati- cal and verbal reasoning as predictors of sci- ence achievement. Roeper Review, /6(3). 160-163.
Hosmer, D. W., & Lemeshow, S. (1989). Applied
logistic regression. New York: Wiley.
Krishnan, K. S . , & Cleland, R. C. (1973). Selec- tion of undergraduate freshman using discrimi- nant analysis.The Journal of Experimental Edu-
cation. 4 / ( 3 ) , 28-36.
Lovel, J . (1999, April
zyxwvutsrqponmlkjihgfedcbaZYXWVUTSRQPONMLKJIHGFEDCBA
5). Bar Exam pass rate con-tinues decline. Arkansas Business, 16( 14). 1-2. Malstrom, E. M., Klecka, W. R., & Shell. R. L.
(1984). Predicting academic success in engi- neering graduate programs. Engineering Edu-
cation, January, 232-234.
[image:6.612.50.382.70.367.2]Moritz,
zyxwvutsrqponmlkjihgfedcbaZYXWVUTSRQPONMLKJIHGFEDCBA
G . (2000, March 27). Bar Exam pass rate Supreme Court of Arizona. (1997, OctoberzyxwvutsrqponmlkjihgfedcbaZYXWVUTSRQPONMLKJIHGFEDCBA
24). Journal of Economic Education. 2 8 ( 2 ) ,zyxwvutsrqponmlkjihgfedcbaZYXWVUTSRQPONMLKJIHGFEDCBA
Zook, D. R., & Bremser, A. G . (1982, April 24). A correlation between the characteristics of candi- dates and performance on the Uniform CPA Examination. Delta Pi Epsilon Journal, 45-52.
slides even lower in February. Arkansas Busi-
zyxwvutsrqponmlkjihgfedcbaZYXWVUTSRQPONMLKJIHGFEDCBA
5 14zyxwvutsrqponmlkjihgfedcbaZYXWVUTSRQPONMLKJIHGFEDCBA
pass state Bar Exam. Business Journal 155-172.ness, 17(13), 10.
Supreme Court of Arizona. (1996, May 17). 69.9% overall pass rate in state Bar Exam. Busi-
ness Journal (Phoenix), 16(29), 55.
(Phoenix), 17(52), 30.
zyxwvutsrqponmlkjihgfedcbaZYXWVUTSRQPONMLKJIHGFEDCBA
Walsted, W. B., & Robson, D. (1997). Differen- tial item functioning and male-female differ- ences on multiple-choice tests in economics.