T H E J O U R N A L O F H U M A N R E S O U R C E S • 45 • 4
Child Health and Neighborhood
Conditions
Results from a Randomized Housing
Voucher Experiment
Jane G. Fortson
Lisa Sanbonmatsu
A B S T R A C T
Using data from the Moving to Opportunity randomized housing voucher experiment, we estimate the direct effects of housing and neighborhood quality on child health. We show that, five years after random assignment, housing mobility has little impact on overall health status, asthma, inju-ries, and body mass index. The few effects that we observe imply that be-ing offered a voucher through the program might worsen some aspects of child health, despite significant improvements in housing quality, nutrition and exercise, and neighborhood safety. Our results are inconsistent with the hypothesis that neighborhood conditions explain much of the widely-cited income gradient in child health.
Jane G. Fortson is an economist at Mathematica Policy Research. Lisa Sanbonmatsu is a postdoctoral fellow at the National Bureau of Economic Research (NBER). The contents of this article are the views of the authors, and do not necessarily reflect the views or policies of the U.S. Department of Housing and Urban Development (HUD) or the U.S. Government. The authors thank HUD, the National Institute of Child Health and Human Development (NICHD) and the National Institute of Mental Health (R01-HD40404 and R01-HD40444), the National Science Foundation (SBE-9876337 and BCS-0091854), the Robert Wood Johnson Foundation, the Russell Sage Foundation, the Smith Richardson Foundation, the MacArthur Foundation, the W.T. Grant Foundation, and the Spencer Foundation for funding and Abt Associates for their work on the evaluation. Additional support was provided by grants to Princeton University from the Robert Wood Johnson Foundation and from NICHD (5P30-HD32030 for the Office of Population Research), and by the Princeton Industrial Relations Section, the Bendheim-Thoman Cen-ter for Research on Child Wellbeing, the Princeton CenCen-ter for Health and Wellbeing, and the NBER. The authors are grateful to Todd Richardson and Mark Shroder of HUD and to Alessandra Del Conte Dickovick, Ken Fortson, Jeff Kling, Jeff Liebman, Jens Ludwig, and numerous other colleagues for their suggestions. Ijun Lai provided excellent research assistance. Joseph Newhouse, Thomas Lemieux, and several anonymous reviewers provided helpful comments. Researchers hoping to use the data found in this article can apply for access to HUD. The authors of this paper are willing to offer guidance about the application.
[Submitted July 2008; accepted August 2009]
I. Introduction
In the United States today, there are large differences in health status between children from rich and poor families (Case, Lubotsky, and Paxson 2002). Much of this health difference is thought to be related to differences in family characteristics—such as differences in education— between these groups. However, there has been growing interest in the role of neighborhoods and residential envi-ronments in explaining differences in health outcomes (Kawachi and Berkman 2003). Understanding the role of housing and neighborhood characteristics in de-termining health status is important in designing policies to lessen or eliminate so-cioeconomic disparities in health.
Robert (1999) proposes a conceptual model of how the physical, social, and ser-vice environments of communities impact the health of individuals through bio-logical, behavioral, psychobio-logical, and social pathways. Poor quality housing—by increasing exposure to household dangers, vermin, and toxins—could have adverse effects on health for both children and adults. For example, housing with moisture and water damage, cracks, and poor ventilation may increase exposure to asthma triggers (Bryant-Stephens 2009). Neighborhood physical environment may affect health through hazards that increase the risk of injury and exposure to air and water pollution. Likewise, the social aspects of neighborhoods could impact health. The chronic stress of living in a dangerous neighborhood may trigger physiological re-sponses that adversely affect health, and social context may affect health behaviors such as diet and exercise. Lastly, neighborhoods may differ in terms of the avail-ability of medical care and other services. For instance, proximity to supermarkets may vary with the racial and economic composition of neighborhoods (Zenk et al. 2005).
An abundance of evidence links neighborhood of residence to morbidity and mor-tality. In Pickett and Pearl’s (2001) review of over two dozen studies looking at neighborhood socioeconomic context and controlling for individual characteristics, nearly all of the studies find evidence of modest effects of neighborhoods on health. In a prominent example, Diez-Roux et al. (2001) find that adults living in disad-vantaged neighborhoods are at significantly greater risk of developing coronary heart disease, even after controlling for income, occupation, and education. In recent work, Merkin et al. (2009) find that neighborhood socioeconomic status is associated with higher levels of allostatic load—a comprehensive and cumulative measure of phys-iological dysregulation—for blacks, but less consistently for other racial and ethnic groups. Studies of adults have found relationships between neighborhood environ-ment and health outcomes such as mortality, self-reported health status, hyperten-sion, obesity, and health-related behaviors (for a review, see Pickett and Pearl 2001; Lochner et al. 2003).
842 The Journal of Human Resources
Franzini et al. (2009) find that children’s physical activity is greater in neighborhoods with more cohesive and favorable social environments.
However, several studies find that controlling for a rich set of individual char-acteristics greatly diminishes the estimated neighborhood effect on health. For in-stance, Robert (1998) finds that community characteristics are significantly related to chronic conditions and self-rated health, even after controlling for individual- and family-level socioeconomic status; however, she finds that community characteristics are less important than individual and family characteristics in explaining cross-sectional variation in these outcomes. Likewise, Steenland et al. (2004), in a study of mortality in the US, find that area-level socioeconomic variables are related to mortality for some causes of death, but that area characteristics are less important than individual socioeconomic status variables. Pickett and Pearl (2001) find that studies using multiple measures to control for individual-level socioeconomic factors tend to find smaller neighborhood effects on health.
Because neighborhood characteristics are often correlated with other family char-acteristics, observational studies are often limited in their ability to identify the independent, causal effect of neighborhoods. In this analysis, we make use of data from a randomized housing mobility experiment, the Moving to Opportunity (MTO) program, to estimate the effects of housing quality and residential neighborhood on child health.1 Our approach improves on the existing literature by employing an experimental design to identify the effects of neighborhood conditions on health independent of the effects of other family characteristics.
In the mid-1990s, families living in public housing in five major U.S. cities were eligible to enroll in the MTO program, which randomly assigned housing vouchers to families in two treatment groups. Families in an “experimental” treatment group received housing vouchers for use in low-poverty neighborhoods, while families in a “Section 8” treatment group received housing vouchers without neighborhood restrictions. Families in a control group did not receive either voucher, but were still eligible for public housing.
The experimental design of the MTO program enables us to isolate the impact of housing and neighborhood characteristics on child health. Because vouchers were randomly assigned, families offered vouchers should be no different along a number of dimensions (income, family characteristics, etc.) than families in the control group. Therefore, observable differences in health can be attributed to differences in housing quality and neighborhood characteristics.
Using health data gathered through the interim evaluation of the MTO program, we estimate the impact of treatment group assignment on child health and look at how this impact varies with age. Next, we look at the effect of treatment group assignment on a number of aspects of housing and neighborhood environment which may mediate effects on health. Our results suggest that being offered a housing voucher through the MTO program had a relatively small effect on child health,
despite improvements in nutrition and exercise and some aspects of housing quality, as well as reductions in neighborhood violence.2
The effects of the MTO program—including its effects on achievement test scores, risky behavior, and crime—have been analyzed in several other studies (for example, Sanbonmatsu et al. 2006; Kling, Ludwig, and Katz 2005). Kling, Liebman, and Katz (2007) estimate medium-term program impacts on a number of outcomes, including adult and young adult health. They find that MTO reduced obesity among experi-mental group adults, but had little impact on other adult physical health measures, including general health, asthma, physical limitations, and hypertension. They like-wise find little program impact on physical health among 15- to 20-year-olds.
Our analysis includes children ages six through 14, as well as those 15 through 20 (who appear in Kling, Liebman, and Katz 2007). Because we might expect the health of children of different ages to respond differently to the program—for in-stance, because at different ages they may be more or less susceptible to neighbor-hood health risks—it is potentially informative to look at children from a wider age range. In addition to the broader sample of children, our analysis has a narrower topical focus than Kling, Liebman, and Katz (2007), which enables us to evaluate channels through which the program may have affected health.
II. Data
Between 1994 and 1998, the MTO program recruited families from high-poverty neighborhoods in five cities: Baltimore, Boston, Chicago, Los Angeles, and New York. Very low income families with children were accepted into the program provided they were in good standing with the public housing authority. Of the 5,301 families who applied to the program, over 85 percent (4,608 families) were deemed eligible to participate. Each of these participating families was ran-domly assigned to one of three groups: the “experimental” treatment group, the “Section 8” treatment group, or the control group. Just over 40 percent of partici-pating families were assigned to the experimental group, and the remaining families were divided roughly equally between the Section 8 treatment and the control groups.
Families in the experimental treatment group received housing vouchers that could be used only in low-poverty neighborhoods (with 1990 poverty rates of less than 10 percent). These families also received free mobility counseling to help them identify available, qualifying housing. Section 8 group families received similar housing vouchers, but without geographic restriction. These families could choose housing based on standard Section 8 regulations, but did not receive mobility coun-seling beyond that typically offered under their local Section 8 programs. Control group families did not receive either voucher, but their public housing eligibility status was not affected by participation.
844 The Journal of Human Resources
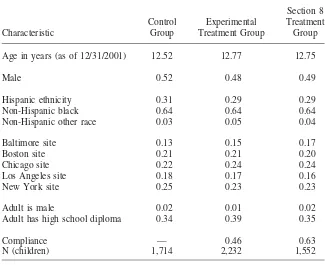
Table 1
Sample Characteristics by Random Assignment Group
Characteristic
Control Group
Experimental Treatment Group
Section 8 Treatment Group
Age in years (as of 12/31/2001) 12.52 12.77 12.75
Male 0.52 0.48 0.49
Hispanic ethnicity 0.31 0.29 0.29
Non-Hispanic black 0.64 0.64 0.64
Non-Hispanic other race 0.03 0.05 0.04
Baltimore site 0.13 0.15 0.17
Boston site 0.21 0.21 0.20
Chicago site 0.22 0.24 0.24
Los Angeles site 0.18 0.17 0.16
New York site 0.25 0.23 0.23
Adult is male 0.02 0.01 0.02
Adult has high school diploma 0.34 0.39 0.35
Compliance — 0.46 0.63
N (children) 1,714 2,232 1,552
Notes: These results are weighted using survey weights that adjust for the randomization ratio, and include only families randomized before 1998. “Non-Hispanic Other Race” is an indicator for whether the child is non-Hispanic, nonblack, and nonwhite. All but age results are at baseline.
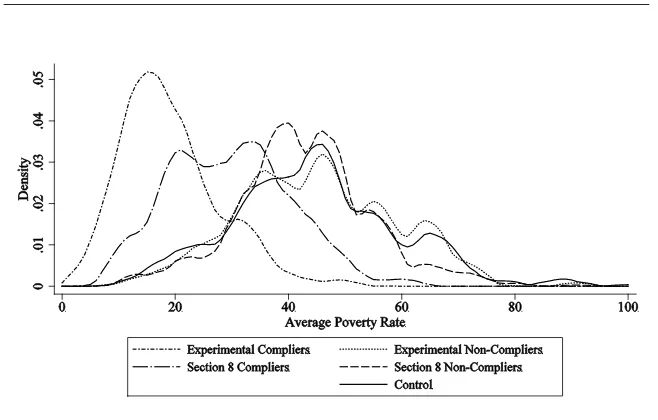
Families in the treatment groups could use their vouchers to rent apartments in the private market, paying about 30 percent of their incomes in rent. Vouchers could generally be used only if moves occurred in the first few months after the offer, though public housing authorities had some discretion over when to issue vouchers (Feins, Holin, and Phipps 1994). About 46 percent of children from the experimental group and 63 percent of children from the Section 8 group were from families that complied—that is, their families used vouchers to rent apartments through the pro-gram. Table 1 shows that there are not large differences in observable characteristics across groups, suggesting that group assignment was indeed random. Figure 1 shows the distribution of neighborhood poverty rates by random assignment group and compliance status, revealing that families using vouchers through the program moved to lower poverty neighborhoods.3
Figure 1
Densities of Average Neighborhood Poverty Rates, by Random Assignment Group Notes: Average poverty rate is a duration-weighted average of poverty rates in tract locations from random assignment through 12/31/01. Poverty rate is based on linear interpolation of 1990 and 2000 Censuses. Density estimates use an Epanechnikov kernel with halfwidth of 2.
Data from the interim evaluation, which are used in this analysis, were collected in early 2002. These data include only a subset of participating families because some families enrolled in the program in 1998 and did not experience moves until 1999—allowing for very few years before the interim evaluation for the program to take effect.4The effective response rates for the adult, youth, and child surveys were 89.6 percent, 89.0 percent, and 88.8 percent, respectively (Orr et al. 2003, Appendix A). Our analysis focuses on children ages six to 20 (as of December 31, 2001) from all five sites. In addition to demographic and housing-related characteristics, the interim survey has information about medical coverage and doctor visits, as well as physical health measures. We focus on four primary health outcomes: reported health status, asthma or wheezing attacks, injuries requiring medical attention, and body mass index (BMI). With the exception of BMI, outcomes are reported by both parents (ages six to 20) and youth (ages 13 to 20). BMI is calculated using self-reported height and weight, which was collected for 13- through 20-year-olds. For younger children, interviewers were asked to measure height and weight (for cal-culation of BMI) themselves. However, we have concerns about the quality of the
846 The Journal of Human Resources
interviewer measurement data.5Hence, we restrict our analysis of the effects of MTO on child BMI to the sample of 13- to 20-year-olds. As our outcome, we use an indicator for whether the child is overweight, that is, has BMI greater than the 95th percentile for his age.
In addition to reported health status, asthma, injuries, and BMI, we can construct a health measure that is a compilation of our other measures. If there were a pattern across the other health measures that was not particularly strong for any single measure, this summary index would help detect it (Schochet 2008). We calculate the summary index as the average of the z-scores of its components:
J
1 Y ⳮ
i,j j
* Y⳱
(1) i
兺
Jj⳱1 j
whereY*is the summary index for child i,Y is the indicator variable for health
i i,j
conditionjfor childi,jis the control group mean ofYi,j,jis the control group standard deviation of Yi,j, andJ is the number of health measures composing the index.6 For health conditions, the sign of the z-score is reversed so that the index is positivefor those with better health andnegativefor those with worse health. *
Yi
We estimate the good health summary index using the following measures of health: reported health status (fair or poor), asthma (ever, attack in the previous year, three or more attacks in the previous year), injuries (overall and nonsport), and overweight (which is missing for children aged six to 12).
In addition to health measures, the MTO dataset has a wealth of information about neighborhood and family characteristics. Many of these characteristics can be con-sidered potential mediators of child health. These mediators include aspects of home physical environment, exercise and nutrition, access to healthcare, safety and ex-posure to violence, neighborhood physical environment, and parental health, as well as the number of times that the family moved, the neighborhood poverty rate, and neighborhood income. In addition to mobility, neighborhood poverty, and neigh-borhood income, we analyze five summary indices: healthy environment, mediators for reduced asthma, mediators for reduced obesity, health care services, and neigh-borhood safety, constructing these indices using Equation 1, wherej is a housing, neighborhood, or family characteristic.7
5. Despite efforts to identify systematic reporting errors and other reasonable explanations (for example, metric vs. English units), calculated BMI values based on interviewer measurements are very problematic. BMI is missing for 9 percent of young children, and more than one quarter of reports fall outside of a reasonable range—that is, they are either greater than the 99.5th percentile for age, or less than the 0.5th percentile for age. Even adjusting for demographic characteristics, preliminary estimates suggest that only about 3 percent of BMI percentile values should fall outside of this range.
6. In some cases, reports are missing for individual health measures. For individuals with indicators for at least half of the measures composing the summary index, we calculate the index using only nonmissing components. The summary index is missing for those with nonmissing reports for fewer than half of the components.
III. Methods
Because families in the MTO program were randomly assigned to treatment groups, group assignment is an exogenous source of variation in housing and neighborhood characteristics; that is, among MTO participants, treatment group assignment is highly correlated with residence but uncorrelated with other charac-teristics, such as wealth and family background.8If housing quality and neighbor-hood characteristics are important determinants of health, and if MTO treatment group assignment led to improvements in these characteristics, we might expect to observe significant differences in health between the treatment and control groups.
To estimate these differences, we look at the intent-to-treat (ITT) effects using the following regression framework:
⬘
Y⳱ ZⳭXⳭε
(2) i 1 i i i
where Yi is the health outcome for child i,Zi is a dummy variable indicating as-signment to the treatment group, andX is a vector of baseline characteristics.9We
i
estimate separate regressions for the experimental and Section 8 treatments. In each case, we restrict the sample to those in the treatment group under study and those in the control group; this ensures that1 can be interpreted as an effect relative to the control group.
The ITT effect estimate 1 shows the impact on Yi of being offered a housing voucher through the program. While we could estimate these ITT effects without controlling for other covariates, includingXiin the regression increases the precision of the estimates and ensures that random variation between groups does not drive the results.10The results are weighted using adjusted survey weights.11In estimating , we report Huber-White standard errors adjusted for between-sibling correlation 1
(clustering by family).
8. While treatment group assignment is random, take-up is not random. Among voucher recipients, com-pliers and noncomcom-pliers may differ on both observable and unobservable characteristics. Our analysis— which focuses on the intent-to-treat effect—gives unbiased estimates of the effect of being offered a voucher through the program.
9. Xiincludes a constant as well as sex, age, other child characteristics (learning disabilities, expulsions, etc.), self-reported neighborhood characteristics, household characteristics (welfare, household size, etc.), parental background (sex, age, race, education, marital status, etc.), and site dummies, all at baseline. Appendix Table A1 presents descriptive statistics for the elements ofXi.
10. IncludingXidoes not affect our qualitative results.
848 The Journal of Human Resources
These ITT estimates reflect the effect of being offered (rather than using) a voucher through the program. However, we might also be interested in the treatment-on-treated (TOT) effect—the effect of actually using a voucher. Because in the MTO program not every family that received a voucher moved through the program, the TOT effect differs from the ITT effect.
To estimate the TOT effect, we are essentially interested in comparing families that moved through the program to families in the control group thatwould have moved if they had been offered vouchers. However, we cannot observe which con-trol group families would have been compliers. If we assume, though, that the ITT effects that we observe result entirely from moves through the program (that is, if we assume that control group noncompliers are no different from treatment group noncompliers), then the TOT effect should be the ITT effect divided by the pro-portion of compliers in the relevant treatment group (Bloom 1984).12
In addition to looking at the overall effects of treatment group assignment, we can also look to see whether any effects differ by age group. Given the strong evidence suggesting that differences in health by income are more pronounced for older children (for example, Case, Lubotsky, and Paxson 2002; Currie and Stabile 2003), we might expect there to be differing effects of treatment for older and younger kids. In particular, younger children experiencing moves through the pro-gram would have spent a large share of their lives in new, lower poverty, borhoods. If poor health is a function of the duration of exposure to poor neigh-borhood conditions, we might expect to see more muted effects among older kids, who have spent a large share of their lives in high poverty neighborhoods. However, if instead older children are more subject to neighborhood influence—for instance, because they spend a greater share of their time outside the home—we might expect to see larger effects among older kids. To test for age differential responses to MTO, we use the following framework:13
⬘ Y⳱ Z I(6ⱕageⱕ10)ⳭZ I(11ⱕageⱕ15)Ⳮ Z I(16ⱕageⱕ20)ⳭXⳭε
(3) i 1 i i 2 i i 3 i i i i
where all of the terms are the same as in Equation 2, andageiis child i’s age in years.14As throughout this analysis, we estimate the regression separately for the experimental and Section 8 treatment groups.
In addition to studying the effects of MTO on health outcomes, we can also evaluate the effects of the program on potential mediators of child health. By study-ing whether the program led to measureable improvements in housstudy-ing and neigh-borhood characteristics, we can refine our hypotheses about how these factors influ-ence child health. For instance, if we suspected that certain components of housing quality (for example, vermin, mold, carpeting, pet fur, and smoking) were strong determinants of childhood asthma, then we might look at ITT effects for both asthma
12. The standard error of the TOT effect is the standard error of the ITT effect divided by the proportion of treatment group families that complied. Because the TOT standard error is scaled-up by the same fraction as the point estimate, p-values for ITT and TOT estimates are the same.
13. This analysis groups children by their age as of December 31, 2001. Children ages six through ten were six or under at baseline, children ages 11 through 15 were three through 11 at baseline, and children ages 16 through 20 were eight through 16 at baseline.
and a summary index combining these housing characteristics; if we observed ITT effects for the index but not for asthma, we might conclude that these housing quality mediators either are less important predictors of asthma than hypothesized, or have been offset by other factors.
We can estimate ITT effects on housing and neighborhood characteristics using a specification like that in Equation 2, where Yi is the observed value of the hy-pothesized mediator (or summary index of mediators) for childi, and all other terms are defined as above.
IV. Results
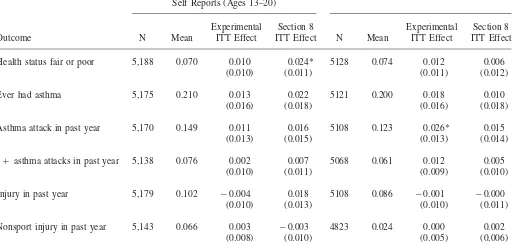
In Table 2, we present results for ITT effects of MTO on child health outcomes using Equation 2. The left panel shows results using a combination of self-reports (for ages 13–20) and parent reports (for ages six to 12) and the right panel shows results using only parent reports (for ages six to 20). We find that ITT effects are generally small and insignificant. The results suggest that, if anything, being offered a voucher through the program is associated withworse health out-comes. Section 8 treatment group assignment is positively and significantly associ-ated with the probability of reporting fair or poor health (using a combination of parent- and self-reports) and experimental treatment group assignment is positively and significantly associated with the probability of suffering an asthma attack in the previous year (using parent-reports).15 Appendix Table A2 reports the ITT effect estimates from the left panel of Table 2 (a combination of self- and parent-reports) and the corresponding TOT estimates.
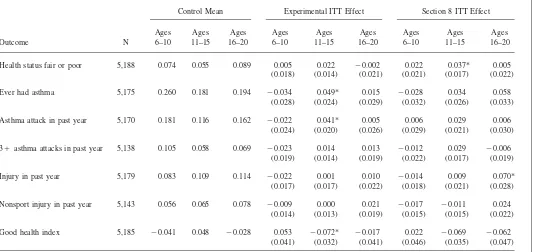
Table 3 shows the interaction of the ITT effect with age group indicators following Equation 3. For most age groups and outcomes, the ITT effects are insignificant. However, there is some evidence that the small adverse effects of MTO are con-centrated among young adolescents (ages 11 to 15), rather than young children (ages six to ten) or older adolescents (ages 16 to 20). Among those 11 to 15, experimental treatment group assignment is positively and significantly associated with asthma and Section 8 treatment group assignment is positively and significantly associated with the probability of reporting fair or poor health. Experimental group children ages 11 to 15 are also in worse health as measured by the index. In addition, Section 8 treatment group assignment is associated with a significant increase in the prob-ability of injury among young adults ages 16 to 20.16,17
15. With so many outcomes, we might worry that any significant results are simply due to chance. How-ever, concerns about multiple hypothesis testing should be assuaged somewhat by the fact that the summary index results are consistent with the overall pattern of results. Previous work has suggested that the use of composite measures (like our summary index) can be an effective way to address this concern (Schochet 2008).
16. Specifications which instead look at interactions of treatment group assignment and age group at random assignment (rather than at the time of the interim evaluation) or look at an interaction of treatment group assignment and age (specified linearly) yield the same general pattern of results as those shown in Table 3.
850
Child Health Outcomes, ITT Effects
Parental Reports (Ages 6–12), Self Reports (Ages 13–20)
Parental Reports (Ages 6–20)
Experimental Section 8 Experimental Section 8
Outcome N Mean ITT Effect ITT Effect N Mean ITT Effect ITT Effect
Health status fair or poor 5,188 0.070 0.010 (0.010)
Ever had asthma 5,175 0.210 0.013
(0.016)
Asthma attack in past year 5,170 0.149 0.011 (0.013)
3Ⳮasthma attacks in past year 5,138 0.076 0.002
(0.010)
Injury in past year 5,179 0.102 ⳮ0.004
(0.010)
Jane
G.
Fortson
and
Lisa
Sanbonmatsu
851
Good health index 5,185 ⳮ0.000 ⳮ0.018
(0.021)
ⳮ0.039
(0.024)
5125 ⳮ0.006 ⳮ0.040
(0.023)
ⳮ0.020
(0.025)
852
Child Health Outcomes by Age, ITT Effects
Control Mean Experimental ITT Effect Section 8 ITT Effect
Outcome N
Health status fair or poor 5,188 0.074 0.055 0.089 0.005 (0.018)
Ever had asthma 5,175 0.260 0.181 0.194 ⳮ0.034 (0.028)
Asthma attack in past year 5,170 0.181 0.116 0.162 ⳮ0.022 (0.024)
3Ⳮasthma attacks in past year 5,138 0.105 0.058 0.069 ⳮ0.023 (0.019)
Injury in past year 5,179 0.083 0.109 0.114 ⳮ0.022 (0.017)
Nonsport injury in past year 5,143 0.056 0.065 0.078 ⳮ0.009 (0.014)
Good health index 5,185 ⳮ0.041 0.048 ⳮ0.028 0.053 (0.041)
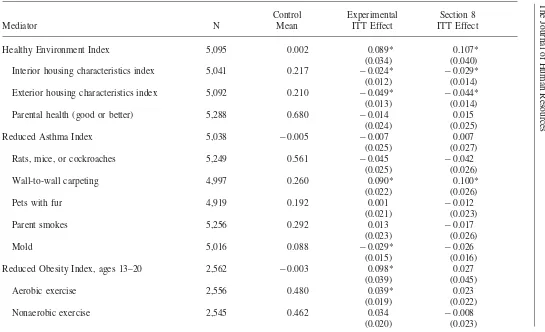
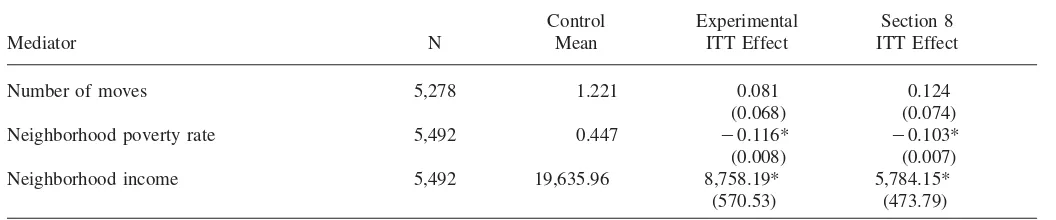
Table 4 shows the ITT effect estimates for potential mediators of child health, measured as indices and the components of those indices. The ITT estimates show that there are significant positive effects of MTO on the healthy environment index (both experimental and Section 8) and mediators for reduced obesity (experimental only), as well as neighborhood safety (both experimental and Section 8). Not sur-prisingly, there is a significant ITT effect on the neighborhood poverty rate (for both experimental and Section 8 treatments), consistent with treatment group families living in lower poverty neighborhoods. The ITT effect estimates for the index of mediators for reduced asthma and for health care services are small and insignificant. However, there are significant effects of treatment group assignment on the proba-bility of having wall-to-wall carpeting, a known correlate of asthma. The ITT effects for number of moves are insignificant, which casts doubt on the hypothesis that greater mobility among treatment group families is a major contributing factor to the nonpositive health impacts.
V. Discussion
The results presented in Tables 2 through 4 suggest that the MTO experiment had relatively little effect on child health, despite significant improve-ments in many aspects of housing and neighborhood conditions. Further, the ITT estimates thatarestatistically significant suggest that the experiment may have had adverse effects on some aspects of child health.18
However, the null and adverse ITT effects estimated here could reflect the inad-equacy of the health outcome measures, rather than the true effect of treatment group assignment. If treatment group assignment influences how individuals report health status, this could bias our ITT effect estimates. For instance, self-reported health status (poor, fair, good, very good, or excellent) may be a measure of relative health status. To the extent that the MTO experiment changed the composition of the reference group (that is, healthier children became the peers of treatment group members), the negative health effects that we observe could reflect a decline in health relative to the reference group, rather than an absolute decline in health. Likewise, self-reported height and weight (used to calculate BMI) may be influenced by peer comparisons, which may lead to differential reporting across random assignment groups. Our main results (in Table 2), show a positive and significant effect of Section 8 treatment group assignment and no effect of experimental treatment group assignment on the probability of reporting fair or poor health, and no effect of treatment group assignment on the probability of being overweight. While in prin-ciple these null and adverse effects could be generated by changes in the composition of the reference group, reporting would have to be highly subjective in order for the estimated effects to mask a true, positive health effect of the program. For instance, if the true effect of being offered a voucher through the program were to improve
854
Specific Mediators of Child Health, ITT Effects
Control Experimental Section 8
Mediator N Mean ITT Effect ITT Effect
Healthy Environment Index 5,095 0.002 0.089*
(0.034)
0.107* (0.040) Interior housing characteristics index 5,041 0.217 ⳮ0.024*
(0.012)
ⳮ0.029*
(0.014) Exterior housing characteristics index 5,092 0.210 ⳮ0.049*
(0.013)
ⳮ0.044*
(0.014)
Parental health (good or better) 5,288 0.680 ⳮ0.014
(0.024)
0.015 (0.025)
Reduced Asthma Index 5,038 ⳮ0.005 ⳮ0.007
(0.025)
0.007 (0.027)
Rats, mice, or cockroaches 5,249 0.561 ⳮ0.045
(0.025)
ⳮ0.042
(0.026)
Wall-to-wall carpeting 4,997 0.260 0.090*
(0.022)
0.100* (0.026)
Pets with fur 4,919 0.192 0.001
(0.021)
ⳮ0.012
(0.023)
Parent smokes 5,256 0.292 0.013
(0.023)
ⳮ0.017
(0.026)
Mold 5,016 0.088 ⳮ0.029*
(0.015)
ⳮ0.026
(0.016)
Reduced Obesity Index, ages 13–20 2,562 ⳮ0.003 0.098*
(0.039)
0.027 (0.045)
Aerobic exercise 2,556 0.480 0.039*
(0.019)
0.023 (0.022)
Nonaerobic exercise 2,545 0.462 0.034
(0.020)
ⳮ0.008
Jane
Health Care Services Index 5,236 0.001 0.040
(0.033)
ⳮ0.002
(0.041) Family member did not get needed care 5,257 0.065 ⳮ0.005
(0.012)
0.001 (0.014)
Usual place to go for medical care 5,200 0.962 0.016
(0.009)
Neighborhood Safety Index, ages 9–20 4,354 ⳮ0.000 0.108*
(0.026)
0.106* (0.026)
Victim of gun or stabbing assault 4,352 0.088 ⳮ0.006
(0.013)
ⳮ0.011
(0.014)
Witnessed gun or stabbing assault 4,340 0.130 ⳮ0.010
(0.015)
ⳮ0.019
(0.016)
Heard gunfire 4,219 0.279 ⳮ0.041*
(0.020)
ⳮ0.030
(0.022)
Observed the sale or use of drugs 4,204 0.405 ⳮ0.042
(0.023)
0.040 (0.025)
Parent feels safe during the day 4,346 0.750 0.093*
(0.022)
0.091* (0.022)
Parent feels safe at night 4,310 0.551 0.121*
(0.027)
0.087* (0.029)
Household was victim of break-in 4,389 0.104 ⳮ0.017
(0.017)
ⳮ0.023
(0.018)
856
The
Journal
of
Human
Resources
Table 4(continued)
Control Experimental Section 8
Mediator N Mean ITT Effect ITT Effect
Number of moves 5,278 1.221 0.081
(0.068)
0.124 (0.074)
Neighborhood poverty rate 5,492 0.447 ⳮ0.116*
(0.008)
ⳮ0.103*
(0.007)
Neighborhood income 5,492 19,635.96 8,758.19*
(570.53)
5,784.15* (473.79)
health by twenty percent relative to the control group, a third of those reporting fair or poor health would need to be misreporting in order to generate the observed reports.19
Because our two other measures of health, injuries and asthma, are event-based, we might ex ante expect less misreporting (or relative reporting) of these outcomes. However, our measures of injuries have an additional shortcoming: we observe re-ports of injuries requiring medical attention. If the MTO experiment influences ac-cess to medical care, we might think that an increase in injuries (by our measure) does not reflect a true increase in injuries but rather an increase in access to care. However, in Table 4, we show that treatment group assignment is not associated with a significant increase (or decrease) in health care services, measured as an index or the components of that index. This suggests that injuries requiring medical atten-tion reflect the true rate of nontrivial injuries. In addiatten-tion, the data include another, broader measure of injuries (only for 12- to 20-year-olds): we know whether ado-lescents reported having an injury that either required medical care or limited activ-ities. ITT estimates for this measure—which should be less influenced by access to care—are likewise insignificant.
Our final measure of health, asthma, is perhaps less likely to be biased by reporting and access to care. It is also particularly interesting because some of the adverse ITT effects are related to asthma attacks.20 The increase in asthma attacks among treatment group members, however, is perhaps unsurprising after looking at Table 4. Of the many health and neighborhood characteristics that may be considered mediators of children’s health, several known correlates of asthma (wall-to-wall carpeting, pet fur, vermin, etc.) did not decline significantly in response to the pro-gram. In fact, treatment group assignment is associated with significant increases in wall-to-wall carpeting, which is a suspected risk factor for asthma.
Even if the ITT estimates are unbiased and reflect the true effects of being offered a housing voucher through the program, we might be concerned that the experi-ment’s implications for the broader question of how neighborhoods influence health are quite limited. First, it could be that neighborhoods operate on health quite slowly—that not enough time elapsed between random assignment and the interim evaluation for neighborhoods to have an effect.21However, this does not account
858 The Journal of Human Resources
for the handful of statistically significant ITT effects, nearly all of which show that, if anything, being offered a voucher through the program may worsen health.22 Nevertheless, it is possible that the benefits associated with treatment accrue more slowly and would, in the long term, swamp any adverse effects.
Furthermore, if the MTO program did not affect the particular housing and neigh-borhood characteristics that are important for child health, then it may be unreason-able to draw conclusions from these results about the overall impact of neighbor-hoods on health. For instance, one health cost of poor neighborneighbor-hoods may be lead poisoning (Meyer et al. 2003); we do not measure changes in lead exposure, and therefore cannot assess whether this and the resulting health consequences were improved by the experiment. Furthermore, there is some evidence that children whose families moved through the program still attended low-quality schools, often in their old neighborhoods (Popkin, Harris, and Cunningham 2002); if peer inter-actions are a principal determinant of health status, then this may help to explain the insignificant ITT effects for most health outcomes.
These results cannot rule out the possibility that other interventions—such as those that lead to more dramatic, persistent changes in neighborhood characteristics or those that target different groups—could lead to modest improvements in child health. Nevertheless, it is difficult to reconcile these results—particularly the adverse effects—with a model in which neighborhood conditions are a major determinant of children’s health.
VI. Conclusion
Our ITT estimates suggest that changes in neighborhood and housing conditions associated with the MTO demonstration had a negligible effect on child health in the medium-term. While our results support the notion that families offered vouchers through the program moved to neighborhoods that were “better” along a number of dimensions, the evidence suggests that doing so did not lead to improve-ments in child health. Specifically, we observe sizeable ITT effects for certain me-diators of child health, including housing characteristics, nutrition and exercise, and neighborhood safety. However, these effects do not seem to translate into health improvements among children.
Furthermore, our results suggest that children in the treatment groups were, in some respects, adversely affected by the program. Negative effects are particularly pronounced for asthma, for which we also did not observe improvements in most mediators. This highlights the fact that there may be some components of neigh-borhood and housing quality that are both important for health and were not im-proved (or manipulated) by the experiment.
At a minimum, these results suggest that the policy instrument used in this ex-periment—a housing voucher offered to public housing recipients—may have
ited scope for eliminating disparities in child health. While our results cannot rule out an effect of neighborhoods on children’s health, they do indicate that many aspects of neighborhood quality—including safety —do not appear to have improved child health, at least in the medium-term. And because the experiment had a rela-tively large, positive effect on most measured components of housing and neigh-borhood characteristics, our results cast doubt on the importance of neighneigh-borhoods for child health.
References
Acevedo-Garcia, Dolores, Theresa L. Osypuk, Rebecca E. Werbel, Ellen R. Meara, David M. Cutler, and Lisa F. Berkman. 2004. “Does Housing Mobility Policy Improve Health?” Housing Policy Debate15(1):49–98.
Bloom, Howard. 1984. “Accounting for No-Shows in Experimental Evaluation Designs.” Evaluation Review8(2):225–46.
Bryant-Stephens, Tyra. 2009. “Asthma Disparities in Urban Environments.”Journal of Allergy and Clinical Immunology123(6):1199–206.
Case, Anne, Darren Lubotsky, and Christina Paxson. 2002. “Economic Status and Health in Childhood: The Origins of the Gradient.”American Economic Review92(5):1308–34. Cradock, Angie L., Ichiro Kawachi, Graham A. Colditz, Steven L. Gortmaker, and Stephen
L. Buka. 2009. “Neighborhood Social Cohesion and Youth Participation in Physical Activity in Chicago.”Social Science & Medicine68(3):427–35.
Currie, Janet, and Mark Stabile. 2003. “Socioeconomic Status and Child Health: Why is the Relationship Stronger for Older Children?”American Economic Review93(5):1813–23. Curtis, Lori J., Martin D. Dooley, and Shelley A. Phipps. 2004. “Child Well-Being and
Neighbourhood Quality: Evidence from the Canadian National Longitudinal Survey of Children and Youth.”Social Science & Medicine58(10):1917–27.
Diez-Roux, Ana V., Sharon Stein Merkin, Donna Arnett, Lloyd Chambless, Mark Massing, F. Javier Nieto, Paul Sorlie, Moyses Szklo, Herman A. Tyroler, and Robert L. Watson. 2001. “Neighborhood of Residence and Incidence of Coronary Heart Disease.”New England Journal of Medicine345(2):99–106.
Eibner, Christine, and William N. Evans. 2005. “Relative Deprivation, Poor Health Habits, and Mortality.”Journal of Human Resources40(3):591–620.
Feins, Judith D., Mary Joel Holin, and Antony A. Phipps. 1994.Moving to Opportunity for Fair Housing Demonstration: Program Operations Manual. Washington, D.C.: U.S. Department of Housing and Urban Development.
Fertig, Angela R., and David A. Reingold. 2007. “Public Housing, Health, and Health Behaviors: Is There a Connection?”Journal of Policy Analysis and Management 26(4):831–59.
Franzini, Luisa, Marc N. Elliott, Paula Cuccaro, Mark Schuster, M. Janice Gilliland, Jo Anne Grunbaum, Frank Franklin, and Susan R. Tortolero. 2009. “Influences of Physical and Social Neighborhood Environments on Children’s Physical Activity and Obesity.” American Journal of Public Health99(2):271–78.
Katz, Lawrence F., Jeffrey R. Kling, and Jeffrey B. Liebman. 2001. “Moving To
Opportunity in Boston: Early Results of a Randomized Mobility Experiment.”Quarterly Journal of Economics116(2):607–54.
860 The Journal of Human Resources
Kling, Jeffrey R., Jeffrey B. Liebman, and Lawrence F. Katz. 2007. “Experimental Analysis of Neighborhood Effects.”Econometrica75(1):83–119.
Kling, Jeffrey R., Jens Ludwig, and Lawrence F. Katz. 2005. “Neighborhood Effects on Crime for Female and Male Youth: Evidence from a Randomized Housing Voucher Experiment.”Quarterly Journal of Economics120(1):87–130.
Lochner, Kimberly A., Ichiro Kawachi, Robert T. Brennan, and Stephen L. Buka. 2003. “Social Capital and Neighborhood Mortality Rates in Chicago.”Social Science & Medicine56(8):1797–1805.
Lumeng, Julie C., Danielle Appugliese, Howard J. Cabral, Robert H. Bradley, and Barry Zuckerman. 2006. “Neighborhood Safety and Overweight Status in Children.”Archives of Pediatrics and Adolescent Medicine160(1):25–31.
Merkin, Sharon Stein, Ricardo Basurto-Da´vila, Arun Karlamangla, Chloe E. Bird, Nicole Lurie, Jose Escarce, and Teresa Seeman. 2009. “Neighborhoods and Cumulative Biological Risk Profiles by Race/Ethnicity in a National Sample of U.S. Adults: NHANES III.”Annals of Epidemiology19(3):194–201.
Meyer, Pamela A., Timothy Pivetz, Timothy A. Dignam, David M. Homa, Jaime Schoonover, and Debra Brody. 2003. “Surveillance for Elevated Blood Lead Levels Among Children—United States, 1997–2001.”MMWR Surveillance Summaries 12-Sept-2003.
Orr, Larry, Judith D. Feins, Robin Jacob, Erik Beecroft, Lisa Sanbonmatsu, Lawrence F. Katz, Jeffrey B. Liebman, and Jeffrey R. Kling. 2003.Moving to Opportunity for Fair Housing Demonstration: Interim Impacts Evaluation. Washington, D.C.: U.S. Department of Housing and Urban Development.
Pickett, Kate E. and Michelle Pearl. 2001. “Multilevel Analyses of Neighbourhood Socioeconomic Context and Health Outcomes: A Critical Review.”Journal of Epidemiology and Community Health55(2):111–22.
Popkin, Susan J., Laura E. Harris, and Mary K. Cunningham. 2002.Families in Transition: A Qualitative Analysis of the MTO Experience. Washington, D.C.: U.S. Department of Housing and Urban Development.
Robert, Stephanie A. 1998. “Community-Level Socioeconomic Status Effects on Adult Health.”Journal of Health and Social Behavior39(1):18–37.
Robert, Stephanie A. 1999. “Socioeconomic Position and Health: The Independent Contribution of Community Socioeconomic Context.”Annual Review of Sociology 25:489–516.
Sanbonmatsu, Lisa, Jeffrey R. Kling, Greg J. Duncan, and Jeanne Brooks-Gunn. 2006. “Neighborhoods and Academic Achievement: Results from the Moving to Opportunity Experiment.”Journal of Human Resources41(4):649–91.
Schochet, Peter Z. 2008.Technical Methods Report: Guidelines for Multiple Testing in Impact Evaluations(NCEE 2008–4018). Washington, D.C.: National Center for Education Evaluation and Regional Assistance, Institute of Education Sciences, U.S. Department of Education.
Steenland, Kyle, Jane Henley, Eugenia Calle, and Michael Thun. 2004. “Individual- and Area-Level Socioeconomic Status Variables as Predictors of Mortality in a Cohort of 179,383 Persons.”American Journal of Epidemiology159(11):1047–56.
Appendix Table A1
Baseline Covariates, Descriptive Statistics
Covariate Mean
Standard Deviation
Child characteristics
Set of child age indicators: child age⳱Xyears as of
December 31, 2001
— —
Child got help for behavior or emotional problem (in 2 years prior to baseline)—(6–17)
0.094 0.292
Child expelled from school (in 2 years prior to baseline)— (6–17)
0.101 0.302
Child went to special class for gifted or did advanced work—(6–17)
0.159 0.366
Child got help for a learning problem (in 2 years prior to baseline)—(6–17)
0.169 0.374
School asked to talk about problems child had in school (in 2 years prior to baseline)—(6–17)
0.256 0.430
Child was in the hospital before his/her first birthday because the child was sick or injured—(0–5)
0.188 0.391
Child weighed less than 6 pounds at birth—(0–5) 0.154 0.361 Someone in home reads a book or story to the child more
than once a day—(0–5)
0.274 0.446
Child age 6 to 17 at baseline (indicates which form is relevant)—(0–17)
0.599 0.490
Male child—(0–17) 0.497 0.500
Hard for child to get to school or play because of health problem—(0–17)
0.066 0.249
Child requires special medicine/equipment—(0–17) 0.096 0.289
Household characteristics
Receiving AFDC/TANF 0.787 0.408
Has car that runs 0.174 0.379
Household member disabled 0.163 0.367
No teens in core household 0.627 0.484
Core household size⳱2 or fewer 0.088 0.283
Core household size⳱3 0.235 0.424
Core household size⳱4 0.249 0.433
Household member was victim of crime (in six months prior to baseline)
0.418 0.491
862 The Journal of Human Resources
Appendix Table A1(continued)
Covariate Mean
Standard Deviation
Neighborhood characteristics
Adult lived in neighborhood 5Ⳮyears 0.597 0.485
Adult stops to chat with neighbor at least once a week 0.508 0.498 Adult very likely to tell neighbor if saw neighbor’s kid in
trouble
0.557 0.496
Adult has no family in neighborhood 0.645 0.478
Adult has no friends in neighborhood 0.401 0.489 Adult reports streets near home very unsafe at night 0.489 0.499 Adult very dissatisfied with neighborhood 0.474 0.498
Housing
Adult very sure would find apartment in other area 0.473 0.498 Adult moved 3Ⳮtimes (in five years prior to baseline) 0.089 0.284
Gangs/drugs primary or secondary reason for moving 0.750 0.428 Better schools primary or secondary reason for moving 0.522 0.493 Adult previously applied to Section 8 0.416 0.491
Site dummies
Baltimore 0.147 0.354
Boston 0.209 0.407
Chicago 0.233 0.423
Los Angeles 0.173 0.379
Parental background
Adult 19–29 as of May 31, 2001 0.130 0.337
Adult 30–39 as of May 31, 2001 0.528 0.499
Adult 40–49 as of May 31, 2001 0.257 0.437
Adult obtained GED 0.176 0.381
Adult graduated from high school 0.389 0.488
Adult in school 0.156 0.356
Adult Hispanic 0.287 0.451
Adult male 0.018 0.132
Adult never married 0.616 0.479
Adult was teen parent 0.279 0.438
Adult African-American 0.661 0.470
Adult other nonwhite 0.257 0.433
Adult working 0.237 0.418
Appendix Table A2
Child Health Outcomes, ITT v. TOT Effects
Control
Experimental Section 8 Outcome N Mean ITT Effect TOT Effect ITT Effect TOT Effect Health status fair
or poor
5,188 0.070 0.010 0.022 0.024* 0.038*
(0.010) (0.021) (0.011) (0.018) Ever had asthma 5,175 0.210 0.013 0.029 0.022 0.034
(0.016) (0.034) (0.018) (0.029) Asthma attack in
past year
5,170 0.149 0.011 0.025 0.016 0.025
(0.013) (0.029) (0.015) (0.024) 3Ⳮasthma attacks
in past year
5,138 0.076 0.002 0.004 0.007 0.011
(0.010) (0.021) (0.011) (0.018) Injury in past year 5,179 0.102 ⳮ0.004 ⳮ0.009 0.018 0.029
(0.010) (0.023) (0.013) (0.020) Nonsport injury in
past year
5,143 0.066 0.003 0.006 ⳮ0.003 ⳮ0.005 (0.008) (0.018) (0.010) (0.015) Overweight, ages
13–20
2,451 0.173 0.012 0.027 ⳮ0.007 ⳮ0.010 (0.022) (0.048) (0.024) (0.038) Good health index 5,185 ⳮ0.000 ⳮ0.018 ⳮ0.038 ⳮ0.039 ⳮ0.062
(0.021) (0.047) (0.024) (0.038) Notes: Health outcome measures are based on parent reports for ages 6–12 and are based on self-reports for ages 13–20. “Control Mean” represents the unadjusted control mean. “Health Status Fair or Poor” is an indicator for reported fair or poor health. “Ever Had Asthma” is an indicator for having ever had an asthma or wheezing attack. “Asthma Attack in Past Year” is an indicator for having had an asthma or wheezing attack in the previous year. “3ⳭAsthma Attacks in Past Year” is an indicator for having had three or more asthma or wheezing attacks in the previous year. “Injury in Past Year” is an indicator for having had an injury requiring medical attention in the previous year. “Nonsport Injury in Past Year” is an indicator for having had a nonsport injury requiring medical attention in the previous year. “Overweight” is an indicator for having Body Mass Index (kg/m2) greater than the 95th percentile for age. “Good Health
864 The Journal of Human Resources
Appendix Table A3
Child Health Outcomes by Sex, ITT Effects
Control Mean Experimental ITT Effect Section 8 ITT Effect
Outcome N Male Female Male Female Male Female
Health status fair or poor
5,188 0.070 0.070 0.015 0.005 0.047* 0.002 (0.014) (0.013) (0.017) (0.015) Ever had asthma 5,175 0.232 0.187 0.022 0.005 0.005 0.038
(0.024) (0.020) (0.026) (0.024) Asthma attack in
past year
5,170 0.140 0.158 0.020 0.003 0.050* ⳮ0.018 (0.018) (0.019) (0.022) (0.021) 3Ⳮasthma attacks
in past year
5,138 0.071 0.082 0.022 ⳮ0.018 0.024 ⳮ0.010 (0.015) (0.013) (0.017) (0.015) Injury in past year 5,179 0.120 0.083 0.004 ⳮ0.012 0.041 ⳮ0.004
(0.017) (0.013) (0.021) (0.015) Nonsport injury in
past year
5,143 0.062 0.069 0.020 ⳮ0.015 0.026 ⳮ0.032* (0.012) (0.011) (0.016) (0.012) Overweight, ages
13–20
2,451 0.173 0.174 0.029 ⳮ0.004 0.007 ⳮ0.021 (0.033) (0.028) (0.035) (0.032) Good health index 5,185 ⳮ0.012 0.013 ⳮ0.055 0.020 ⳮ0.101* 0.022
(0.032) (0.029) (0.038) (0.031) Notes: Health outcome measures are based on parent reports for ages 6–12 and are based on self-reports for ages 13–20. “Control Mean” represents the unadjusted control mean. “Health Status Fair or Poor” is an indicator for reported fair or poor health. “Ever Had Asthma” is an indicator for having ever had an asthma or wheezing attack. “Asthma Attack in Past Year” is an indicator for having had an asthma or wheezing attack in the previous year. “3ⳭAsthma Attacks in Past Year” is an indicator for having had three or more asthma or wheezing attacks in the previous year. “Injury in Past Year” is an indicator for having had an injury requiring medical attention in the previous year. “Nonsport Injury in Past Year” is an indicator for having had a nonsport injury requiring medical attention in the previous year. “Overweight” is an indicator for having Body Mass Index (kg/m2