D
ISADVANTAGE
: R
OLE OF
A
GE
, J
OB
T
ENURE AND
C
ASUAL
E
MPLOYMENT
DAVIDPEETZ∗
I
ndustrial tribunals have been considering redundancy benefits for older workers, workers with long job tenure and casual workers (the latter group presently having no access to redundancy benefits regardless of tenure). This paper details labour market disadvantage faced by these categories of retrenched workers.INTRODUCTION
Misfortune in the labour market is unevenly distributed. Some groups are more likely than others to face labour market disadvantage through such factors as a greater likelihood to lose employment and to be: unable to find employment; with-out employment for longer periods of time once they are withwith-out employment; or forced into inferior jobs with lesser conditions or pay. This disadvantage may flow from personal characteristics (such as gender, ethnicity, race), job character-istics (such as occupation, industry) or situational charactercharacter-istics (such as region) (Alcorso & Harrison 1993; Pocock 1998). Such characteristics may be used to segment labour markets leading to people with similar capabilities receiving dif-ferent pay and conditions (McNabb & Ryan 1990). This article focuses on three particular characteristics (one personal, two job related) and their roles in one aspect of labour market misfortune—workers’ experience after they have been retrenched. The characteristics are age, prior job tenure and casual/permanent employment status.
The focus is on these dimensions because they have particular policy salience. In 1984, the then Australian Conciliation and Arbitration Commission (ACAC) granted all award-covered employees severance benefits in redundancy situations. These benefits were to range from 4 weeks pay for workers with 1 year of service, to a maximum of 8 weeks pay for workers with 4 or more years of service. No benefits were payable to casual employees or employees with less than 1 year service. At a time when many retrenched employees received no benefits, this was seen as a groundbreaking decision. Since then, the adequacy of these benefits has been challenged.
Contention focuses on three areas. One is the adequacy of benefits for older workers, which was highlighted by the 1994 decision of the New South Wales Industrial Commission (NSWIC) to grant a 25% loading in redundancy benefits to workers aged 45 and above. This is particularly salient in light of evidence of
∗
Center for Work, Leisure and Community Research and Department of Industrial Relations, Griffith University, Brisbane, QLD 4111, Australia. Email: d.peetz@griffith.edu.au
discrimination against older (potential) workers. Discrimination against workers due to age or other grounds is well documented (Walleyet al.1999) and illegal under state and federal anti-discrimination laws. Yet these laws cannot prevent discrimination, because they operate through complaints-based mechanisms and much discrimination is unobservable (Riach & Rich 1991). The level of severance benefits matter greatly as anti-discrimination laws are mostly of little use to older retrenched workers.
A second contention is the adequacy of benefits for workers with longer prior tenure in their job. These benefits were in effect doubled by the NSWIC in 1994. Tenure, by implication, is closely related to age, but the advantage of tenure over age as a criterion for severance benefits is that it bears a direct relation to the ‘service’ provided by the employee to the employer.
The third focus is the exclusion of casuals from any redundancy benefits. At the time of the 1984 ACAC decision, casuals were only a small proportion of workers and they tended to occupy short-term (and part-time) jobs. By 1998, 53% of self-identified casuals had been in the same job for over a year; 24% had been there for 2 years (ABS Cat no. 6359.0). By November 2001, 76% of casuals still expected to be with the same employer in 12 months time (Australia 2003: 172). This emergence of long-term casual employment is a ‘recent phenomenon’ (Australia 2003: 152). Many casuals (perhaps over half) are not ‘genuine’ casuals in the sense of being people who are only engaged irregularly and for intermittent, short periods (Murtough & Waite 2000). Rather, many are merely employees with regular work but insecurity of tenure, no redundancy pay and no rights to annual or sick leave. Controversy over the adequacy of ‘casual’ has led to the ABS ceasing to use the term in its labour force statistics, instead identifying employees ‘without leave entitlements’. This paper, however, uses the more common nomenclature, ‘casuals’.
The tribunal system has lightly regulated casual employees; they typically re-ceive less training than permanent employees, have fewer career opportunities, lower employment entitlements (such as superannuation) and, as indicated above, no leave entitlements, little security of employment and no redundancy benefits (Campbell 1996: 574). This has created an incentive for employers to concentrate growth in casual employment. Recent years have seen the start of a reconfigura-tion of the role of casual employment. The use of permanent part-time work is increasing, but full-time work is becoming casualised. Thus, while the proportion of permanent employees who were part-time increased from 14 to 16% in the 4 years from 1999 to 2003, the proportion of casual employees who were full-time increased from 30 to 35% (ABS Cat no. 6310.0). The exclusion of casuals from redundancy pay is increasingly affecting full-time workers, and is the subject of industrial disputes, for example at the Sydney Hilton Hotel (Workers Online 2002).
disadvantages claimed by unions did not exist or had been reduced in relative terms; that older workers were retiring earlier; that casuals received a loading which compensated for the risk of termination; and that the cost of any increase would hurt employers and cost jobs. It is not the purpose of this paper to address all these issues, but to focus on the question of the disadvantage faced by retrenched employees in relation to the three characteristics already mentioned.
This paper first considers the role of age in disadvantage regarding retrench-ment, before turning to the related question of prior job tenure. Finally, it con-siders the situation for casual employees. It addresses the questions: are older retrenched workers and workers with longer prior job tenure disadvantaged com-pared to other retrenched workers; and are retrenched casuals at least as disad-vantaged in the labour market as retrenched permanent employees?
DATA
The main focus is on data from the Australian Bureau of Statistics. One source is the Labour Force Survey (LFS). A number of supplementary surveys associated with the LFS are also used, primarily the Retrenchment and Redundancy (R&R) Survey, undertaken in July 1997 and July 2001 and from which unpublished data have been obtained. The LFS, undertaken monthly, provides information from a potentially larger dataset than the episodic R&R Survey, which may only collect information from a defined subgroup in the population.
The two R&R Surveys were undertaken in different labour market contexts, with the national unemployment rate lower in July 2001 (6.9% seasonally adjusted) than in July 1997 (8.3%). As a consequence of improved labour market conditions, the estimated number of retrenched employees was lower over the 3 years to June 2001 (596 400) compared to the 3 years to June 1997 (685 400). In a labour market characterised by lower unemployment, the labour market outcomes for retrenched employees were also more favourable over the later period, with 16.6% of employees who had been retrenched in the 3 years to June 2001 still unemployed in July 2001. The comparable figure for July 1997 was 29.3%. As a consequence, unemployment duration among retrenched employees also declined. However, in July 2001, 16.2% of employees who had been retrenched in the preceding 3 years were now ‘not in the labour force’, compared to 16% in July 1997.
In interpreting changes between the 1997 and 2001 data, it is important to recognise that both sets of data are subject to sampling error. Because of the lower rates of redundancy and unemployment in the later period, most estimates in tables for 2001 tend to have higher standard errors and lower reliability than comparable estimates for 1997.
AGE
Before turning to the specifics of the R&R Surveys, we first consider general data on age from the LFS. There is considerable evidence of a higher level of disadvantage faced by older people (Walleyet al. 1999: 10), whom employers are reluctant to hire (VandenHeuvel 1999).
duration are more likely to experience hardship, for example through exhausting financial resources, and becoming disillusioned and depressed. Table 1 consid-ers LFS data on unemployment duration by age. ‘High-duration’ unemployment refers to unemployment with observed duration of 26 or more weeks. It is im-portant to note that the LFS does not measure completed unemployment spells; rather it observes duration of the unemployment spell to date, which will be, on an average, half way through their period of unemployment. Hence the average person unemployed for 26 weeks at the time of the survey will end up unemployed for about a year before obtaining a job.
Table 1 Proportion of unemployed persons with high-duration unemployment and incidence of high-duration unemployment, by age, June quarters, 1997, 2001
1997 2001
Proportion of unemployed persons with high-duration unemployment
Aged 55 and over (%) 67 57
Aged 54 and under (%) 44 34
Incidence of high-duration unemployment—ratio of aged 55+to 54 1.5 1.7
and under
Source: ABS, Labour Force, Australia, Cat no. 6203.0, various months. Population: unemployed persons.
In the June quarter 1997, around two-thirds of over 55-year-old unemployed persons experienced high-duration unemployment, compared to no more than half of those under 55 years. In 2001, the proportion of high-duration unemployed in both groups fell, but the fall was proportionately smaller for the over 55 age group (the fall of 9% represented a drop of 14% for the over 55 age group, compared to 24% for the under 55 year olds). As a consequence, in the June quarter 1997, an unemployed person over 55 years was 1.5 times more likely to be experiencing high-duration unemployment as an under 55 year old, but by June quarter 2001 they were 1.7 times more likely to experience high-duration unemployment.
Retrenchment and redundancy
Just as older employees are disadvantaged in the labour market, so too they are disadvantaged when retrenched. There is near ‘unanimous’ agreement in the literature that ‘age is negatively related to the likelihood and speed of the re-employment’ of retrenched workers (Wooden, 1988: 6). Once unemployed, ma-ture workers often find it extremely difficult to regain work, for a range of reasons; from employers attitudes of who and what is an older worker, to a lack of qualifi-cations or skills (Walleyet al.1999: 8, 9). The R&R Survey shows that, in 1997, 65% of unemployed persons aged 55 and over had been unemployed for 26 weeks or more, compared to 37% of unemployed 24–34 year olds.
period of job search (VandenHeuvel 1999: 16). The ABS supplementary survey on successful and unsuccessful job search experience reveals that jobseekers in older age groups were the least likely group to be successful (ABS Cat no. 6245.0, July 2000). Data on labour force exit incorporates the effect of discouraged job seekers—people who would like a job but who no longer satisfy the ABS defi-nition of unemployment—and people who have given up hope of employment altogether. Discouraged job seeking is a particular problem among mature-age people. For example, discouraged job seekers make up a considerably larger per-centage of the population of older male workers (over 55 years) than of younger makes. For women, the differences by age are even larger (VandenHeuvel 1999: 16, 17; Walleyet al. 1999: 9).
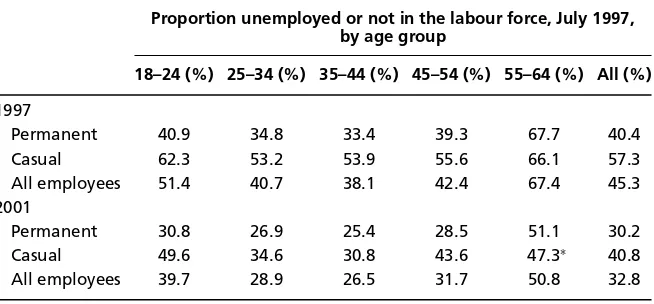
The data from the R&R Survey did not include specific counts of discour-aged job seekers. However, a related useful indicator of need among retrenched employees from this survey is the proportion not in work—they are either unem-ployed or not in the labour force. Table 2, from the R&R Survey, shows that older retrenched persons, particularly those aged 55 and above, had a higher probabil-ity of being either unemployed or not in the labour force than younger workers.
Table 2 Percentage unemployed or not in the labour force, by age group and employment status of previous job
Proportion unemployed or not in the labour force, July 1997, by age group
18–24 (%) 25–34 (%) 35–44 (%) 45–54 (%) 55–64 (%) All (%)
1997
Permanent 40.9 34.8 33.4 39.3 67.7 40.4
Casual 62.3 53.2 53.9 55.6 66.1 57.3
All employees 51.4 40.7 38.1 42.4 67.4 45.3
2001
Permanent 30.8 26.9 25.4 28.5 51.1 30.2
Casual 49.6 34.6 30.8 43.6 47.3∗ 40.8
All employees 39.7 28.9 26.5 31.7 50.8 32.8
Source:ABS Cat no. 6266.0, unpublished data.
Population: Persons aged 18–64 years who had been retrenched or made redundant in the 3 years to 30 June 1997/2001.∗
Asterisked proportions based on estimates with a standard error of greater than 25 per cent.
Early retirement
This argument is difficult to sustain. Data presented earlier show the growing problem of high-duration unemployment among older workers. Just as signifi-cantly, the idea that early retirement was increasingly common is simply a myth. Labour force participation rates increased in all three older age groups (45–54, 55–59 and 60–64 year olds) between 1997 and 2001. For example, between June 1997 and June 2001, the participation rate among 55–59 year olds increased from 57.7 to 61.4%, and among 60–64 year olds it increased from 32.2 to 34%.1If these
data indicate anything about retirement patterns, it is that people were retiring later.
Moreover, if retrenched employees were ‘retiring’ at the times they do through genuine choice, we would expect the distribution of retirement ages among re-trenchees to be similar to the distribution among people who choose their retire-ment date. Yet the ABS Retireretire-ment and Retireretire-ment Intentions Survey indicates that, among persons who retired after reaching the age of 45 years, 68% of those who lost their last job due to retrenchment ‘retired’ before reaching age 60 years. This compares to only 45% among all ‘job leavers’ and 56% among those who left their last job for reasons associated with early retirement (‘early retirement package’, ‘eligible for superannuation or service pension’).
The rate at which retrenched employees leave the labour force is also consid-erably higher than in the labour force as a whole. In 2000, an estimated 208 000 employees were retrenched. These employees were retrenched between 6.5 and 18.5 months before the July 2001 survey, that is, an average of slightly over 12 months before the survey. Among those retrenched workers, 32 800 (15.8%) had left the labour force by the time of the survey. By comparison, the Labour Mobility Survey shows that only 3.8% of all people employed in February 2001 had left the workforce 12 months later, by February 2002 (ABS Cat no. 6209.0). This discrepancy is not because retrenchments are concentrated among older workers, since this group appeared no more likely than any other cohort to be-come retrenched. The principal problem for older workers is not that they are more likely to be retrenched, it is that their subsequent employment prospects are bleaker than those of other workers. Hence, once retrenched, many older workers leave the labour market (or at least actively cease looking for work according to the ABS definition of unemployed).
redundancies (12%) than were non-union workplaces (3%) (Moreheadet al. 1997: 419, and unpublished AWIRS data). A similar pattern can be seen in Britain (Sisson 1993: 206). By August 2002 approximately 77% of employees were non-union members (ABS Cat no. 6310.0), suggesting that a large proportion of re-trenched employees are likely to have been compulsorily rere-trenched.
PRIOR JOB TENURE
Age is a key factor in understanding the relationship between prior job tenure and labour market outcomes. The term ‘prior job’ is used as shorthand in this text for a job from which the employee was retrenched or made redundant. Older workers are more likely to have been in long-duration jobs. In 2001, 71% of retrenched workers aged 55–64 had prior job tenure of 5 years and over, as did 63% of retrenched workers aged 45–54, compared to just 45% of those aged 35–44 and 30% of those aged 25–34. Retrenched employees with longer prior job tenure would be relatively disadvantaged as a consequence of their age, and because their skills and experience are specific to a particular employer and may not be readily transferable (Wooden, 1988: 7).
Unemployed or not in the labour force
Table 3 shows the proportion of employees unemployed or not in the labour force among retrenched employees who were formerly in ‘permanent’ jobs, differenti-ated by tenure of prior job. The greatest disadvantage in 1997 was experienced by those with very short prior job tenure, and those with long prior tenure. Although the situation improved for all groups between 1997 and 2001, the improvement was smallest for those with greater than 5 years job tenure (4% compared to 9% for the 1 and under 5 years group and 21% for the under 12 months group).
Table 3 Proportion unemployed or not in the labour force, July 1997, by duration of job from which retrenched or made redundant
Proportion unemployed or not in the labour force Duration in job from which
retrenched or made redundant July 1997 (%) July 2001 (%)
Under 12 months 49.1 28.0
1 and under 5 years 34.3 24.9
5 years and over 39.4 35.2
Total 40.4 30.2
Source: ABS Cat no. 6266.0, unpublished data.
Population: Persons aged 18–64 years who had been retrenched or made redundant from permanent jobs in the 3 years to 30 June 1997/2001 and were unemployed in July 1997/2001.
Changing from full-time to part-time status
transition to casualised employment (Webber & Webber 1999: 110), which tends to be: low skilled, involve little training, insecure and with few career prospects (Walleyet al. 1999: 12). The literature also finds, that re-employment, where it does occur, is frequently in less well paid jobs than those from which employees were retrenched (Wooden 1988: 18). Another indicator of disadvantage among retrenched employees is whether they have been able to resist reductions in their hours of work, from full-time to part-time. As shown in Table 4, retrenched employees with long prior job tenure are more likely than other retrenched em-ployees to shift from full-time to part-time employment.
Table 4 Proportion of permanent employees who changed from full-time to part-time status, by duration in job from which retrenched or made redundant
Proportion of permanent employees who changed from full-time to part-time status (%) Duration in job from which
retrenched or made redundant 1997 2001
Under 12 months 11.0 12.5
1 and under 5 years 13.5 12.0
5 years and over 19.4 17.4
All 14.9 14.3
Source: ABS Cat no 6266.0, unpublished data.
Population: Persons aged 18–64 years who had been retrenched or made redundant in the 3 years to 30 June 1997/2001 and who were employed in July 1997/2001.
Is this switching from full-time to part-time status all voluntary? It seems un-likely. In the 3 years to February 2002, approximately 264 000 (4.2%) of all full-time employees switched to part-full-time jobs (ABS Cat no. 6209.0).2 In the R&R
Survey, some 56 400 (11.6%) people retrenched from full-time jobs ended up in part-time jobs over the 3 years to July 2001. This implies that approximately 3.5% of non-retrenched full-time employees switched to part-time work over the 3-year period (and there is no reason to believe that all of this shifting is volun-tary).3 That is, retrenched employees were approximately 3.3 times more likely
to switch from full-time to part-time work than other employees, suggesting a majority involuntary component to this shifting.
Of the 56 400 retrenched employees who switched from full-time to part-time jobs in the 3 years to 2001, most (69%) switched from permanent full-part-time to casual part-time work. The ABS Forms of Employment Survey, undertaken 4 months later, found that amongall part-time casual employees, 43% wanted more hours (ABS Cat no. 6359.0). Among male part-time casual employees, 53% wanted more hours. The figure amongretrenchedemployees now in casual part-time jobs was likely to be higher than this population average.
Unemployment duration
still unemployed. Some 51% of retrenched employees with prior job tenure of 5 years or more had been unemployed for 26 weeks or more at the time of the ABS Survey. Within this tenure group, disadvantage increased with tenure: among retrenched employees with prior job tenure of 10 years or more, the figure was 59%.
Table 5 Unemployment duration, by previous job tenure
Duration in job from whichretrenched or made redundant
In job for In job for In job for
Duration of current under 1 and under 5 years
period of unemployment 12 months (%) 5 year (%) and over (%)
1997
Under 8 weeks 28.4 26.2 21.3
8 and under 26 weeks 23.9 32.8 27.5
26 weeks and over 47.7 41.0 51.2
All 100.0 100.0 100.0
2001
Under 8 weeks 42.2 45.2 43.1
8 and under 26 weeks 39.8 28.2 31.0
26 weeks and over 18.1∗ 26.6 25.9
All 100.0 100.0 100.0
Source: ABS Cat no. 6266.0, unpublished data.
Note.Numbers in columns may not add to 100.0% due to rounding.
∗
Based on estimates with a standard error of greater than 25%.
Population: Persons aged 18–64 years who had been retrenched or made redundant from permanent jobs in the 3 years to 30 June 1997/2001 and were unemployed in July 1997/2001.
Joblessness duration
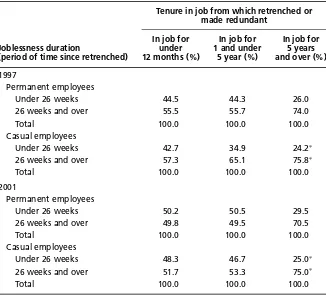
Although data on duration of current unemployment spells were collected by the ABS, directly analogous data for periods of ‘not being in the labour force’ were not collected. However, for all those people who are no longer currently employed (i.e. they are either unemployed or not in the labour force) we can calculate in grouped format, based on in what year the employees were retrenched, the period of time since these retrenched employees lost their jobs. This is referred to here as ‘joblessness duration’, though this is not quite accurate because it does not take into account intervening periods of temporary employment experienced by some employees. Its usefulness is in seeing whether similar relationships exist with tenure as are found in relation to unemployment duration; it provides a reality check on the unemployment duration data.
Table 6 indicates that ‘joblessness duration’, like unemployment duration, shows a marked bias against retrenched employees from jobs with long prior tenure; that is, it confirms the disadvantage faced by employees retrenched from jobs with high prior tenure. Between 1997 and 2001, the incidence of high jobless-ness duration (greater than 26 weeks) fell for all groups of permanent employees, but the decrease appeared to be weakest for those with prior job tenure of over 5 years (3.5% compared to around 6% for the other two groups).
Unemployment duration revisited
There appear to be three possible explanations for the pattern whereby declining estimated unemployment duration among employees with long prior job tenure, seems to sit alongside the persistence of other indicators of disadvantage for this group. One might be that there has been a significant increase in voluntary early retirement among older people, but we can quickly dismiss this explanation based on the data presented above. Two other explanations are more plausible. One is that an increasing proportion of older retrenched people are leaving the labour market altogether and this has disproportionately lowered average unemployment duration among those with long prior job tenure (the ‘discouraged worker effect’). The other is that the apparent change reflects sampling variation between surveys (the sampling effect). In fact, the 10.4% shift in relativities between the 1–5 year and over 5-year tenure groups was not statistically significant. Given this and the greater reliability of the LFS data as a whole, the sampling effect appears the more likely explanation.
CASUAL/PERMANENT EMPLOYMENT STATUS
Do retrenched casual employees experience lesser labour market disadvantage than retrenched permanent employees of similar prior job duration? In these and other ABS data, casuals are employees without access to annual leave or sick leave. Accordingly, there can be casuals who have worked in the same job for the same employer for several years. The term permanent employees is used here simply as the opposite of casual, that is employees with holiday or sick leave.
Table 6 ‘Joblessness’ duration, by employment status and prior job tenure
Tenure in job from which retrenched or made redundant
In job for In job for In job for
Joblessness duration under 1 and under 5 years
(period of time since retrenched) 12 months (%) 5 year (%) and over (%)
1997
Permanent employees
Under 26 weeks 44.5 44.3 26.0
26 weeks and over 55.5 55.7 74.0
Total 100.0 100.0 100.0
Casual employees
Under 26 weeks 42.7 34.9 24.2∗
26 weeks and over 57.3 65.1 75.8∗
Total 100.0 100.0 100.0
2001
Permanent employees
Under 26 weeks 50.2 50.5 29.5
26 weeks and over 49.8 49.5 70.5
Total 100.0 100.0 100.0
Casual employees
Under 26 weeks 48.3 46.7 25.0∗
26 weeks and over 51.7 53.3 75.0∗
Total 100.0 100.0 100.0
Source: ABS Cat no. 6266.0, unpublished data.
∗
Based on estimates with a standard error of greater than 25%.
Population: Persons aged 18–64 years who had been retrenched or made redundant in the 3 years to 30 June 1997/2001 and who were not employed in July 1997/2001.
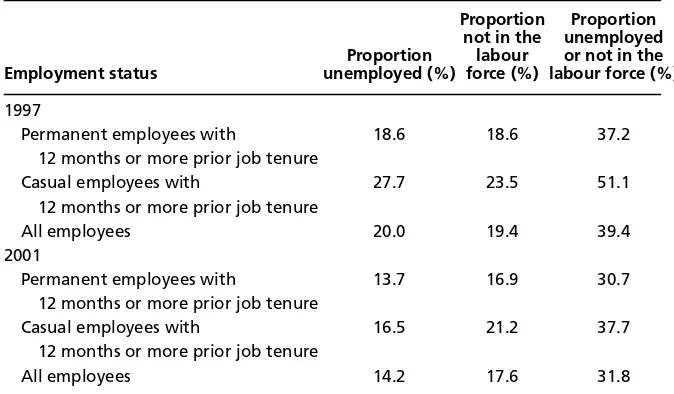
‘long-term’ casuals, those with 12 months or higher tenure. As context, persons aged 25 and over accounted for the majority (82%) of retrenched long-term casu-als (those with 12 months or more service in their previous job). Indeed, 56% were aged 35 or over. Long-term casuals accounted for one-third of retrenched casual employees.
Table 7 Percentage unemployed or not in the labour force, by permanent or casual status of previous job, retrenched persons with prior job tenure of 12 months and over
Proportion Proportion
not in the unemployed
Proportion labour or not in the
Employment status unemployed (%) force (%) labour force (%)
1997
Permanent employees with 18.6 18.6 37.2
12 months or more prior job tenure
Casual employees with 27.7 23.5 51.1
12 months or more prior job tenure
All employees 20.0 19.4 39.4
2001
Permanent employees with 13.7 16.9 30.7
12 months or more prior job tenure
Casual employees with 16.5 21.2 37.7
12 months or more prior job tenure
All employees 14.2 17.6 31.8
Source: ABS Cat no. 6266.0, unpublished data.
Population: Persons aged 18–64 years who had been retrenched or made redundant in the 3 years to 30 June 1997/2001 from jobs with tenure of 12 months or more.
permanent employees in all age groups except the over 55 age group, in which the experiences of casuals and permanents are almost equally poor.
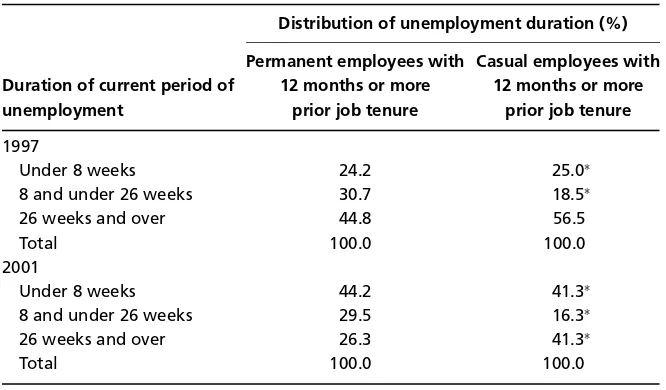
When measured by unemployment duration, retrenched long-term casuals are more disadvantaged than are equivalent retrenched permanent employees (Table 8). In 2001, while 26% of unemployed persons in the latter group had unemployment duration of at least 26 weeks, the same was the case for about 41% of retrenched long-term casuals. Table 6, shown earlier, also confirms that, in terms of joblessness duration, the position of retrenched long-term casuals is at least as bad, and probably worse, than that of retrenched permanent employees with similar prior job duration.
With casual employment possibly becoming ‘more secure in terms of regu-larity of earnings and predictable working patterns, along with high expecta-tions of continued employment for casual employees with their current employer’ (Australia 2003: 174), it seems that the larger difference between long-term casu-als and permanents is not in their expectations of continuing employment but in the degree of disadvantage they face when retrenched; and, given the low costs of doing so, the incentive for employers to retrench them.
CONCLUDINGCOMMENTS
Table 8 Unemployment duration, by permanent or casual status, retrenched persons employed for 12 months and over job duration
Distribution of unemployment duration (%)
Permanent employees with Casual employees with
Duration of current period of 12 months or more 12 months or more
unemployment prior job tenure prior job tenure
1997
Under 8 weeks 24.2 25.0∗
8 and under 26 weeks 30.7 18.5∗
26 weeks and over 44.8 56.5
Total 100.0 100.0
2001
Under 8 weeks 44.2 41.3∗
8 and under 26 weeks 29.5 16.3∗
26 weeks and over 26.3 41.3∗
Total 100.0 100.0
Note:Numbers in columns may not add to 100.0% due to rounding.
∗
Based on estimates with a standard error of greater than 25%.
Population: Persons aged 18–64 years who had been retrenched or made redundant in the 3 years to 30 June 1997/2001 from jobs with tenure of 12 months or more.
Source:ABS Cat no. 6266.0, unpublished data.
to the need for extensive retraining or study into new areas (QIRC 2003: 10). The AIRC focused on maintaining the rationale for the 1984Termination Change and Redundancydecision, and redressing the anomaly whereby it was recognised that hardship increased with tenure but the scale of benefits did not increase after 4 years service (AIRC 2004: 44).
Both tribunals declined to apply any loading for older workers. For Queensland, this was principally because of concerns that this would exacerbate discrimination against older workers, but it recognised that long-tenured workers also happened to be older workers. The AIRC also considered that tenure-based scales indi-rectly took age into account, but added that the extra difficulty experienced by older retrenched workers in finding employment was not relevant as it was not appropriate to take income maintenance considerations into account (AIRC 2004: 46). This was the role of the social security system, notwithstanding the fact that many retrenched workers are ineligible for social security payments because they have an employed spouse (AIRC 2004: 39, 40). Still, while allocating compensa-tion based on tenure rather than age is imperfectly targeted at employees most disadvantaged in retrenchment situations, it at least goes some way to achieving this in a way least likely to cause offence to employers.
As for casual employees, the data demonstrate that the position of retrenched long-term casuals is at least as difficult as that facing retrenched permanent em-ployees with similar job tenure and in most respects is more difficult. They face longer periods of unemployment than equivalent permanent employees and lower probabilities of finding work. Yet they receive no severance benefits except when union pressure is successfully applied. The QIRC declined to grant casuals a sev-erance entitlement, but left the door for revisiting the application pending the AIRC decision. On the one hand, it considered that a severance benefit was in-corporated into the casual loading and on the other, that the term casual now encompasses a wide variety of employment types. The traditional casual is one of those types’ and the Commission had ‘some sympathy for those non-traditional long-term casuals who are displaced as a result of retrenchment’ (QIRC 2003: 16). The AIRC was more decisive, rejecting any compensation for casuals on the grounds that this would be ‘double dipping’ as one factor taken into account in an increase in the casual loading in the Metals Awardin 2000 was the lack of redundancy benefits for casuals (AIRC 2004: 83).
facing even greater difficulties than permanent employees with similar age and tenure, should be denied severance benefits merely because they are classified as a casual employee—that is, not given annual and sick leave—by their employing organisation. The data presented here, and the treatment of casuals in the deci-sion, call into serious question the nature of the regulation of casual employment. With many casual employees not being genuinely casual, the proliferation of long-term casual employment has become a mechanism by which over a quarter of the workforce are defined outside of the safety net that ostensibly provides rights of access to recreation leave, sick leave and redundancy benefits to Australian em-ployees. It would seem an appropriate time for policy makers, including those in unions, to rethink the role of casual employment in modern society, as the relationship between casual employment and redundancy pay highlights one of the more significant holes in the safety net provided by the Australian arbitral system.
POSTCRIPT
In May 2005 the Commonwealth government announced plans to legislate sev-erance pay out of the safety net, by abolishing the ‘no disadvantage test’ in the
Workplace Relations Act 1996and omitting severance pay from a list of proposed minimum standards for agreements.
ACKNOWLEDGEMENTS
My thanks go to Robin Price and Chris Houghton for research assistance with aspects of this paper and to the officers of the ABS.
ENDNOTES
1. For 45–54 year olds the increase was from 78.3% in June quarter 1997 to 79.0% in June quarter 2001 and 80.1% in June quarter 2002.
2. In the 12 months to February 2002, an estimated 94 800 full-timers converted to part-time jobs, as indicated above. In the 12 months to February 2000 the equivalent figure was 81 100. No estimate is available for February 2001 but a reasonable estimate would be the midpoint of these two figures, 88 000. These three figures sum to 263 900. The denominator is the number of people in full-time work in February 1999 in the Labour Mobility Survey, 6 329 600. See ABS,
Labour Mobility, Cat no. 6209.0.
3. The estimate is approximate as the two periods concerned have only an 81% overlap, but this is not likely to have a major impact on the estimate. Calculated as (263 900–56 400)/(6 329 600– 484 200).
REFERENCES
Australia (2003)Commonwealth Government Submission to Australian Industrial Relations Commission Redundancy and Termination of Employment Case.Canberra: Department of Employment and Workplace Relations.
Australian Bureau of Statistics [ABS] Cat no. 6310.0—Employee Earnings, Benefits and Trade Union Membership,Australia, Canberra.
Australian Bureau of Statistics [ABS] Cat no. 6359.0—Forms of Employment,Australia, Canberra. Australian Industrial Relations Commission [AIRC] (2004) Decision PRD32004, 26 March. Campbell I (1996) Casual Employment, Labour Market Deregulation and Australian Trade Unions,
McNabb R, Ryan P. (1990) Segmented labour markets, In: Tzannatos Z, Sapsford D, eds,Current Issues in Labour Economics. Melbourne: MacMillan, 151–76.
Morehead A, Steele M, Alexander M, Stephen K, Duffin L (1997)Changes at Work: The 1995 Australian Workplace Industrial Relations Survey, London: Longman.
Murtough G, Waite M (2000) The growth of non-traditional employment: Are jobs becoming more precarious? Staff Research Paper, Productivity Commission, July.
Pocock B (1998) All change, still gendered: The Australian Labour Market in the 1990s,Journal of Industrial Relations40 (4), 580–604.
Queensland Industrial Relations Commission (QIRC), Decision, No. B209 of 2002 and No. B308 of 2002, 18 August, inQGIG171(18), 1417–29.
Riach PA, Rich J (1991) Testing for racial discrimination in the labour market,Cambridge Journal of Economics15 (3): 239–56.
VanderHeuvel A. (1999) Mature age workers: Are they a disadvantaged group in the labour market?
Australian Bulletin of Labour25 (1): 11–22.
Walley L, Steinberg M, Warner D (1999)The Mature Age Labour Force, Workforce Strategy Unit, Employment Taskforce, Monograph series No. 2, Brisbane: Department of Employ-ment, Training and Industrial Relations, May.
Webber M, Campbell I (1997) Labour market outcomes among retrenched workers in Australia: A review.Australian and New Zealand Journal of Sociology33 (2): 187–204.
Wooden M (1988) The impact of redundancy on subsequent labour market experience.Journal of Industrial Relations30 (1): 3–31.