Burundi
Tom Bundervoet
Philip Verwimp
Richard Akresh
a b s t r a c t
We combine household survey data with event data on the timing and location of armed conflicts to examine the impact of Burundi’s civil war on children’s health status. The identification strategy exploits exogenous variation in the war’s timing across provinces and the exposure of children’s birth cohorts to the fighting. After controlling for province of residence, birth cohort, individual and household characteristics, and province-specific time trends, we find an additional month of war exposure decreases children’s height for age z-scores by 0.047 standard deviations compared to nonexposed children. The effect is robust to specifications exploiting alternative sources of exogenous variation.
I. Introduction
During the past 30 years, civil conflict affected almost three-fourths of all countries in sub-Saharan Africa (Gleditsch et al. 2002). Recently academic economists and policy makers have begun focusing on this topic, specifically trying to understand the causes of war and its role in reducing growth and development (Collier and Hoeffler 1998; Miguel, Satyanath, and Sergenti 2004; Guidolin and La Ferrara 2007). The nature and magnitude of a conflict’s long-term negative eco-nomic consequences are debated in the literature (see Davis and Weinstein 2002 for
Tom Bundervoet is a graduate student in economics at the University of Brussels (Vrije Universiteit Brussel). Philip Verwimp is a post-doctoral researcher with the Fund for Scientific Research (Flanders, Belgium) at the University of Antwerp and visiting researcher at ECARES (Universite´ Libre de Bruxelles). Richard Akresh is an assistant professor of economics at the University of Illinois at Urbana Champaign. The authors would like to thank Jean-Marie Baland, Robert Bates, Tony Addison, Marcel Fafchamps, Olga Shemyakina, Peter Uvin, and participants at HiCN’s first annual workshop in 2006 in Berlin, at the 2006 CSAE conference, at the 2007 NEUDC, and at seminars in Namur, ECARES-ULB, and DIW-Berlin for helpful comments on earlier drafts. The data used in this article can be obtained beginning six months after publication through three years hence from the authors.
½Submitted July 2007; accepted February 2008
Japan; Brakman, Garretsen, and Schramm 2004 for Germany; Miguel and Roland 2006 for Vietnam; Bellows and Miguel 2006 for Sierra Leone). Despite the suffering and deaths caused by these various wars, there is limited research that examines the microeconomic impacts of conflict for noncombatants, although this is slowly chang-ing as data from war regions becomes available (Shemyakina 2006; Akresh, Verwimp, and Bundervoet 2007).1
The 1990s were a particularly violent decade in Central Africa’s history.2Burundi and Rwanda experienced several episodes of mass murder and genocide, and the re-gional civil war in the Democratic Republic of Congo created an enormous loss of life and socioeconomic destruction. Most of the recent work on Burundi focuses on the causes of the latest episode of civil conflict (Nkurunziza and Ngaruko 2000), the progression of the crisis (Chre´tien and Mukuri 2000), the year-by-year political dimensions of the conflict (Reyntjens and Vandeginste 1997; Reyntjens 1998), or the possible solutions to it (Ndikumana 2000).
Civil wars often have immediate negative economic impacts through the destruc-tion of productive capacity and the disrupdestruc-tion of normal activity. Between 1990 and 2002, per capita income in Burundi fell from $210 to $110 leaving Burundi as the world’s poorest country. The proportion of people living below the nationally defined poverty line increased during this period from 35 to 68 percent, and the spread of the civil war starting in 1994 led to double digit inflation rates, which peaked at over 30 percent in 1997 (all figures from IMF 2007).
In this paper, we examine the impact of the Burundi civil war on children’s health status, focusing on early childhood malnutrition and stunting measured by height for agez-scores. We examine if and how shocks, such as conflict, affect childhood health for those exposed children. We combine data from a nationally representative house-hold survey (the 1998 Priority Survey carried out by the World Bank and the Burundi Statistics Institute) with event data on the timing and evolution of the conflict from 1994 to 1998. The empirical identification strategy exploits variation in the timing and duration of conflict across the Burundi provinces and the related variation deter-mining which birth cohorts of children were exposed to the war and for how long (see Suri and Boozer 2007 using a similar identification strategy to explore child la-bor issues). We find that an additional month of civil war exposure decreases a child’s height for agez-score by 0.047 standard deviations, an effect that is robust to including a variety of control variables, time trends, and alternative sample spec-ifications. In calculating the total difference between a child not exposed to the war and one exposed for the average exposure duration, the results imply a one standard deviation reduction in the child’s height for agez-score.
Research suggests this finding could have implications for these war-exposed children’s future schooling and productivity as adults (see Strauss and Thomas 1998 for a discussion of health and development links). Alderman, Hoddinott, and
1. Research focusing on soldiers finds large negative impacts on earnings for these individuals, and soldiers exposed to more violence face a harder time reintegrating into civilian society (Angrist 1990; Imbens and van der Klaauw 1995; Humphreys and Weinstein 2005; Blattman and Annan 2007).
Kinsey (2006) use Zimbabwe data and find that improvements in childhood malnu-trition (measured as height for age) are associated with more completed grades in school. Aldermanet al.(2001) estimate the impact of child health on school enroll-ment in rural Pakistan and find that improveenroll-ments in preschool height for age z-scores are likely to have substantial long-run productivity effects through inducing more schooling. Maccini and Yang (2006) and Meng and Qian (2006) find that neg-ative early-life environmental conditions (negneg-ative rainfall shocks in Indonesia and China’s Great Famine, respectively) lead to worse adult health and socioeconomic conditions.3Based on the existing literature, it is likely the short-run health impact of the Burundi civil war will have a long-run welfare impact through an adverse ef-fect on future schooling, adult health, and income levels.
The remainder of the paper is organized as follows. Section II provides an over-view of the history of violence in Burundi and sketches the spatial and temporal event data for the most recent civil war. Section III describes the survey data used in the analysis and explains the key variables. Section IV describes the empirical identification strategy and Section V presents the main results as well as robustness tests. Section VI concludes.
II. Conflict in Burundi
A. Political History
Civil conflict in Burundi began in 1965, three years after independence from the Bel-gian colonial administration, when a group of Hutu officers unsuccessfully tried to seize power and overthrow the monarchy. This failed coup led to a purge of Hutu from the army and government and marked the beginning of political exclusion of the Hutu majority by the Tutsi minority. Power became the sole monopoly of the Tutsi, who effectively seized power in 1966 and proclaimed the First Republic, headed by Captain Michel Micombero. During Micombero’s regime, power was in-creasingly concentrated in the hands of the Tutsi Hima clan, a small ethno-regional group from the southern province of Bururi, that the French historian Chre´tien calls the Bururi mafia (1997).
In 1972, a Hutu insurgency started in southwestern Burundi resulting in consider-able loss of life among the Tutsi residents. The subsequent Tutsi army repression was dramatic. From May to August 1972, all educated Hutus and members of the Hutu elite were systematically eliminated or fled into exile (Lemarchand 1994). This mas-sacre of educated Hutus reduced their status to an oppressed underclass and reduced future Hutu opposition for over a generation.4
The next major confrontation was in 1988, when a Hutu insurgency began in the north. As in 1972, army repression was swift and took a heavy toll on local Hutus.
3. There is also evidence showing the adverse effects of prenatal health shocks (Steinet al.2004; Almond 2006).
However, unlike 1972, the international community condemned the massacres and pressured the Buyoya regime to liberalize its political system. In June 1993, this led to the first free and fair elections in post-independence Burundi.5 Unfortu-nately, the democratic transition did not last. In October 1993, Melchior Ndadaye, the first democratically elected president and a Hutu, was assassinated by Tutsi army elements in a failed coup attempt, marking the start of another civil war. As the news spread to the rural provinces, Hutu peasants committed large-scale massacres of Tutsis and Uprona Hutus.6 Chre´tien (1997) describes the massacres saying districts in certain provinces were ‘‘almost completelyÔcleansedÕof all Tutsi elements.’’ Within days, approximately 100,000 Burundians lost their lives in what was later acknowledged as genocide (United Nations 1996). The Tutsi army retal-iated against the Hutus, continuing what would become the most severe civil war in Burundi’s history, both in terms of human lives and socioeconomic destruction. Unlike prior wars that began with a localized Hutu insurgency followed by severe but random Tutsi army reprisals, this crisis was a more traditional war, with two opposing armed and organized factions and an impact on almost the entire country (Ndikumana 2000).7
B. Spatial and Temporal Intensity of the Conflict
In this analysis of child health, the exact timing and location of the civil war plays an important role.8We describe the war’s evolution through time and space as follows:
• January 1994 to July 1996: Spread of civil war throughout the country (see Figures 1 and 2).
• July 1996 to August 2000: Return of Major Buyoya to power after a bloodless coup. Lower civil war intensity in most provinces and signing of the Arusha Peace Accords in 2000.
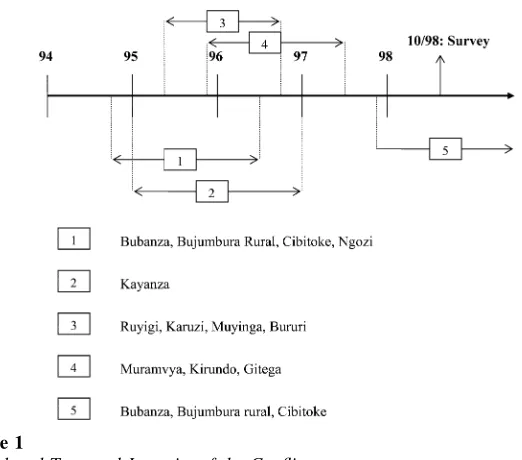
Figure 1 sketches a more detailed evolution of the conflict, defined at the province-month level.9Fighting began in October 1994 in the northwestern provinces of Cibi-toke, Bubanza, Bujumbura Rural, and Ngozi. By early 1995, violence spread to the bordering Kayanza province, and by April 1995, massacres of civilians and confron-tations between army and rebel forces happened in Karuzi, Bururi, Ruyigi, and
5. The elections resulted in a landslide victory for the opposition party, Frodebu, with 65 of 81 Parliament seats and 64 percent of all votes in the presidential elections (Reyntjens 1993).
6. Uprona Hutus are Hutus loyal to the former unique state party, Uprona, and are therefore seen as traitors to the Hutu cause. Consult Chre´tien and Mukuri (2000) for an overview of the massacres that followed the coup. 7. Burundi’s conflict had detrimental effects on the Rwandan situation. The killing of President Ndadaye in October 1993 strengthened the Rwandan extremist Hutu factions in their distrust of Tutsis. The role taken by the local Burundian Hutu administrators to direct the massacres against the Tutsi population as well as the mobilization of the villagers and speed of execution mirrors the modus operandi of the April 1994 Rwandan genocide. Also, many Burundian Hutus who fled army persecution would become perpetrators of the Rwandan genocide (HRW 1999).
Muyinga. By late 1995, fighting took place in the central provinces of Gitega and Muramvya and the northern province of Kirundo. Figure 2 depicts the situation at the end of 1995. By then, conflict had spread to almost all of the provinces of Burundi, with the exception of Cankuzo (in the east of the country) and Rutana and Makamba (in the south of the country).10In July 1996, former president Buyoya seized power again in a bloodless coup d’e´tat backed by the army. During late 1996 and early 1997, armed conflict continued in Kayanza, Muramvya, Kirundo, and Gitega. Meanwhile in April 1997, the Arusha Peace talks between the principal con-flict parties began. As of late 1997, insecurity increased again in Cibitoke, Bubanza, and Bujumbura Rural, provinces which remained unsafe until 1999.11
Figure 1
Spatial and Temporal Intensity of the Conflict
Notes: The provinces of Cankuzo and Rutana (not listed in this figure) did not experience any fight-ing and therefore no children in these two provinces were exposed to the civil war. Source of the information used to construct the figure is Chre´tien and Mukuri (2000).
10. By late 1998, Makamba was severely impacted by insurgents operating from neighboring Tanzania. Due to the generalized insecurity in Makamba at the time of the survey, no data were collected (Republic of Burundi 1998).
The various conflict accounts provide no definitive explanation for why the war affected some provinces earlier than others. However, the conflict’s spread was clearly influenced by the rebel base locations in the Democratic Republic of Congo’s North Kivu region next to the borders of Cibitoke, Bubanza, and Bujumbura Rural, which explains why these provinces were first to experience conflict. The presence of the Kibira forest bordering these provinces could explain the subsequent spread of
Figure 2
Spread of the Civil War Across the Provinces of Burundi
war to Kayanza and Ngozi, since rebels passed undetected through the forest. From these initial conflict provinces, the war spread to the rest of the country.
C. Civilian Impacts of the Conflict
According to Human Rights Watch (1998), the civil war in Burundi ‘‘has above all been a war against civilians.’’ They were widely used as proxy targets, with both sides targeting civilians deemed supportive of the other group. Between 1994 and 2001, an estimated 200,000 people lost their lives in the war, a majority of them civilians (UNFPA 2002).12To understand how the war affected the civilian popula-tion and subsequently child health, we focus on three critical areas: displacement, looting of household assets, and the theft and burning of crops.
First, the United Nations Population Fund (UNFPA) conducted a demographic household survey in 2001 and found over 50 percent of the rural Burundi population had been displaced from their homes at least once between 1994 and 2000 due to violence (UNFPA 2002). The average displacement duration was just over one year, meaning three agricultural seasons were missed as households could not cultivate or harvest their fields while displaced (UNFPA 2002). Displacement also meant individ-uals were more likely to contract water and vector-borne diseases while hiding in the forest. As people could not carry significant amounts of food when fleeing their vil-lage, adequate nutrition was a problem. Finally, displacement also implied a lack of access to markets or health clinics as roads were unsafe or these structures had been damaged. Later in the war, civilians were forced into local resettlement camps by the government and camp conditions were poor, being overcrowded and with a lack of food supplies, clean water, or waste disposal (HRW 2000).13The displacement’s
im-pact on aggregate production from 1993 to 1998 showed production declines in cere-als of 15 percent, roots and tubers 11 percent, and fruits and vegetables 14 percent, with particularly dramatic declines in 1994 and 1995 (FAO 1997).14
Second, besides the displacement and killing of civilians, both rebel and govern-ment forces engaged in the looting of civilian property, in particular livestock, caus-ing an unprecedented drop in household welfare levels. Aggregate national figures show the number of tropical livestock units in the country declined by 23 percent from 1990 to 1998, a decline that is predominantly due to theft and pillaging (FAO 1997). At the household level, the results of the UNFPA survey show that the average number of tropical livestock units per household fell from 2.37 before the crisis to 0.42 in 2001 (UNFPA 2002).15
Third, Human Rights Watch reports (1998) document the theft and burning of household crops. Crops were stolen from the field or granaries and coffee trees were
12. This mortality estimate excludes the deaths from the October 1993 ethnic killings.
13. Officially, resettlement camps were set up to protect rural Hutu populations from the Hutu rebel groups, but in reality they were more like prisons (HRW 1998).
particularly targeted for burning. As coffee is the government’s main source of tax revenue, rebels frequently burnt coffee plantations to reduce government revenue, al-though we cannot quantify the extent of this. Coffee also is an important source of income for small farmers, so by losing their crop, farmers had less income to pay for other expenditures, including purchasing food crops or healthcare.
When the conflict ended in a given province, households who were displaced could and did return to their homes and fields. However, humanitarian interventions by either the government or nongovernmental organizations (NGO) after the fighting ended were practically nonexistent, due to the continued insecurity on all roads link-ing the capital, Bujumbura, to the countryside. By early 1995, rebels groups had be-gun to target and kill foreign NGO workers and journalists who left Bujumbura to visit war regions.16Moreover, international development assistance dropped sharply during the crisis, from almost $320 million before 1993 to below $100 million in 1999 (IMF 2007).
III. 1998 Burundi Priority Survey
A. Data Overview
The Burundi Priority Survey, organized by the Burundi Institute of Statistics and Economic Studies in cooperation with the World Bank, was designed to be nationally representative and took place between October 1998 and March 1999.17The survey’s main goal was to evaluate the country’s socioeconomic situation following five years of civil war in order to design an efficient poverty alleviation policy (Republic of Burundi 1998). The 1,064 rural households in the sample that were randomly se-lected for the anthropometrics survey and have children younger than age 5 provide data on 1,442 children between 6 and 60 months of age. However, there are 214 chil-dren that cannot be included in the analysis because of missing height data and 32 children are excluded due to measurement errors in either height or age. These 246 children with missing information potentially pose a selection bias problem. In Appendix 1, we use two alternative approaches to evaluate this problem and find consistent results indicating selection bias is unlikely to be a significant concern. First, we find that along observable dimensions, included and excluded children look
16. Rebel groups spread messages prohibiting humanitarian workers from working in the rural provinces and urging foreigners to leave the country. For instance, following repeated deadly attacks on its personnel, the International Committee of the Red Cross decided to cease its activities in Burundi in late 1995 (Chre´tien and Mukuri 2000).
similar. Second, using regression analysis similar to Fitzgerald, Gottschalk, and Moffitt (1998), we conclude that the civil war does not have a significant impact on the probability of being excluded from the sample and therefore any selection bias is likely to be small. This leaves a final sample of 1,196 children between 6 and 60 months of age.
B. Health and Civil War Variables
Childhood health status has multiple dimensions making it difficult to capture with a single indicator. The relevant literature suggests that child height conditional on age and gender can be objectively measured and is a good indicator of long-run nutri-tional status as height reflects the accumulation of past outcomes (Martorell and Habicht 1986). The goal of our analysis is to estimate the prior war’s impact on a child’s health status at the time of the survey, so we focus on the long-run indicator, child height for age.18We computez-scores for each child’s height for age, where the z-score is defined as the difference between the child’s height and the median height of the same-aged international reference population, divided by the standard de-viation of the reference population. On average, across households in all of rural Bur-undi, children were more than two standard deviations below the average height for age of a reference child.
To construct the conflict exposure variables, we examine, based on Figure 1, whether a specific child was directly exposed to the war during his life and the num-ber of months of exposure. The variables are defined at the province times birth co-hort level, (Conflict Provincej* Exposuret), which allows us to exploit variation
across two dimensions: spatial (variation across provinces) and temporal (within each province, the timing of birth and the timing of the conflict). The first war-exposure variable is a binary measure indicating whether a child was ever exposed to the war. Thus, for a given province that experienced war, for a child who was born before or during the conflict, the variable is coded one; for a child not alive during the war, the variable is coded zero. The second war-exposure variable measures the duration (in months) of conflict exposure. Of the 1,196 rural children in the sample, 707 were exposed to the conflict during their lives and the average duration for these exposed children was 14.7 months.
C. Preliminary Observations
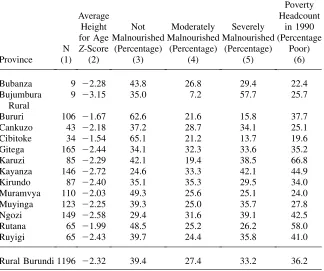
Table 1 shows the provincial disparities in nutritional status (average height for age z-score) and the incidence of malnutrition.19The first salient factor in Table 1 is the magnitude of malnutrition: 60.6 percent of all children in the sample are malnour-ished with 33.2 percent experiencing severe malnutrition. There is variation across provinces in the malnutrition level with rates varying from 34.9 percent in Cibitoke to 75.4 percent in Kayanza. The average height-for-agez-score in rural Burundi is -2.32, meaning that an average child in rural Burundi has a height-for-age that is 2.32 standard deviations lower than an average reference child. The data do not
18. We use the World Health Organization growth charts for the reference population.
contain information about household ethnicity so we are unable to explore this issue, and we do not have any empirical evidence that would allow us to speculate on whether the conflict had differential impacts on children of certain ethnic groups.
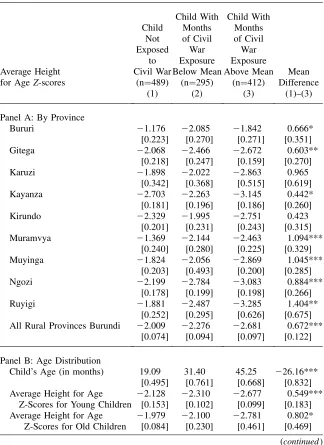
In Table 2 Panel A, we present, broken down by province, average height for age z-scores for children who are not exposed to the civil war (Column 1), children whose duration of war exposure is less than the 14.7 month mean (Column 2), and children who are exposed for more than 14.7 months (Column 3). The 489 non-war-exposed children have an average height for agez-score of -2.009, while the 295 children with limited war exposure have an averagez-score of -2.276. The 412 chil-dren with the longest exposure have an averagez-score of -2.681. The 0.672 standard deviation difference between nonexposed children and children with long exposures (Columns 1 and 3) is statistically significant at the 1 percent level. For every
Table 1
Overview of Nutritional Status and Poverty, By Province
Province
Bubanza 9 22.28 43.8 26.8 29.4 22.4
Bujumbura Rural
9 23.15 35.0 7.2 57.7 25.7
Bururi 106 21.67 62.6 21.6 15.8 37.7
Cankuzo 43 22.18 37.2 28.7 34.1 25.1
Cibitoke 34 21.54 65.1 21.2 13.7 19.6
Gitega 165 22.44 34.1 32.3 33.6 35.2
Karuzi 85 22.29 42.1 19.4 38.5 66.8
Kayanza 146 22.72 24.6 33.3 42.1 44.9
Kirundo 87 22.40 35.1 35.3 29.5 34.0
Muramvya 110 22.03 49.3 25.6 25.1 24.0
Muyinga 123 22.25 39.3 25.0 35.7 27.8
Ngozi 149 22.58 29.4 31.6 39.1 42.5
Rutana 65 21.99 48.5 25.2 26.2 58.0
Ruyigi 65 22.43 39.7 24.4 35.8 41.0
Rural Burundi 1196 22.32 39.4 27.4 33.2 36.2
province, children exposed to the war have lower height for agez-scores than chil-dren from that same province who are not exposed to conflict, and for most provinces the difference is at least statistically significant at the ten percent level. Although the results suggest war had an adverse effect on child health, many factors influence health and we cannot yet conclude a causal relationship.
IV. Identification and Econometric Specification
A. Potential Threats to Identification Strategy
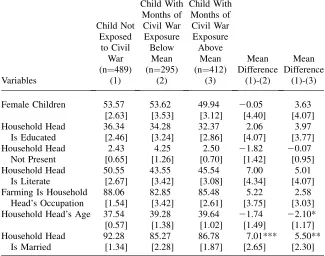
It is well-known that height for age follows a nonlinear pattern in developing coun-tries, with older children having worse z-scores than younger ones (Martorell and Habicht 1986). Since height for age is a stock variable, reflecting current and past health investments, older children accumulate a larger deficit during their lives, resulting in lower height for age compared to younger children. Panel B in Table 2 indicates that children exposed to the conflict are older than nonexposed children (average age of 19.09 months for nonexposed children, 31.40 months for the least war-exposed children, and 45.25 months for the most war-exposed children). There-fore, the relationship between conflict and height in Panel A may simply reflect that children exposed to the conflict are on average older than nonexposed children. We next present preliminary evidence that the conflict-health relationship is not due to this differential age pattern.
In the second row of Table 2 Panel B, we compare average height for agez-scores for children exposed and not exposed to the civil war but restricted to children less than or equal to 24 months old. The average height for agez-score for young non-exposed children is -2.128, while it is, respectively, -2.310 and -2.677 for young chil-dren with limited or extensive war exposure. The difference between nonexposed and extensively exposed young children of 0.549 standard deviations is statistically sig-nificant at the 1 percent level. The same pattern is seen if the data are restricted to children greater than 24 months old. In the third row of Table 2 Panel B, the older most-exposed children have an average height for agez-score of -2.781, the older less-exposed children have an average z-score of -2.100, while the older nonwar-exposed children have an averagez-score of -1.979. There is a difference of 0.802 standard deviations between the most-exposed and nonexposed older children and this difference is significant at the ten percent level. The results provide suggestive evidence that the conflict impact on health is not solely due to older children being more likely to be exposed to the war, as results within each age category show a large significant war impact on children’s height for agez-scores. In the subsequent regression analysis, we control for potential age effects by including year of birth fixed effects.
Table 2
Height for Age Z-Scores, By Province, Age Distribution, Poverty Levels, and Civil War Exposure
Bururi 21.176 22.085 21.842 0.666*
[0.223] [0.270] [0.271] [0.351]
Gitega 22.068 22.466 22.672 0.603**
[0.218] [0.247] [0.159] [0.270]
Karuzi 21.898 22.022 22.863 0.965
[0.342] [0.368] [0.515] [0.619]
Kayanza 22.703 22.263 23.145 0.442*
[0.181] [0.196] [0.186] [0.260]
Kirundo 22.329 21.995 22.751 0.423
[0.201] [0.231] [0.243] [0.315]
Muramvya 21.369 22.144 22.463 1.094***
[0.240] [0.280] [0.225] [0.329]
Muyinga 21.824 22.056 22.869 1.045***
[0.203] [0.493] [0.200] [0.285]
Ngozi 22.199 22.784 23.083 0.884***
[0.178] [0.199] [0.198] [0.266]
Ruyigi 21.881 22.487 23.285 1.404**
[0.252] [0.295] [0.626] [0.675]
All Rural Provinces Burundi 22.009 22.276 22.681 0.672***
[0.074] [0.094] [0.097] [0.122]
Panel B: Age Distribution
Child’s Age (in months) 19.09 31.40 45.25 226.16***
[0.495] [0.761] [0.668] [0.832]
Average Height for Age 22.128 22.310 22.677 0.549***
Z-Scores for Young Children [0.153] [0.102] [0.099] [0.183]
Average Height for Age 21.979 22.100 22.781 0.802*
Z-Scores for Old Children [0.084] [0.230] [0.461] [0.469]
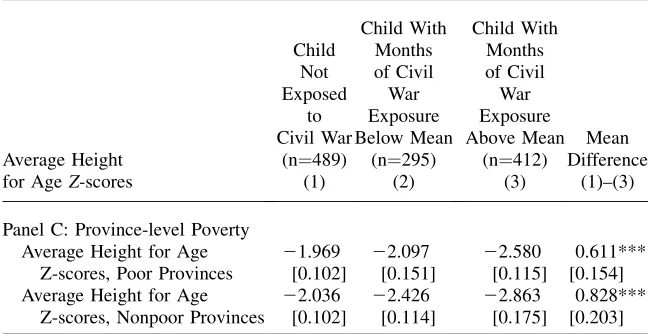
poor provinces, then we would falsely attribute this observed lower height for agez -score to the war, when in fact it is due to the region’s poverty status.
In the first row of Panel C in Table 2, we present average height for agez-scores for exposed and nonexposed children in only the poor provinces. A province is de-fined as being poor if the 1990 prewar poverty headcount (percentage poor) is above the national average of 36.2 percent.20Within the poor provinces, children not ex-posed to the war have an average height for age z-score of -1.969, while children in poor provinces who have limited or extensive war exposure have an average height for agez-score of -2.097 or -2.580, respectively. The difference between no exposure and extensive war exposure of 0.611 standard deviations is statistically significant at the 1 percent level. Similarly, within nonpoor provinces, children with extensive con-flict exposure have 0.828 standard deviations lower height for agez-scores than non-exposed children, a difference that is statistically significant at the 1 percent level. These results suggest that poverty is unlikely to be the driving force behind the ob-served lower height for agez-scores of children in civil war regions.
Several additional pieces of evidence indicate that children exposed to the war were not living in predominantly worse-off provinces. First, a higher percentage of children were exposed to the conflict in nonpoor provinces (69.03) compared to poor provinces (53.49), and the difference across regions is statistically significant
Table 2 (continued)
Average Height for Age 21.969 22.097 22.580 0.611***
Z-scores, Poor Provinces [0.102] [0.151] [0.115] [0.154]
Average Height for Age 22.036 22.426 22.863 0.828***
Z-scores, Nonpoor Provinces [0.102] [0.114] [0.175] [0.203]
Notes: Robust standard errors in brackets. *** significant at 1 percent; ** significant at 5 percent; * significant at 10 percent. For children exposed to the war, the average months of war exposure is 14.7 months. In Panel A, Cankuzo and Rutana are not separately reported since no children in those provinces were exposed to the war and Bubanza, Bujumbura Rural, and Cibitoke are not separately reported since all children in those provinces were exposed to the war. In Panel B, children younger than or equal to 24 months are considered young. Prov-inces are defined as poor if the province’s poverty headcount (using 1990 prewar data) is greater than the na-tional average of 36.2 percent. Data source: World Bank and Burundi Statistics Institute 1998 Priority Survey.
at the 1 percent level. Second, provinces that experienced fighting earlier had lower average poverty headcount rates than provinces that became involved in the war later (31.16 versus 37.99 percent). Third, when the war started in 1994, the first affected provinces (Cibitoke, Bubanza, and Bujumbura Rural) were among the richest in Burundi and were ranked first, second, and fifth respectively in a 1990 prewar wel-fare ranking (Republic of Burundi 2003). Taken together, the evidence strongly suggests children exposed to the war were not predominantly in worse-off provinces and that con-flict may have had a negative causal impact on their health. In the subsequent regressions, we include province fixed effects to control for any potential province differences.
The conflict-height relationship in Panel A also could reflect that exposed and non-exposed children have different characteristics or come from different types of households. To examine this possibility, in Table 3, we present tabulations of the child’s gender, head of household’s education, presence, literacy, occupation, age, and marital status broken down by the exposure duration of the child. For most char-acteristics, there are no significant differences between exposed and nonexposed children. The exception to this is for the marital status for the head of households with exposed children. These head of households are significantly less likely to be married and are more likely to be widowed, a direct impact of the civil war. In the regression analysis, we include child and household controls to capture any po-tential differences.
B. Econometric Specification
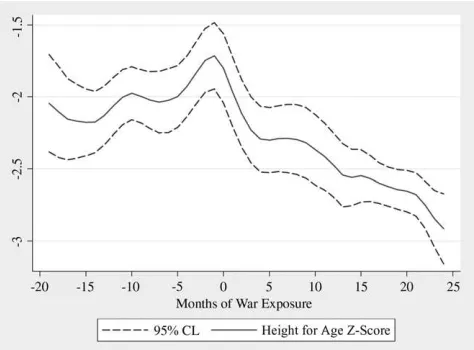
The empirical identification strategy can be illustrated by examining the nonpara-metric relationship between height for agez-scores and the number of months of exposure to the civil war. In Figure 3, we estimate a kernel-weighted local poly-nomial regression of height for agez-scores on months of war exposure using an Epanechnikov kernel. For those children not exposed to the civil war, months of war exposure takes the negative value of the child’s age in months minus six months, so that the youngest nonexposed child is considered to have zero months of war exposure (note that only children older than six months were included in the anthropometrics survey). For nonexposed children, the figure shows the previously discussed expected relationship between age and height for agez-scores with older children having lowerz-scores than younger children. More importantly, the figure shows a considerable drop in average height for agez-scores for children exposed to additional months of conflict.
To build on Figure 3 and the previous tabulations, we first estimate the following baseline province and birth cohort fixed effects regressions:
HAZijt ¼aj+dt+b1ðConflict ProvincejExposuretÞ+eijt
ð1Þ
whereHAZijtis the height for agez-score for childiin provincejwho was born in time
periodt,ajare the province fixed effects,dtare birth cohort fixed effects that are defined by the year in which the child is born, andeijtis a random, idiosyncratic error term.21We
calculate theConflict Provincej* Exposuretvariable first as a binary measure to indicate
a child born in a province that experienced conflict and who was alive during the war, and second, as a continuous measure to indicate for a child born in a province that ex-perienced conflict the duration (in months) of exposure to the war. In regressions only including the binary exposure variable,b1measures the impact of war on children’s health for children who were alive during the conflict and living in regions that experi-enced this negative shock. In regressions only including the continuous exposure dura-tion variable,b1measures the impact on children’s health of an additional month of war exposure. Including all provinces in the regressions allows us to exploit both temporal variation in the timing of the conflict and regional variation across provinces that did not experience war to identify the war’s causal impact on children’s height. We evaluate whether children born in conflict provinces in years when fighting took place have lower height for agez-scores than their peers born after them, relative to those who are born in other regions in the same year. In the robustness specifications in which we restrict the sample to only those provinces that experienced conflict, identification of the impact comes from comparing, within a given province, children who were alive
Table 3
Household and Child Characteristics, By Civil War Exposure
Variables
Female Children 53.57 53.62 49.94 20.05 3.63
[2.63] [3.53] [3.12] [4.40] [4.07]
Household Head 36.34 34.28 32.37 2.06 3.97
Is Educated [2.46] [3.24] [2.86] [4.07] [3.77]
Household Head 2.43 4.25 2.50 21.82 20.07
Not Present [0.65] [1.26] [0.70] [1.42] [0.95]
Household Head 50.55 43.55 45.54 7.00 5.01
Is Literate [2.67] [3.42] [3.08] [4.34] [4.07]
Farming Is Household 88.06 82.85 85.48 5.22 2.58
Head’s Occupation [1.54] [3.42] [2.61] [3.75] [3.03]
Household Head’s Age 37.54 39.28 39.64 21.74 22.10*
[0.57] [1.38] [1.02] [1.49] [1.17]
Household Head 92.28 85.27 86.78 7.01*** 5.50**
Is Married [1.34] [2.28] [1.87] [2.65] [2.30]
during the war with those not yet born, and therefore only the timing of the conflict is exploited.
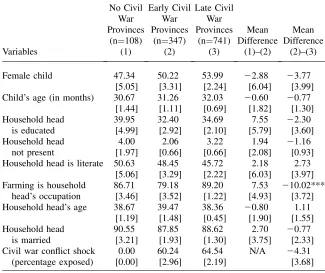
The identification strategy is valid as long as changes over time in average height for agez-scores would be similar across provinces in the absence of the war. Specif-ically, the strategy might be flawed if the timing or duration of the conflict followed a particular pattern in terms of province-level characteristics that are related to changes in height for agez-scores. For instance, if the provinces that experienced the fighting earlier had less educated households and education is correlated with children’s height for age, then we would wrongly find an effect of the war, when the negative health impact was actually due to education differences across provinces. In Table 4, we assign provinces into three categories based on Figure 1 (provinces that did not experience civil war, provinces where the war began early, and provinces where the war began late) and find that along observable dimensions, these three groups of provinces do not appear to be significantly different.22 There are no statistically
Figure 3
Height for Age Z-Scores, by Months of War Exposure, Treating Nonexposed Children as Having Negative Exposure Equal to a Child’s Age
Notes: Kernel-weighted local polynomial regression (using Epanechnikov kernel) of height for age z-score on months of civil war exposure. For those children not exposed to the civil war, months of war exposure takes the negative value of the child’s age in months minus six months, so that the youngest nonexposed child is considered to have zero months of war exposure (note that only chil-dren older than six months were included in the anthropometrics survey). Dashed lines represent the 95 percent confidence bounds, using a bootstrap simulation with 1,000 repetitions to estimate the standard errors. Data source: World Bank and Burundi Statistics Institute 1998 Priority Survey.
significant differences across the three groups in household-level characteristics (head of household education, present in the household, literate, age, and marital sta-tus) or child-level characteristics (child’s gender, age, and percentage exposed to the civil war). The exception to these results is seen in the early war provinces, which had a lower fraction of household heads whose main occupation was farming, which is consistent with those provinces being richer as previously discussed.
Table 4
Female child 47.34 50.22 53.99 22.88 23.77
[5.05] [3.31] [2.24] [6.04] [3.99]
Child’s age (in months) 30.67 31.26 32.03 20.60 20.77
[1.44] [1.11] [0.69] [1.82] [1.30]
Household head 39.95 32.40 34.69 7.55 22.30
is educated [4.99] [2.92] [2.10] [5.79] [3.60]
Household head 4.00 2.06 3.22 1.94 21.16
not present [1.97] [0.66] [0.66] [2.08] [0.93]
Household head is literate 50.63 48.45 45.72 2.18 2.73
[5.06] [3.29] [2.22] [6.03] [3.97]
Farming is household 86.71 79.18 89.20 7.53 210.02***
head’s occupation [3.46] [3.52] [1.22] [4.93] [3.72]
Household head’s age 38.67 39.47 38.36 20.80 1.11
[1.19] [1.48] [0.45] [1.90] [1.55]
Household head 90.55 87.85 88.62 2.70 20.77
is married [3.21] [1.93] [1.30] [3.75] [2.33]
Civil war conflict shock 0.00 60.24 64.54 N/A 24.31
(percentage exposed) [0.00] [2.96] [2.19] [3.68]
To address these potential differential time trends across provinces, we estimate the following equation that includes a province specific time trend in addition to province and birth cohort fixed effects (for a similar empirical strategy see Banerjeeet al.2007): HAZijt ¼aj+dt+b1ðConflict ProvincejExposuretÞ+Province Trendjt+eijt
ð2Þ
where the variables are as previously defined and Province Trendjt is defined as a
province specific time trend to capture potentially different time patterns in each province. The inclusion of this time trend buttresses the argument that changes in average height for agez-scores in these provinces would have been similar in the ab-sence of the civil war.
V. Empirical Results
A. Baseline Regressions
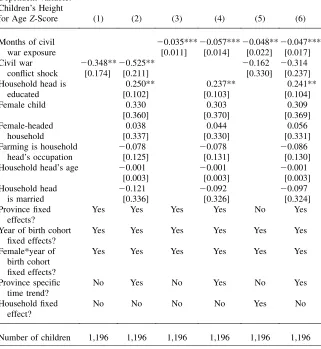
Table 5 presents the regression results for Equations 1 and 2. Each regression includes province dummies, year of birth cohort dummies, and the interaction of child gender and year of birth cohort dummies. All regressions are weighted using survey sampling weights. The variables of interest are the binary civil war conflict shock and the continuous months of exposure measure. Results in Column 1 show a negative impact of the binary civil war variable on children’s health. Those children ex-posed to the war have a height for agez-score 0.348 standard deviations lower than non-exposed children, a reduction that is statistically significant at the five percent level.23 This baseline regression provides evidence of a negative impact of conflict on children’s height for age, controlling for province and birth cohort times gender fixed effects, but these results could be due to omitted province specific time trends or household characteristics. In Column 2, we include additional household controls in the regression, such as whether the household head is educated, female, or a farmer, and the household head’s age and marital status. We also include a province specific time trend to control in a flexible manner for the potentially differential time trend in each province. Adding these controls yields consistent results, with exposed children experiencing 0.525 standard deviations lower height for agez-scores, and
Table 5
Determinants of Anthropometric Outcomes in Rural Burundi
Dependent variable: Children’s Height
for AgeZ-Score (1) (2) (3) (4) (5) (6)
Months of civil 20.035***20.057***20.048**20.047***
war exposure [0.011] [0.014] [0.022] [0.017]
Civil war 20.348**20.525** 20.162 20.314
conflict shock [0.174] [0.211] [0.330] [0.237]
Household head is 0.250** 0.237** 0.241**
educated [0.102] [0.103] [0.104]
Female child 0.330 0.303 0.309
[0.360] [0.370] [0.369]
Female-headed 0.038 0.044 0.056
household [0.337] [0.330] [0.331]
Farming is household 20.078 20.078 20.086
head’s occupation [0.125] [0.131] [0.130]
Household head’s age 20.001 20.001 20.001
[0.003] [0.003] [0.003]
Household head 20.121 20.092 20.097
is married [0.336] [0.326] [0.324]
Province fixed effects?
Yes Yes Yes Yes No Yes
Year of birth cohort fixed effects?
Yes Yes Yes Yes Yes Yes
Female*year of birth cohort fixed effects?
Yes Yes Yes Yes Yes Yes
Province specific time trend?
No Yes No Yes No Yes
Household fixed effect?
No No No No Yes No
Number of children 1,196 1,196 1,196 1,196 1,196 1,196
the coefficient is significant at the 5 percent level. In addition, children in households with educated heads have better height for age z-scores.24
In Columns 3 and 4 we replicate the previous analysis using the continuous months of war-exposure variable. The duration of war exposure has a strong negative impact on children’s height for age z-scores and is significant at the 1 percent level in both specifications. An additional month of war exposure reduces a child’s height for age z-score by 0.057 standard deviations (based on the regression that includes a province specific time trend and household characteristics).25
In Column 6 we present the results of our preferred specification that includes both the binary exposure to any conflict variable and the continuous months of conflict exposure variable. We include province fixed effects, year of birth cohort fixed effects, the interaction of child gender and year of birth cohort fixed effects, household characteristics, and a province specific time trend.26 An additional
month of war exposure decreases a child’s height for agez-score by 0.047 standard deviations and the coefficient is significant at the 1 percent level. The impact of the exposure to any conflict variable is still negative and similar in magnitude to the earlier regressions, but it is no longer significant. This regression that includes both the exposure to any conflict variable (acting as an ‘‘intercept’’ term) and the months of conflict variable (acting as a ‘‘slope’’ term) indicates that much of the war’s negative impact on child health is cumulatively built up over time as the months of exposure increases and is not a level effect of only being exposed to the war. Using these coefficients, children exposed to the conflict for the aver-age duration of 14.7 months will have 0.314 standard deviations lower height for age z-scores due to a level effect and an additional decrease of 0.691 standard deviations due to an exposure duration effect. These results provide the strongest evidence that children exposed to the civil war experience a negative impact of the conflict that lowers their height for agez-scores.
B. Robustness Checks
To confirm the war effect’s robustness, we discuss the results of three alternative specifications. First, we estimate a household or sibling fixed effects model and pre-sent the results in Column 5 in Table 5. Results are consistent with our preferred specification indicating an additional month of war exposure lowers height for age z-scores by 0.048 standard deviations. The sibling difference model is able to control for time invariant household characteristics that are common to all children in the household (for instance parent’s preferences, discount rate, or ability), but note that identification in this regression is driven only by the 176 households that have mul-tiple children with at least one child exposed to the war and one child not exposed to the war.
24. The positive correlation between parent education and child health is among the most persistent find-ings in the empirical literature on child health production functions (see Strauss and Thomas 1998 for an overview).
Second, we test if results are consistent if only the temporal variation in the timing and duration of the conflict is exploited by restricting analysis to alterna-tive province samples. This is done because the two provinces (Cankuzo and Rutana) that did not experience civil war and therefore had no exposed children and the three provinces (Bubanza, Bujumbura Rural, and Cibitoke) in which all children were exposed to the war might be systematically different than the prov-inces in which only some children were exposed to conflict. Identification of the impact in this robustness check comes from comparing, within a given province, children who were alive during the war with those not yet born, and therefore only the time of the conflict is exploited. Results that drop the no-children ex-posed war provinces or the all-children exex-posed war provinces are consistent with our preferred specification indicating an additional month of war exposure reduces height for age z-scores by 0.044 or 0.040 standard deviations, respec-tively. These results provide strong evidence of the validity of the baseline iden-tification strategy to measure the causal impact of civil war on children’s health status and the lack of any province-level selection bias in exploiting both the var-iation across provinces (spatial varvar-iation) and the varvar-iation within each province of the timing and duration of conflict (temporal variation).
Third, the child development literature suggests child stunting usually occurs be-tween 0 and 24 months of age and is considered permanent, with minimal catchup growth at older ages (Martorell 1999; Shrimptonet al.2001). As a robustness check to our preferred regression, we use an alternative conflict shock definition in which only children aged 0 to 24 months old when the conflict occurred in their province are considered exposed to the shock, and children older than 24 months in a province that experienced conflict are not considered exposed to the war. Using this critical age restriction to replicate the Table 5 regressions yields consistent results.
C. Discussion of War Impact Mechanisms
Understanding the specific mechanisms by which the war impacts child health is crit-ical for developing adequate policy responses to protect children from the negative conflict effects. Unfortunately, this study’s data are not sufficiently rich to disentan-gle these channels and conclude which mechanism exclusively drove worse child health for children exposed to the war. To convincingly answer this question, one would need detailed household level data on crop production and assets (including the timing and magnitude of thefts), information about the extent and duration of dis-placement (including changes in nutrition and exposure to disease or resettlement camps), as well as detailed conflict event data at the household and village level to measure war exposure, and child anthropometrics at multiple points in time to cap-ture changes in short and long-run health indicators. Despite the inability to com-pletely disentangle these mechanisms, based on our empirical results and localized case studies conducted by NGOs during and immediately after the war ended, we can begin to speculate on which mechanisms were qualitatively more important in the context of the Burundi civil war.
stocks for consumption smoothing during crisis times such as drought (Kazianga and Udry 2006) or war (Verpoorten 2008), implying that even households who had live-stock holdings would have experienced difficulty protecting their children’s health during the war. The theft of livestock during war would make a household poorer, but such a loss would likely negatively affect all children (those born during as well as after the conflict) as it takes time and money to rebuild herds, and this is not con-sistent with our empirical results in Columns 1 and 2 in Table 5 in which only chil-dren born during the conflict are impacted. However, this is only suggestive evidence against the asset theft mechanism, as the results in our preferred specification (Col-umn 6) that include the binary exposed to any conflict variable and the months of exposure variable suggest there is a level effect between exposed and nonexposed children but the coefficient is not significant at standard levels, meaning we cannot entirely exclude this mechanism.27
Our results seem to offer more support for two other channels through which con-flict may affect child health: violence-induced displacement and the theft and burn-ing of crops. Both mechanisms negatively affect nutrition and displacement also makes exposed children more vulnerable to water and vector-borne diseases. A child exposed to these events would be worse-off compared to a child who did not expe-rience these shocks and we would expect the adverse impact to be larger the longer the child is exposed to it. The results in Columns 1 to 4 in Table 5 are compatible with this reasoning, while the results of our preferred specification are also suggestively consistent with it.28Moreover, these mechanisms are consistent with the observations
of human rights organizations that found that malnutrition was most prevalent among people who had been displaced and were therefore unable to farm (HRW 1998).
VI. Conclusions
In this paper, we combine detailed event data about the timing and location of armed conflict with household survey data to examine the impact of the civil war in Burundi on the health status of young children who were exposed to it. The empirical identification strategy exploits variation in the timing of the civil war across Burundi’s provinces and the related variation in which birth cohorts of children were exposed to the fighting and the duration of their exposure. We estimate a child-health status regression including cohort of birth fixed effects, province of residence fixed effects, and province specific time trends and find that the civil war had a significant adverse effect on height for agez-scores. Research by nongov-ernmental organizations (Doctors Without Borders 2004) finds that children are among the most affected by conflict and the identification strategy used in this paper allows us to empirically confirm and quantify the magnitude of this negative war
27. Finally, the asset theft mechanism, by making households poorer, means exposed children would ac-cumulate more poverty-induced height deficit (as discussed previously), which is consistent with our em-pirical results, but it is unlikely that the continuous months of exposure variable would show such an impact in response to asset theft.
impact on children. Children exposed to the conflict during their lives have a height for age z-score that is reduced by 0.047 standard deviations for each additional month of war exposure compared to nonexposed children, and for children exposed to the war for the average exposure duration they will have one standard deviation lower height for age z-scores than nonexposed children. This causal effect of war on children’s health is robust to the inclusion of a variety of household level control variables, province time trends, different definitions of conflict exposure, sibling fixed effects estimation, and alternative sample specifications that exploit only vari-ation in the timing of the crisis.
The empirical results show that exposure to war during early childhood signifi-cantly affects children’s health outcomes and the longer the exposure, the larger the impact. The negatively impacted health status of Burundian children could lead to adverse welfare effects in the long-run. Recent research has shown that chronic malnutrition during childhood (measured by height for age) is associated with sub-stantially less schooling during adolescence, worse adult health, and lower adult pro-ductivity. Hence, it is likely that the civil war, by negatively affecting child health, will reduce the future welfare levels of these children.
To speculate on the magnitude of this long-run impact, we use the estimated coef-ficients from the Alderman, Hoddinott, and Kinsey (2006) paper on Zimbabwe that links child health and schooling and the Appleton (2001) paper on Uganda that cal-culates individual returns to primary education combined with our measurements of the size of the negative war impact on Burundian children’s health. A Burundi child exposed to the conflict for the average duration will have a 0.314 standard deviation lower height for agez-score due to a level effect and an additional decrease of 0.691 standard deviations due to an exposure duration effect. Using the estimates from the Zimbabwe paper (Alderman, Hoddinott, and Kinsey 2006), this total one standard deviation reduction in height effect will translate into 0.678 fewer grades completed and an increase of 4.8 months in the age at which children start school. Using the individual returns to primary education based on data from Uganda (Appleton 2001), this foregone schooling due to the Burundi civil war will translate into a 20.5 percent reduction in expected adult wages. Following the end of conflict, im-proved child health should be a tangible peace dividend, although there will still be a generation of children who were exposed to the conflict and it is likely that the civil war in Burundi (and civil wars in general) will continue to have adverse effects for these children long after the fighting ends.
Appendix 1
Potential Selection Bias for Missing Children
The 1064 rural households in the Priority Survey that were randomly selected for the anthropometrics survey and have children younger than age 5 provide data on 1442 children between 6 and 60 months of age. There are 214 children who cannot be in-cluded in the child health analysis because of missing height data.29An additional 32
Table A1
Female child 52.76 54.07 21.31
[1.44] [3.18] [3.50]
Child’s age (in months) 31.59 30.17 1.41
[0.42] [0.99] [1.03]
Household head is educated 34.95 37.40 22.45
[1.38] [3.09] [3.35]
Household head not present 3.68 1.63 2.05
[0.54] [0.81] [1.26]
Household head is literate 49.00 49.59 20.60
[1.45] [3.19] [3.50]
Farming is household 86.54 89.84 23.30
head’s occupation [0.99] [1.93] [2.35]
Household head’s age 38.09 37.36 0.73
[0.31] [0.74] [0.77]
Household head is married 88.88 90.24 21.36
[0.91] [1.90] [2.18]
Panel B: Probit Regressions Estimating Probability To Be Included in the Sample, Using Fitzgerald-Gottschalk-Moffit Regression Method
Dependent variable:
Probability to be included in sample (1) (2) (3)
Civil war conflict shock 0.023 0.015 20.060
[0.123] [0.126] [0.136]
Province fixed effects? No Yes Yes
Year of birth cohort fixed effects? No Yes Yes
Province specific time trend? No No Yes
Number of children 1,442 1,442 1,442
children are excluded from the analysis due to measurement errors in either height or age (for instance a height of 775 cm or an age of 326 months).30These 246 children with missing information potentially pose a selection bias problem. We use two al-ternative approaches to evaluate this problem and find consistent results indicating selection bias is unlikely to be a significant concern.
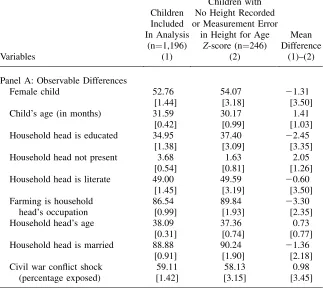
The first approach is to compare the 1196 children who were included in the anal-ysis with the 246 excluded children along as many observable dimensions as possi-ble. Results for this comparison are presented in Appendix Table A1, Panel A, which shows the mean differences in covariates for the included and excluded children. The children appear to come from similar types of households, with the percentage of household head’s education level, occupation, presence, literacy, age, gender, and marital status not showing any significant differences across the two groups. Average age and gender of the child also appear to be similar for both groups of children. Fi-nally, the excluded children are no more likely to have been exposed to the civil war shock. Since none of the covariates are significantly different across the two groups of children, this suggests that, at least along observable dimensions, selection effects are likely to be minimal or absent.
The second approach modifies the method proposed by Fitzgerald, Gottschalk, and Moffit (1998) to analyze attrition in a panel data setting. In Appendix Table A1, Panel B, we present results of a probit regression analysis where the dependent vari-able is the probability of being included in the sample. For the 1,196 children in-cluded in the health analysis, the variable is coded one and for the 246 exin-cluded children, it is coded zero. We examine whether the civil war shock influences the probability of being included in the sample. If the shock has a significant impact on the probability of being included, then the parameter estimates in our subsequent analysis are likely to be biased. In Column 1, we estimate the probability of being included in the sample as a function only of the civil war shock, and the resulting coefficient is small and insignificant. In Column 2, we add province and year of birth cohort fixed effects, as in Table 5, and the coefficient for the civil war shock remains insignificant. Finally, in Column 3, in addition to province and year of birth cohort fixed effects, we include a province specific time trend. The civil war coefficient remains insignificant. From these results, we conclude that the civil war does not have a significant impact on the probability of being excluded from the sample and therefore any selection effects are likely to be small.
References
Akresh, Richard, Philip Verwimp, and Tom Bundervoet. 2007. ‘‘Civil War, Crop Failure, and Child Stunting in Rwanda.’’ World Bank Policy Research Working Paper No. 4208. Alderman, Harold, Jere Behrman, Victor Lavy, and Rekha Menon. 2001. "Child Health and
School Enrollment: A Longitudinal Analysis."Journal of Human Resources36(1):185– 205.
Alderman, Harold, John Hoddinott, and Bill Kinsey. 2006. ‘‘Long Term Consequences of
Early Childhood Malnutrition.’’Oxford Economic Papers58(3):450–74.
Almond, David. 2006. ‘‘Is the 1919 Influenza Pandemic Over? Long-Term Effects of In Utero Influenza Exposure in the Post-1940 U.S. Population.’’Journal of Political Economy
114(4):672–712.
Angrist, Joshua. 1990. ‘‘Lifetime Earnings and the Vietnam Era Draft Lottery: Evidence from
Social Security Administrative Records.’’American Economic Review80(3):313–36.
Appleton, Simon. 2001. ‘‘Education, Incomes, and Poverty in Uganda in the 1990s.’’ CREDIT Research Paper No. 01/22.
Banerjee, Abhijit, Esther Duflo, Gilles Postel-Vinay, and Timothy Watts. 2007. ‘‘Long Run
Health Impacts of Income Shocks: Wine and Phylloxera in 19thCentury France.’’ NBER
Working Paper No. 12895.
Bellows, John, and Edward Miguel. 2006. ‘‘War and Local Collective Action in Sierra Leone.’’ University of California, Berkeley. Unpublished.
Bertrand, Marianne, Esther Duflo, and Sendhil Mullainathan. 2004. ‘‘How Much Should We Trust Difference-in-Differences Estimates?’’Quarterly Journal of Economics119(1): 249–75.
Blattman, Christopher, and Jeannie Annan. 2007. ‘‘The Consequences of Child Soldiering.’’ Households in Conflict Network Working Paper No. 22.
Brakman, Steven, Harry Garretsen, and Marc Schramm. 2004. ‘‘The Strategic Bombing of
German Cities During World War II and Its Impact on City Growth.’’Journal of Economic
Geography4(2):201–18.
Bundervoet, Tom. 2006. ‘‘Estimating Poverty in Burundi.’’ Households in Conflict Network Working Paper No. 20.
Chre´tien, Jean-Pierre. 1997.Le De´fi de l’Ethnisme: Rwanda et Burundi: 1990–1996. Karthala. Paris.
Chre´tien, Jean-Pierre, and Melchior Mukuri. 2000.Burundi, la Fracture Identitaire. Logiques de Violence et CertitudesÔEthniquesÕ, (1993–1996). Karthala. Paris.
Collier, Paul, and Anke Hoeffler. 1998. ‘‘On the Economic Causes of Civil War.’’Oxford Economic Papers50(4):563–73.
Davis, Donald, and David Weinstein. 2002. ‘‘Bones, Bombs, and Break Points: The
Geography of Economic Activity.’’American Economic Review92(5):1269–89.
Doctors Without Borders. 2004.Access to Healthcare in Burundi.Brussels.
Duflo, Esther. 2003. ‘‘Grandmothers and Granddaughters: Old Age Pensions and
Intra-household Allocation in South Africa.’’World Bank Economic Review17(1):1–25.
Eck, Kristine. 2003. ‘‘Collective Violence in 2002 and 2003.’’ InStates in Armed Conflict 2003,ed. Lotta Harbom, 143–66. Uppsala University: Department of Peace and Conflict Research.
Fitzgerald, John, Peter Gottschalk, and Robert Moffit. 1998. ‘‘An Analysis of Sample Attrition in Panel Data.’’Journal of Human Resources33(2):251–99.
Food and Agriculture Organization. 1997. FAO/WFP Crop and Food Supply Assessment Mission to Burundi. Special Report. Rome: U.N. Food and Agricultural Organization. Ghobarah, Hazem, Paul Huth, and Bruce Russett. 2003. ‘‘Civil Wars Kill and Maim People
Long After the Shooting Stops.’’American Political Science Review97(2):189–202.
Gleditsch, Nils, Peter Wallensteen, Mikael Eriksson, Margareta Sollenberg, and Havard
Strand. 2002. ‘‘Armed Conflict 1946–2001: A New Dataset.’’Journal of Peace Research
39(5):615–37.
Guidolin, Massimo, and Eliana La Ferrara. 2007. ‘‘Diamonds are Forever, Wars Are Not: Is
Conflict Bad for Private Firms?’’American Economic Review97(5):1978–93.
Human Rights Watch. 1998.Proxy Targets: Civilians in the War in Burundi.New York:
———. 1999.Leave None to Tell the Story: Genocide in Rwanda.New York: Human Rights Watch.
———. 2000.Emptying the Hills: Resettlement Camps in Burundi. New York: Human Rights
Watch.
Humphreys, Macartan, and Jeremy Weinstein. 2005. ‘‘Disentangling the Determinants of Successful Disarmament, Demobilization, and Reintegration.’’ Stanford University. Unpublished.
Imbens, Guido, and Wilbert van der Klaauw. 1995. ‘‘Evaluating the Cost of Conscription in The Netherlands.’’Journal of Business and Economic Statistics13(2):207–15.
IMF. 2007. Burundi: Poverty Reduction Strategy Paper. IMF Country Report No. 07/46. Washington D.C.: International Monetary Fund.
Kazianga, Harounan, and Christopher Udry. 2006. ‘‘Consumption Smoothing? Livestock,
Insurance, and Drought in Rural Burkina Faso.’’Journal of Development Economics
79(2):413–46.
Lemarchand, Rene´. 1994.Burundi: Ethnocide as Discourse and Practice.Cambridge:
Cambridge University Press.
Maccini, Sharon, and Dean Yang. 2006. ‘‘Under the Weather: Health, Schooling, and Socioeconomic Consequences of Early-Life Rainfall.’’ University of Michigan. Unpublished.
Martorell, Reynaldo. 1999. ‘‘The Nature of Child Malnutrition and Its Long-Term Implications.’’Food and Nutrition Bulletin20(3):288–92.
Martorell, Reynaldo, and Jean-Pierre Habicht. 1986. ‘‘Growth in Early Childhood in Developing Countries.’’ InHuman Growth: A Comprehensive Treatise, ed. Falkner, Frank, and J. Tanner. Plenum Press. New York.
Meng, Xin, and Nancy Qian. 2006. ‘‘The Long Run Health and Economic Consequences of
Famine on Survivors: Evidence from China’s Great Famine.’’CEPR Discussion PaperNo.
5989.
Miguel, Edward, and Ge´rard Roland. 2006. ‘‘The Long Run Impact of Bombing Vietnam.’’ University of California, Berkeley. Unpublished.
Miguel, Edward, Shanker Satyanath, and Ernest Sergenti. 2004. ‘‘Economic Shocks and Civil Conflict: An Instrumental Variables Approach.’’Journal of Political Economy114(4): 725–53.
Moulton, Brent. 1986. ‘‘Random Group Effects and the Precision of Regression Estimates.’’
Journal of Econometrics32(3):385–97.
Ndikumana, Le´once. 2000. ‘‘Towards a Solution to Violence in Burundi: A Case for Political and Economic Liberalization.’’Journal of Modern African Studies38(3):431–59. Nkurunziza, Janvier, and Floribert Ngaruko. 2000. ‘‘An Economic Interpretation of Conflict
in Burundi.’’Journal of African Economies9(3):370–409.
Republic of Burundi. 1995. Note de Strate´gie Economique et Evaluation de la Pauvrete´. Report No. 13592. Bujumbura.
———. 1998. Enquete Prioritaire: Etude Nationale Sur les Conditions de Vie des Populations. Bujumbura: Institut de Statistiques et d’Etudes Economiques du Burundi. ———. 2003. Interim Strategic Framework for Accelerating Economic Growth and
Reducing Poverty. Bujumbura: Poverty Reduction Strategy Paper.
Reyntjens, Filip. 1993. ‘‘The Proof of the Pudding Is In the Eating: The June 1993 Elections in Burundi.’’Journal of Modern African Studies31(4):563–83.
Reyntjens, Filip. 1998. ‘‘Evolution Politique au Rwanda et au Burundi, 1997–1998.’’ In
Reyntjens, Filip, and Stef Vandeginste. 1997. ‘‘Burundi. Evolution Politique en 1996–1997.’’ InL’Afrique des Grands Lacs. Annuaire 1997–1998,eds. Stefaan Marysse, and Filip Reyntjens, 1–13. Paris: L’Harmattan.
Roberts, Les, Zantop, M., Pascal Ngoy, Lubula, C., Mweze, L., and Mone, C. 2003. ‘‘Elevated Mortality Associated with Armed Conflict: Democratic Republic of Congo, 2002.’’Journal of the American Medical Association289(22):2932–36.
Shemyakina, Olga. 2006. ‘‘The Effect of Armed Conflict on Accumulation of Schooling: Results from Tajikistan.’’ Households in Conflict Network Working Paper No. 12. Shrimpton, Roger, Cesar Victora, Mercedes de Onis, Rosangela Costa Lima, Monika
Blossner, and Graeme Clugston. 2001. ‘‘Worldwide Timing of Growth Faltering: Implications for Nutritional Interventions.’’Pediatrics107(5):1–7.
Stein, Aryeh, Patricia Zybert, Margot Van de Bor, and L.H. Lumey. 2004. ‘‘Intrauterine Famine Exposure and Body Proportions at Birth: The Dutch Hunger Winter.’’International Journal of Epidemiology33(4):831–36.
Strauss, John, and Duncan Thomas. 1998. ‘‘Health, Nutrition, and Economic Development.’’
Journal of Economic Literature36(2):766–817.
Suri, Tavneet, and Michael Boozer. 2007. ‘‘Child Labor and Schooling Decisions in Ghana.’’ MIT Sloan. Unpublished.
United Nations. 1996. Report of the Secretary-General on the Situation in Burundi.Security Council, S/1996/660.New York: United Nations.
United Nations Population Fund. 2002. Situation De´mographique et Sociale au Burundi. Re´sultats de l’Enqueˆte Sociode´mographique et de Sante´ de la Reproduction. Burundi: De´partement de la Population.
Verpoorten, Marijke. 2008. ‘‘Household Coping in War And Peacetime: Cattle Sales in
Rwanda, 1991–2001.’’Journal of Development Economics.Forthcoming.