Consolidated Financial Statements
Nine months ended September 30, 2007 and 2006
CONSOLIDATED FINANCIAL STATEMENTS NINE MONTHS ENDED SEPTEMBER 30, 2007 AND 2006
Table of Contents
Page
Consolidated Balance Sheets ………. 1-2
Consolidated Statements of Income ……….. 3
Consolidated Statements of Changes in Shareholders’ Equity ………. 4
Consolidated Statements of Cash Flows ……….. 5-6
Notes to the Consolidated Financial Statem ents .……… 7-5 0
The accompanying notes form an integral part of these consolidated financial statements.
Cash and cash equivalents 2c,3 443,154,589,486 557,267,546,812
Time deposits 2c 6,630,946,422 -
Short-term investments 2d 4,594,200,000 4,750,200,000
Trade receivables 2e,4
Related party 2f,22 90,157,225,980 34,453,249,623
Third parties - net of allowance for doubtful accounts of Rp11,295,820,287 in 2007
and Rp14,184,435,448 in 2006 23j 777,405,259,153 648,728,164,974
Other receivables from third parties - net of allowance for doubtful accounts of Rp7,271,980,358 in 2007 and
Rp7,371,980,358 in 2006 2e,5 6,986,911,881 11,199,253,883
Derivative assets - net 2q,24 555,700,005 -
Inventories - net 2g,6 1,018,664,896,929 921,908,321,373
Advances and deposits 6,23a 92,208,904,218 90,836,301,351
Prepaid taxes 10 11,279,157,012 23,560,834,495
Prepaid expenses 2h 16,666,472,391 26,203,769,391
TOTAL CURRENT ASSETS 2,468,304,263,477 2,318,907,641,902
NON-CURRENT ASSETS
Due from related parties 2f,22 40,925,539,315 51,218,987,050
Deferred tax assets - net 2r,10 7,915,003,829 6,163,882,272
Long-term investments and advances to associated company - net of allowance for doubtful acco unts of Rp13,720,944,026
in 2007 and 2006 2b,2f,7,22 56,859,114,011 51,508,236,089
Fixed assets - net of accumulated depreciation, amortization and depletion of
Rp4,705,429,225,651 in 2007 and 2i,2j,2k,
Rp4,229,667,295,079 in 2006 2l,8 7,597,512,992,481 7,637,546,669,905
Restricted cash and time deposits 12 479,000,000 2,736,067,280
Other non-current assets 2h,2m,8 75,619,896,958 60,122,534,072
TOTAL NON-CURRENT ASSETS 7,779,311,546,594 7,809,296,376,668
TOTAL ASSETS 10,247,615,810,071 10,128,204,018,570
Notes 200 7 200 6
Other payables to third parties 8,16 ,23i 150,774,228,271 135,733,667,872
Accrued expenses 11 ,19 155,324,074,632 189,992,474,719
Taxes payable 2r,10 186,581,950,613 108,173,429,940
Derivative liabilities - net 2q - 5,745,458,051
Current maturities of long-term debts
Loans from banks and financial institutions 2f,1 1,22 259,085,547,260 388,844,061,199
Obligations under capital lease 2k,8,1 2 74,709,893,085 597,755,604
TOTAL CURRENT LIABILITIES 965,953,119,675 952,161,688,713
NON-CURRENT LIABILITIES
Long-term debts - net of current maturities
Loans from banks and financial institutions 2f,1 1,22 1,805,302,555,170 2,446,653,744,477
Obligations under capital lease 2k,8,1 2 55,445,742,269 -
Long-term derivative liabilities 2q,24 54,669,110,579 46,318,973,650
Due to related party 2f,22 2,631,480,659 4,419,975,798
Deferred tax liabilities - net 2r,10 637,299,673,984 599,608,568,337
Estimated liability for employee benefits 2o,21 58,884,294,439 51,868,735,987
Estimated liability for post-retirement health-
care benefits 2o,21 9,563,811,208 6,752,762,569
Pro vision for recultivation 23q 17,347,462,188 11,221,634,413
Deferred gain on sale-and-leaseback
transactions - net 2k 6,315,355,158 7,458,622,813
TOTAL NON-CURRENT LIABILITIES 2,647,459,485,654 3,174,303,018,044
Issued and full y paid - 3,681,231,699 shares 13 1,840,615,849,500 1,840,615,849,500
Additional paid-in capital 2t,14 1,194,236,402,048 1,194,236,402,048
Other paid-in capital 15 338,250,000,000 338,250,000,000
Revaluation increment in fixed assets 2i 229,970,296,236 229,970,296,236
Differences arising from restructuring transactions among entities under
common control 2b 1,165,715,376,569 1,165,715,376,569
Differences arising from changes in the equity
of Subsidiaries 2b 10,444,446,850 4,909,775,318
Retained earnings
Appropriated 17 175,000,000,000 150,000,000,000
Unappropriated 1,677,030,833,539 1,078,041,612,142
TOTAL SHAREHOLDERS’ EQUITY 6,631,263,204,742 6,001,739,311,813
The accompanying notes form an integral part of these consolidated financial statements.
GROSS PROFIT 1,979,442,869,068 1,747,391,538,886
OPERATING EXPENSES 2f,2n,20 ,21,
22 ,23i,2 3k
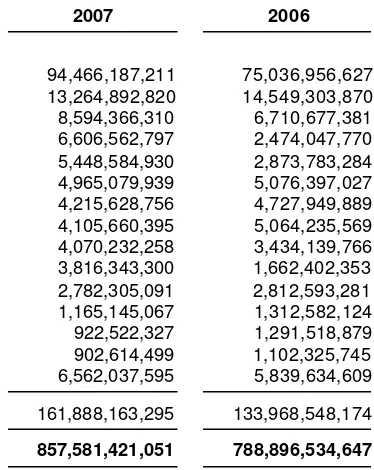
Delivery and selling 695,693,257,756 654,927,986,473
General and administrative 161,888,163,295 133,968,548,174
Total Operating Expenses 857,581,421,051 788,896,534,647
INCOME FROM OPERATIONS 1,121,861,448,017 958,495,004,239
OTHER INCOME (EXPENSE)
Interest income 8,453,598,169 24,429,082,801
Interest expense 11,12 (150,638,512,466) (235,494,899,715)
Total Corporate Income Tax Expense 306,970,497 ,485 251,133,364,630
NET INCOME 699,467,311,078 557,843,155,486
BASIC EARNINGS PER SHARE 2u 190.01 151.54
Differences Arising
from Restructuring Differences Arising
Additional Revaluation Transactions among from Changes Retained Earnings Net
Paid-in Capital * Increment Entities under in the Equity Shareholders’
Notes Capital Stock (Notes 14 and 1 5) in Fixed Assets Common Control of Subsidiaries Appropriated Unappropriated Equity
Balance a s of December 31, 2005 1,840,615,849,500 1,532,486,402,048 229,970,296,236 1,165,715,376,569 6,333,962,836 125,000,000,000 729,260,041,606 5,629,381,928,795
Net income - - - 557,843,155,486 557,843,155,486
Appropriation of retained earnings for general reserve 17 - - - 25,000,000,000 (25,000,000,000 ) -
Distributions of cash dividends 16 - - - (184,061,584,950) (184,061,584,950)
Changes in the equity of a Subsidiary arising from foreign
currency translation adjustment 2b - - - - (971,787,518 ) - - (971,787,518 )
Changes in the equity of a Subsidiary arising from the decline in market values of its Investments in available-for-sale
securities 2b,2d - - - - (452,400,000 ) - - (452,400,000 )
Balance as of September 30, 2006 1,840,615,849,500 1,532,486,402,048 229,970,296,236 1,165,715,376,569 4,909,775,318 150,000,000,000 1,078,041,612,142 6,001,739,311,813
Balance as of December 31, 2006 1,840,615,849,500 1,532,486,402,048 229,970,296,236 1,165,715,376,569 973,936,686 150,000,000,000 1,113,000,473,431 6,032,762,334,470
Net income - - - 699,467,311,078 699,467,311,078
Appropriation of retained earnings for general reserve 17 - - - 25,000,000,000 (25,000,000,000 ) -
Distributions of cash dividends 16 - - - (110,436,950,970) (110,436,950,970)
Changes in the equity of a Subsidiary arising from foreign
currency translation adjustment 2b - - - - 282,537,252 - - 282,537,252
Realized loss on sal e of investments in available-for-sale securities 2b,2d - - - - 4,041,922,912 - - 4,041,922,912
Changes in the equity of a Subsidiary arising from the recovery from decline in market values of its
investments in available-for-sale securities 2b,2d - - - - 5,146,050,000 - - 5,146,050,000
Balance as of September 30 , 2007 1,840,615,849,500 1,532,486,402,048 229,970,296,236 1,165,715,376,569 10,444,446,850 175,000, 000,000 1,677,030,833,539 6,631, 263,204,742
The accompanying notes form an integral part of these consolidated financial statements.
Notes 200 7 2006
CASH FLOWS FROM OPERATING ACTIVITIES
Collections from customers 5,522,279,575,577 5,114,799,449,080
Payments to suppliers and contractors, and for
salaries and other employees’ benefits (4,099,230,222,770) (3,655,306,705,977)
Cash provided by operations 1,423,049,352,807 1,459,492,743,103
Proceeds from claims for tax refund 10 6,710,309,372 13,460,525,368
Receipts of interest income 6,314,631,710 19,6 66,811,839
Payments of taxes (554,564,876,522) (381,111,850,321)
Payment of interest expense and
other financial charges (168,027,450,755) (142,210,010,983)
Net receipts from other operating activities 96,679,451,035 81,017,459,033
Net Cash Provided by Operating Activities 810,161,417,647 1,050,315,678,039
CASH FLOWS FROM INVESTING ACTIVITIES
Proceeds from sale of fixed assets 8,12 181,582,832,044 586,295,001
Purchases of fixed assets (205,191,732,211) (147,807,825,903)
Proceeds from sale of marketable securities - 138,377,257
Investments in shares of stock - (1,818,150,000)
Net Cash Used in Investing Activities (23,608,900,167) (148,901,303,645)
CASH FLOWS FROM FINANCING ACTIVITIES
Proceeds from short-term borrowings 90,720,000,000 -
Payment of bank loans (325,607,680,532) (300,868,620,892)
Payment of dividends (97,433,119,863) (162,089,684,385)
Payment of obligations unde r capital lease 12 (53,448,509,237) (1,588,791,412)
Net payment for derivative transactions (4,075,890,000) (39,595,919,970 )
Proceeds from long-term borrowings - 297,104,804,781
Net Cash Used in Financing Activities (389,845,199,632) (207,038,211,878)
NET EFFECT OF CHANGES IN EXCHANGE
RATES ON CASH AND CASH EQUIVALENTS (371,242,941) (22,413,982,929 )
CASH EQUIVALENTS 396,336,074,907 59,257,163,180
CASH AND CASH EQUIVALENTS
AT BEGINNING OF PERIOD 3 43,386,264,747 498,010,383,632
CASH AND CASH EQUIVALENTS FROM
ACQUIRED SUBSIDIARY AT ACQUISITION DATE 2b 3,432,249,832 -
CASH AND CASH EQUIVALENTS
AT END OF PERIOD 3 443,154,589,486 557,267,546,812
Notes 200 7 2006
Activities not affecting cash and cash equivalents: Payment of obligations under capital lease
using time deposits 12 2,155,353,423 -
Payment of bank loans from restricted cash
accounts 11 - 1,943,252,376,230
Proceeds from long-term borrowings through
restricted cash accounts 11 - 1,141,479,940,019
Payment of interest using restricted cash
accounts 11 - 93,012,389,053
1. GENERAL
PT Indocement Tunggal Prakarsa Tbk. (the “Company”) was incorporated in Indonesia on January 16, 1985 based on notarial deed No. 227 of Ridwan Suselo, S.H. Its deed of incorporation was approved by the Ministry of Justice in its decision letter No. C2-2876HT.01.01.Th.85 dated May 17, 1985 and was published in Supplement No. 57 of State Gazette No. 946 dated July 16, 1985. The Company’s articles of association has been amended from time to time, the latest amendment of which was covered by notarial deed No. 3 dated May 3, 200 7 of Amrul Partomuan Pohan, S.H., LLM concerning, among others, the amendment of Article 12 paragraph 3.c. regarding the limits of authority of the Company’s boards of directors. Such amendments were registered with the Ministry of Justice and Human Rights on May 29 , 2007 .
The Company started its commercial operations in 1985.
As stated in Article 3 of the Company’s articles of association, the scope of its activities comprises, among others, the manufacture of cement, building materials, construction and trading. Currently, the Company and Subsidiaries are involved in several businesses consisting of the manufacture and sale of cement (as core business) and ready mix concrete.
The Company’s head office is located at Wisma Indocement 8th Floor, Jl. Jend. Sudirman Kav. 70-71,
Jakarta. Its factories are located in Citeureup - West Java, Cirebon - West Java and Tarjun - South Kalimantan.
The cement business includes the operations of the Company’s twelve (12) plants located in three different sites: nine at the Citeureup - Bogor site, two at the Palimanan - Cirebon site and one at the Tarjun - South Kalimantan site, with a total combined annual production capacity of approximately 15.4 million tons of clinker. The ready mix concrete manufacturing business comprises the operation of the Company’s two subsidiaries.
Based on the minutes of the extraordinary general meeting of the Company’s shareholders (EGMS) held on October 2, 1989, which were covered by notarial deed No. 4 of Amrul Partomuan Pohan, S.H., LLM., the shareholders approved, among others, the offering of 598,881,000 shares to the public. Based on the minutes of the EGMS held on March 18, 1991, which were covered by notarial deed No. 53 of the same notary, the shareholders approved the issuance of convertible bonds with a total nominal value of US$75 million. On June 20, 1991, in accordance with th e above-mentioned shareholders’ approval, the Company issued and listed US$75 million worth of 6.75% Euro Convertible Bonds (the “Euro Bonds”) on the Luxembourg Stock Exchange at 100% issue price, with an original maturity in 2001. The Euro Bonds were convertible into common shares starting August 1, 1991 up to May 20, 2001 at the option of the bondholders at the initial conversion price of Rp14,450 per share, with a fixed rate of exchange upon conversion of US$1 to Rp1,946.
In 1994, the Company issued 8,555,640 shares on the partial conversion of the Euro Bonds worth US$35,140,000. Accordingly, the Company transferred and reclassified the corresponding portion of the related bonds payable amounting to Rp8,555,640,000 to capital stock and Rp67,320,100,000 to additional paid-in capital. The remaining balance of the Euro Bonds with total nominal value of US$39,860,000 was fully redeemed and settled in 1994.
1. GENERAL (continued)
In the EGMS held on June 25, 1996, th e shareholders resolved to split the par value of the Company’s shares from Rp1,000 per share to Rp500 per share. Accordingly, the number of issued and fully paid capital stock was also increased from 1,207,226,660 shares to 2,414,453,320 shares. This shareholders’ resolution was approved by the Ministry of Justice in its decision letter No. C 2-HT.01.04.A.4465 dated July 29, 1996.
In the EGMS held on June 26, 2000, the shareholders approved the increase in the Company’s authorized capital stock from Rp2 trillion divided into 4 billion shares with par value of Rp500 per share to Rp4 trillion divided into 8 billion shares with the same par value. Such increase in the Company’s authorized capital stock was approved by the Ministry of Law and Legislation in its decision letter No. C-13322 HT.01.04.TH.2000 dated July 7, 2000.
On December 29, 2000, the Company issued 69,863,127 shares to Marubeni Corporation as a result of the conversion into equity of the latter’s receivable from the Company (debt-to-equity swap).
In the EGMS held on March 29, 2001, the shareholders approved the rights issue offering with pre-emptive rights to purchase new shares at Rp1,200 per share. The total number of shares allocated for the rights issue was 1,895,752,069 shares with an option to receive Warrant C if the shareholders did not exercise their rights under certain terms and conditions.
As of May 1, 2001 (the last exercise date), the total shares issued for rights exercised were as follows:
• 1,196,874,999 shares to Kimmeridge Enterprise Pte., Ltd. (Kimmeridge), a subsidiary of
HeidelbergCement (formerly Heidelberger Zement AG (HZ)) (HC), on April 26, 2001, through the conversion of US$149,886,295 debt
• 32,073 shares to public shareholders.
The number of shares issued for the exercise of Warrant C totaled 8,180 shares.
As of September 30 , 2007 and 2006, the members of the Company’s boards of commissioners and directors are as follows:
2007 2006
Board of Commissioners
President Daniel Hugues Jules Gauthier Daniel Hugues Jules Gauthier
Vice President Sudwikatmono Sudwikatmono
Vice President I Nyoman Tjager I Nyoman Tjager
Commissioner Sri Prakash Sri Prakash
Commissioner Lorenz Naeger Lorenz Naeger
Commissioner Bernhard Scheifele Bernhard Scheifele
Commissioner Ali Emir Adiguzel Ali Emir Adiguzel
Board of Directors
President Daniel Eugene Antoine Lavalle Daniel Eugene Antoine Lavalle
Vice President Tedy Djuhar Tedy Djuhar
Director Hans Oivind Hoidalen Hans Oivind Hoidalen
Director Nelson G. D. Borch Nelson G. D. Borch
Director Christian Kartawijaya Christian Kartawijaya
Director Kuky Permana Kumalaputra Kuky Permana Kumalaputra
Director Benny Setiawan Santoso Benny Setiawan Santoso
1. GENERAL (continued)
Total salaries and other compensation benefits paid to the Company’s boards of commissioners and directors amounted to Rp19.7 billion and Rp16 billion for the nine months ended September 30 , 2007 and 2006. As of September 30, 2007 and 2006, the Company and Subsidiaries have a total of 6,339 and 6,544 permanent employees, respectively.
2. SUMMARY OF SIGNIFICANT ACCOUNTING POLICIES
a. Basis of Preparation of the Consolidated Financial Statements
The accompanying consolidated financial statements have been prepared in accordance with generally accepted accounting principles and practices in Indonesia, which are based on Statements of Financial Accounting Standards (PSAK), the Capital Market S upervisory Agency’s (Bapepam) regulations, and Guidelines for Financial Statements Presentation and Disclosures for publicly listed companies issued by the Bapepam for manufacturing and investment companies. The consolidated financial statements have been prepared on the accrual basis using the historical cost concept of accounting, except for inventories which are valued at the lower of cost or net realizable value (market), derivative instruments and short-term investments which are stated at market values, certain investments in shares of stock which are accounted for under the equity method, and certain fixed assets which are stated at revalued amounts.
The consolidated statements of cash flows present receipts and payments of cash and cash equivalents classified into operating, investing and financing activities. The cash flows from operating activities are presented using the direct method.
The reporting currency used in the preparation of the consolidated financial statements is the Indonesian rupi ah.
b. Principles of Consolidation
The consolidated financial statements include the accounts of the Company and those of its direct and indirect subsidiaries (collectively referred to as the “Subsidiaries”) as follows:
2. SUMMARY OF SIGNIFICANT ACCOUNTING POLICIES (continued)
b. Principles of Consolidation (continued)
DAP was established in 1998 for the purpose of acting as the Company’s main domestic distributor of certain cement products.
MBG was acquired in 2004 and is a company which has obtained the right to use (“hak pengelolaan”) the Lembar port in Lombok (where the Company built its terminal), for a period of 20 years from PT (PERSERO) Pelabuhan Indonesia III starting January 1, 2001.
On July 25, 2007, the Company enters effectivel y as a shareholders of PT Gunung Tua Mandiri (GTM) through the issuance of 3,060 new shares of GTM, with a par value of Rp1,000,000 per share, which is equivalent to 51% ownership. GTM is a company which has obtained the local mining rights or “Surat Izin Penambangan Daerah” (SIPD) for exploitation of C classification mining, with andesite type, located at Blok Gunung Tua, Desa Batujajar, Kecamatan Cigudeg, Kabupaten Bogor with covering a total mining area of approximately 30 hectares. The annual production capacity of GTM will be 1.5 million tons of andesite and the reserves of approximately 30 million tons of andesite.
As of September 30, 2007, MBG and GTM ha ve not yet started its commercial operations.
The Company also has five (5) other subsidiaries, all with effective percentages of ownership of 99.99%. The total cost of investments in these entities amounted to Rp20,000,000. Since these entities have no activities and the total cost of the investments in these subsidiaries is immaterial, their accoun ts were no longer consolidated into the consolidated financial statements. Instead, the investments in these subsidiaries are presented as part of “Long-term Investments and Advances to Associated Company” in the consolidated balance sheets. The details of these subsidiaries are as follows:
All signi ficant intercompany accounts and transactions have been eliminated.
Investments in associated companies wherein the Company or its Subsidiaries have ownership interests of at least 20% but not exceeding 50% are accounted for under the equity method, whereby the costs of such investments are increased or decreased by the Company’s or Subsidiaries’ share in the net earnings (losses) of the investees since the date of acquisition and are reduced by cash dividends received by the Company or Subsidiaries from the investees. The share in net earnings (losses) of the investees is adjusted for the straight-line amortization, over a twenty-year period (in view of the good future business prospects of the investees), of the difference between the costs of such investments and the Company’s or Subsidiaries’ proportionate share in the fair value of the underlying net assets of investees at date of acquisition (goodwill).
2. SUMMARY OF SIGNIFICANT ACCOUNTING POLICIES (continued)
b. Principles of Consolidation (continued)
In compliance with PSAK No. 38 (Revised 2004), “Accounting for Restructuring of Entities under Common Control”, the differences between the cost/proceeds of net assets acquired/disposed of in connection with restructuring transactions among entities under common control and their net book values are recorded and presented as “Differences Arising from Restructuring Transactions Among Entities under Common Control” under the Shareholders’ Equity section of the consolidated balance sheets. This PSAK also provides for the realization of the restructuring differences to current year operation if the conditions stated in the PSAK are fulfilled.
In compliance with PSAK No. 40, “Accounting for Changes in the Value of Equity of a Subsidiary/ Associated Company”, the differences between the carrying amount of the Company’s investment in, and the value of the underlying net assets of, the subsidiary/investee arising from changes in the latter’s equity which are not resulting from transactions between the Company and the concerned subsidiary/investee, are recorded and presented as “Differences Arising from Changes in the Equity of Subsidiaries” under the Shareholders’ Equity section of the consolidated balance sheets. Accordingly, the resulting difference arising from the change in the equity of PT Indomix Perkasa in connection with its application of the provisions of PSAK No. 50, “Accounting for Investments in
Certain Securities”, is recorded and presented under this account (see item d below).
c. Cash Equivalents
Time deposits and other short-term investments with maturities of three months or less at the time of placement or purchase and not pledged as collateral for loans and other borrowings are considered as “Cash Equivalents”.
d. Short-term Investments
Investments in equity securities listed on the stock exchanges are classified as “Short-term Investments”.
Equity securities classified as available-for-sale are stated at market values. Any unrealized gains or losses on appreciation/depreciation in market values of the equity securities are recorded and presented as part of “Unrealized Gains/Losses on Available-for-Sale Securities” under the Shareholders’ Equity section of the consolidated balance sheets. These are credited or charged to operations upon realization.
When a decline in the fair value of an available -for-sale equity securities has been recognized directly to equity and there is objective evidence that the equity securities are impaired, the cumulative losses that had been recognized directly in equity are removed from equity and recognized in profit and loss even though the equity securities have not been d erecognized.
e. Allowance for Doubtful Accounts
Allowance for doubtful accounts is provided based on a review of the status of the individual receivable accounts at the end of the year.
f. Transactions with Related Parties
The Company and Subsidiaries have transactions with certain parties which have related party relationships as defined under PSAK No. 7, “Related Party Disclosures”.
2. SUMMARY OF SIGNIFICANT ACCOUNTING POLICIES (continued)
g. Inventories
Inventories are stated at the lower of cost or net realizable value. Cost is determined using the weighted average method, except for spare parts which use the moving average method. Allowance for inventory losses is provided to reduce the carrying value of inventories to their net realizable value.
Net realizable value is the estimated selling price in the ordinary course of business less estimated cost of completion and estimated cost necessary to make the sale.
h. Prepaid Expenses
Prepaid expenses are amortized over the periods benefited using the straight-line method. The non-current portion of prepaid expenses is shown as part of “Other Non-non-current Assets” in the consolidated balance sheets.
i. Fixed Assets
Fixed assets are stated at cost, except for certain assets revalued in accordance with government regulations, less accumulated depreciation, amortization and depletion. Certain machinery and equipment related to the production of cement are depreciated using the unit-o f-production method, while all other fixed assets are depreciated using the straight-line method based on their estimated useful lives as follows:
Years
Land improvements; quarry; and buildings and structures 8 - 30
Machinery and equipment 5 - 10
Leasehold improvements; furniture, fixtures and office
equipment; and tools and other equipment 5
Transportation equipment 5
Land is stated at cost and is not depreciated.
Construction in progress is stated at cost. Cost is reduced by the amount of revenue generated from the sale of finished products during the trial productio n run less the related cost of production. The accumulated cost will be reclassified to the appropriate fixed assets account when the construction is substantially completed and the constructed asset is ready for its intended use.
The costs of maintenance and repairs are charged to operations as incurred; significant renewals and betterments which meet the capitalization criteria under PSAK No. 16, “Fixed Assets”, are capitalized. When assets are retired or otherwise disposed of, their carrying values and the related accumulated depreciation, amortization or depletion are removed from the accounts, and any resulting gains or losses are credited or charged to current operations.
j. Impairment of Assets
2. SUMMARY OF SIGNIFICANT ACCOUNTING POLICIES (continued)
k. Leases
Lease transactions are accounted for under the capital lease method when the required capitalization criteria under PSAK No. 30, “Accounting for Leases”, are met. Otherwise, lease transactions are accounted for under the operating lease method. Assets under capital lease (presented as part of “Fixed Assets” in the consolidated balance sheets) are recorded based on the present value of the lease payments at the beginning of the lease term plus residual value (option price) to be paid at the end of the lease period. Depreciation of leased assets is computed based on the methods and estimated useful lives used for similar fixed assets acquired under direct ownership.
Gain on sale -and-leaseback transactions is deferred and amortized using the same basis and methods as mentioned above.
Obligations under capital lease are presented at the present value of the remaining lease payments to be made.
l. Capitalization of Borrowing Costs
In accordance with revised PSAK No. 26, “Borrowing Costs”, interest charges and foreign exchange differences incurred on borrowings and other related costs to finance the construction or installation of major facilities are capitalized. Capitalization of these borrowing costs ceases when the construction or installation is completed and the related asset is ready for its intended use. In 2007 and 2006, no borrowing costs were capitalized.
m. Deferred Charges
In accordance with PSAK No. 47, “Accounting for Land”, costs incurred in connection with the acquisition /renewal of landrights, such as legal fees, land remeasurement fees, notarial fees, taxes and other expenses, are deferred and amortized using the straight-line method over the legal terms of the related landrights.
n. Revenue and Expense Recognition
Revenues are recognized when the products are delivered and the risks and benefits of ownership are transferred to the customers and/or when the services are rendered. Costs and expenses are generally recognized and charged to operations when they are incurred.
o. Provision for Employee Benefits
(i) Retirement Benefits
The Company has a defined contribution retirement plan (Pension Plan) covering all of its qualified permanent employees and an unfunded employee benefit liability determined in accordance with the existing Collective Labor Agreement (CLA). The unfunded employee benefit liability was calculated by comparing the benefit that will be received by an employee at normal pension age from the Pension Plan with the benefit as stipulated in the CLA after deducting the accumulated employee contribution and the related investment results. If the employer-funded portion of the Pension Plan benefit is less than the benefit as required by the CLA, the Company provides for such shortage.
2. SUMMARY OF SIGNIFICANT ACCOUNTING POLICIES (continued)
o. Provision for Employee Benefits (continued)
(i) Retirement Benefits (continued)
Under PSAK No. 24 (Revised 2004), the cost of providing employee benefits under the CLA/Law is determined using the projected-unit-credit actuarial valuation method. Actuarial gains or losses are recognized as income or expense when the net cumulative unrecognized actuarial gains or losses for each individual plan at the end of the previous reporting year exceed 10% of the present value of the defined benefit obligation at that date. These gains or losses are amortized on a straight-line basis over the expected average remaining working lives of the employees. Further, past service costs arising from the introduction of a defined benefit plan or changes in the benefit payable of an existing plan are required to be amortized over the period until the benefits concerned become vested.
(ii) Post-retirement Healthcare Benefits
In March 2005 , the Company issued a policy regarding p ost-retirement healthcare benefits wherein employees who reach normal retirement age as of January 1, 2003 onwards are entitled to receive healthcare benefits for 5 years from their normal retirement date. The amount of post-retirement healthcare benefits is equivalent to the benefits limited to reimbursement for in-patient hospital bills under the same standard as that which an employee used to have prior to his retirement, for a period not exceeding 60 days per year.
p. Foreign Currency Transactions and Balances
Transactions involving foreign currencies are recorded in rupiah at the middle rates of exchange prevailing at the time the transactions are made. At balance sheet date, monetary assets and liabilities denominated in foreign currencies are adjusted to reflect the rates of exchange quoted at the closing of the last banking day of the year. The resulting gains or losses are credited or charged to current operations, except for those capitalized under PSAK No. 26 (Note 2l).
As of September 30, 2007 and 2006, the rates of exchange used are as follows:
2007 200 6
Euro (EUR1) 12,938.00 11,731.70
U.S. dollar (US$1) 9,137.00 9,235.00
Japanese yen (JP¥100) 7,935.22 7,841.23
Transactions in other foreign currencies are insignificant.
q. Derivative Instruments
2. SUMMARY OF SIGNIFICANT AC COUNTING POLICIES (continued)
q. Derivative Instruments (continued)
The accounting for changes in the fair value of a derivative depends on the documented use of the derivative and the resulting designation. The Company has entered into forward and option currency contracts , and also cross currency interest rate swap to hedge market risks arising from fluctuations in exchange rates relating to its foreign currency denominated loans. However, based on the specific requirements for hedge accounting under PSAK No. 55, the said instruments can not be designated as hedge activities for accounting purposes and accordingly, changes in the fair value of such instruments are recorded directly in earnings.
r. Corporate Income Tax
Current tax expense is provided based on the estimated taxable income for the year. Deferred tax assets and liabilities are recognized for temporary differences between the financial and the tax bases of assets and liabilities at each reporting date. Future tax benefits, such as the carry-forward of unused tax losses, are also recognized to the extent that realization of such benefits is probable.
Deferred tax assets and liabilities are measured at the tax rates that are expected to be applied to the period when any of the assets is realized or any of the liabilities is settled, based on tax rates (and tax laws) that have been enacted or substantively enacted at the balance sheet date.
Amendment to a tax obligation is recorded when an assessment is received or, if appealed, when the result of the appeal is determined.
s. Segment Reporting
The Company and Subsidiaries’ businesses are grouped into three major operating businesses: cement, ready mix concrete and other businesses. Financial information on business segments is presented in Note 18 .
t. Stock Issuance Costs
Based on decision letter No. KEP-06/PM/2000 dated March 13, 2000 of the Chairman of Bapepam, all costs related to the issuance of equity securities should be offset against additional paid-in capital.
u. Earnings per Share
Basic earnings per share is computed by dividing net income by the weighted average number of shares outstanding during the year , which is 3,681,231,699 shares in 2007 and 2006.
v. Use of Estimates
3. CASH AND CASH EQUIVALENTS
The details of cash and cash equivalents are as follows:
2007 200 6
EUR634,100 in 2006) 10,269,611,635 7,439,075,897
U.S. dollar (US$786,659 in 2007 and
US$995,364 in 2006) 7,187,703,374 9,192,182,939
ABN-AMRO Bank N.V.
Euro (EUR1,321,193 in 2007 and
EUR56,457 in 2006) 17,093,589,212 662,334,710
U.S. dollar (US$1,638,286 in 2007 and
US$237,044 in 2006) 14,969,023,568 2,189,104,018
Rupiah 1,868,516,803 4,888,599,314
Japan ese yen ( JP¥2,273,756 in 2007 and
JP¥1,596,264,259 in 2006) 180,427,541 125,166,751,956
PT Bank Mandiri (Persero) Tbk.
Rupiah 25,690,659,681 17,760,117,979
U.S. dollar (US$68,118 in 2007 and
US$406,743 in 2006) 622,397,181 3,756,270,959
Euro (EUR12,093 in 2007 and
EUR302,498 in 2006) 156,457,293 3,548,818,133
The Hongkong and Shanghai Banking Corporation Ltd., Jakarta Branch
Rupiah 3,011,570,683 4,554,569,236
Others
Rupiah 5,273,994,345 3,735,499,268
U.S. dollar (US$141,922 in 2007 and
US$220,849 in 2006) 1,296,737,294 2,039,548,482
Rupiah time deposits
ABN-AMRO Bank N.V. 225,000,000,000 242,000,000,000
PT Bank Central Asia Tbk. 61,500,000,000 53,000,000,000
Standard Chartered Bank., Jakarta Branch - 23,229,640,018
PT Bank Mandiri (Persero) Tbk. - 1,500,000,000
U.S. dollar time deposits
ABN-AMRO Bank N.V. (US$4,500,000 in 2007 and
US$4,500,000 in 2006) 41,116,500,000 41,557,500,000
Total 443,154,589,486 557,267,546,812
3. CASH AND CASH EQUIVALENTS (continued)
Interest rates per annum:
2007 2006
Rupiah time deposits 6.25% - 8.85% 10.25% - 13.00%
U.S. dollar time deposits 5.00% - 5.15% 3.75% - 5.00%
4. TRADE RECEIVABLES
The details of trade receivables are as follows:
2007 2006
Related Party (Note 22)
Cement business
HCT Services Asia Pte., Ltd., Singapore (US$9,867,268 in 2007 and
US$3,730,725 in 2006) 90,157,225,980 34,453,249,623
Third Parties
Cement and ready mix concrete business 788,701,079,440 662,912,600,422
Allowance for doubtful accounts (11,295,820,287 ) (14,184,435,448)
Net 777,405,259,153 648,728,164,974
The movements of allowance for doubtful accounts are as follows:
2007 2006
Balance at beginning of period 11,067,732,391 13,835,340,496
Provision during the pe riod 360,000,000 360,000,000
Receivables written off during the period (131,912,104 ) (10,905,048)
Balance at end of period 11,295,820,287 14,184,435,448
Based on the review of the status of the individual receivable accounts at the end of the year, management believes that the above allowance for doubtful accounts is sufficient to cover any possible losses that may arise from uncollectible accounts.
4. TRADE RECEIVABLES (continued)
The details of other receivables are as follows:
2007 2006
Payments for tax assessments being contested 5,502,658,681 5,502,658,681
5. OTHER RECEIVABLES (continued)
The movements of allowance for doubtful accounts are as follows:
2007 2006
Balance at beginning of period 7,371,980,358 7,371,980,358
Provision during the period - -
Receivables written off during the period - -
Reversal of allowance on doubtful accounts
collected during the period (100,000,000) -
Balance at end of period 7,271,980,358 7,371,980,358
Based on the review of the status of the individual receivable accounts at the end of the year, management believes that the above allowance for doubtful accounts is sufficient to cover any possible losses that may arise from uncollectible accounts.
6. INVENTORIES
Inventories consist of:
2007 2006
Finished goods 69,820,281,242 40,116,320,591
Work in process 86,968,218,414 108,838,382,098
Raw materials 244,608,116,184 201,035 ,443,003
Fuel and lubricants 137,585,380,935 156,494,785,184
Spare parts 526,463,149,886 451,964,353,942
Total 1,065,445,146,661 958,449,284,818
Allowance for losses (46,780,249,732 ) (36,540,963,445)
Net 1,018,664,896,929 921,908,321,373
With the exception of inventories owned by Ind omix Perkasa and PBI amounting to Rp 9.8 billion, all of the inventories are insured against fire and other risks under a combined insurance policy package (Note 8).
The movements of allowance for inventory losses are as follows:
2007 2006
Balance at beginning of period 50,661,601,995 38,184,113,445
Reversals during the period (3,881,352,263) (1,643,150,000)
Balance at end of period 46,780,249,732 36,540,963,445
6. INVENTORIES (continued)
Management believes that the above allowance for inventory losses is sufficient to reduce the carrying amounts of inventories to their net realizable values.
The Company made advance payments to several foreign suppliers for the purchase of certain inventories. The outstanding balances of the purchase advances as of September 30, 2007 and 2006 amounting to Rp22,091,925,072 and Rp34,585,996,483, respectively, are presented as part of “Advances and Deposits” in the consolidated balance sheets.
7. LONG-TERM INVESTMENTS AND ADVANCES TO ASSOCIATED COMPANY
The details of this account are as follows:
7. LONG-TERM INVESTMENTS AND ADVANCES TO ASSOCIATED COMPANY (continued)
The principal activities of the above investees are as follows:
Investee Country of Domicile Principal Business Activity
Stillwater Shipping Corporation Liberia Shipping
PT Cibinong Center Industrial Estate Indonesia Development of industrial estates
PT Pama Indo Mining Indonesia Mining
PT Indo Clean Set Cement Indonesia Production of clean set cement
The details of the equity in net earnings of associated companies, net of goodwill amortization, for the nine months ended September 30 , 2007 and 2006 are as follows:
2007 2006
Stillwater Shipping Corporation 3,606,493,474 4,776,876,808
PT Pama Indo Mining 2,491,068,732 1,635,680,150
PT Cibinong Center Industrial Estate 1,458,263,919 1,375,713,225
Total 7,555,826,125 7,788,270,183
The Company received cash dividends from PT Pama Indo Mining amounting to R p2,099,307,170 in October 2006.
Based on the minutes of the shareholders’ extraordinary meeting held on December 30, 2002, which were covered by notarial deed No. 2 dated January 7, 2003 of Notary Deni Thanur, S.E., S.H., M.Kn, the shareholders approved to liquidate PT Indo Clean Set Cement (ICSC). As of September 30, 2007, the liquidation process of ICSC is still ongoing. The additional equity in net losses of ICSC after 2002 has not been recognized in the consolidated financial statements since ICSC has ceased operations and the effects of the additional equity are immaterial to the consolidated financial statements.
8. FIXED ASSETS
8. FIXED ASSETS (continued)
Construction in progress 298,412,768,646 115,122,692,620 140,170,311,099 273,365,150,167
_____________________________
Transportation equipment 327,384,712,111 30,260,499,038 26,692,067,640 330,953,143,509
Furniture, fixtures and office equipment 185,179,642,028 16,075, 401,052 1,790,375,670 199,464,667,410
_____________________________
8. FIXED ASSETS (continued)
Machineries under installation 195,519,660,443 193,831,036,353
Buildings and structures under construction 54,373,796,114 3,227,626,532
Others 23,471,693,610 12,932,205,561
Total 273,365,150,167 209,990,868,446
Below are the percentages of completion and estimated completion periods of the construction in progress as of September 30, 2007:
Estimated Percentage Estimated Completion
8. FIXED ASSETS (continued)
Depreciation, amortization and depletion charges amounted to Rp 409,362,829,878 and Rp387,972,828,253 for the nine months ended September 30 , 2007 and 2006, respectively.
The Company and Subsidiaries insured their fixed assets and inventories against losses from fire and other insurable risks under several combined policies, with a total insurance coverage of R p136,102,557,100 , US$1,916,748,904, EUR24,610,145 and JP¥32,000,000 as of September 30, 2007. In management’s opinion, the above insurance coverage is adequate to cover any possible losses that may arise from such risks.
Based on the review of asset values at the end of the year, management believes that there is no potential impairment in the values of the assets included in the consolidated financial statements.
The Company and Subsidiaries own building/construction rights or “Hak Guna Bangunan” (HGB), land use rights or “Hak Pakai” (HP) and land ownership rights or “Hak Milik” (HM) over land covering approximately 3,241.69 hectares, and local mining rights or “Surat Izin Penambangan Daerah” (SIPD) covering approximately 10,592.36 hectares at several locations in Indonesia, with legal terms ranging from 5 to 30 years. Management believes that such titles of land rights ownerships can be extended upon their expiration.
As of September 30, 2007, the Company is still in the process of obtaining the titles of ownership or rights over land covering a total area of approximately 36,973 square meters. The Company is also in the process of acquiring land rights covering a total area of approximately 2,483,275 square meters. The total expenditures amounting to Rp 24,146,450,526 as of September 30, 2007 incurred in relation to the above land rights acquisition process are recorded as part of “Other Non-current Assets” in the consolidated balance sheets.
The Company made advance payments for the purchase of certain machinery, equipment and spare parts from several suppliers. The outstanding balances of the purchase advances as of September 30, 2007 and 2006 amounting to Rp 5,788,923,007 and Rp847,822,170 , respectively, are presented as part of “Other Non-current Assets” in the consolidated balance sheets.
9. TRADE PAYABLES
This account consists of the following:
2007 2006
Third Parties - Cement and ready mix concrete business
Rupiah 114,628,407,124 102,235,306,844
U.S. dollar (US$ 783,393 in 2007 and
US$1,389,071 in 2006) 7,157,860,928 12,828,068,641
Other foreign currencies 14,095,089,382 6,446,201,789
Total - Third Parties 135,881,357,434 121,509,577,274
Related Party - Cement business (Note 22) 3,596,068,380 1,565,264,054
Total Trade Payables 139,477,425,814 123,074,841,328
9. TRADE PAYABLES (continued)
The aging analysis of trade payables based on their currency denomination as of September 30, 2007 and 2006 is as follows:
The above trade payables arose mostly from purchases of raw materials and other inventories from the Company’s main suppliers as follows:
Suppliers Materials Supplied
Pertambangan Minyak dan Gas Bumi Negara (PERTAMINA) Fuel
PT Adaro Indonesia Coal
PT Masa Jaya Perkasa Coal
PT Trubaindo Coal Mining Coal
Eurocan Pulp & Paper Co. Kraft paper
Fujian Qingshan Paper Industry Co., Ltd. Kraft paper
Billerud AB Kraft paper
Itochu Co. Gypsum
PT Politama Pakindo Woven paper
10 . TAXATION
a. Taxes Payable
2007 2006
Income taxes
Article 21 16,372,193,411 3,058,421,010
Article 22 1,492,289,852 1,269,480,790
Article 23 1,958,498,542 1,846,743,877
Article 25 15,610,175,461 -
Article 26 549,588,002 332,769,678
Article 29 122,772,430,625 48,907,893,323
Value added tax 27,826,774,720 52,758,121,262
Total 186,581,950,613 108,173,429,940
b. The reconciliation between income before corporate income tax expense, as shown in the consolidated statements of income, and estimated taxable income of the Company for the nine months ended September 30 , 2007 and 2006 is as follows:
2007 2006
Income before corporate income tax expense per
consolidated statements of income 1,006,437,808,563 808,976,520,116
Income of Subsidiaries before corporate income
tax expense - net (16,071,959,804 ) (28,959,815,400)
Reversal of inter-company eliminating entries
during consolidation (3,606,493,474) (4,776,876,808)
Income before corporate income tax expense
attributable to the Company 986,759,355,285 775,239,827,908
Add (deduct):
Temporary differences
Provision for employee benefits - net 3,515,817,032 2,593,194,724
Provision for post-retirement healthcare
benefits - net 2,006,203,208 2,343,448,569
Payments of obligations under capital lease (53,929,229,865 ) -
Depreciation of fixed assets (including
leased assets) (50,828,107,914 ) (93,104,669,952)
Provisions for doubtful accounts and
inventory losses (write-off of accounts
and inventories against allowance) - net (3,981,352,263) (1,643,150,000)
Provision for recultivation - net (Note 23 q) (496,451,750) (1,494,622,228)
(103,713,121,552) (91,305,798,887)
10 . TAXATION (continued)
2007 2006
Permanent differences Non-deductible expenses
Employees’ benefits 19,551,608,631 43,178,863,900
Public relations 4,095,389,800 1,920,343,553
Donations 2,377,455,316 3,788,722,950
Others 811,077,745 1,080,572,722
Equity in net earnings of associated
companies - net (3,949,332,651) (3,011,393,375)
Income already subjected to final tax (4,332,500,626) (19,317,078,275)
18,553,698,215 27,640,031,475
Estimated taxable income of the Company 901,599,931,948 711,574,060,496
Estimated tax loss carryforward at beginning of
year - (256,930,304,261)
Corrections by the Tax Office - 6,359,790,385
Estimated taxable income 901,599,931,948 461,003,546,620
Under existing tax regulations, the tax loss carryforward can be utilized within five (5) fiscal years from the date the tax loss is incurred.
c. The details of corporate income tax expense (benefit) are as follows:
2007 2006
Current
Company 270,462,479,300 138,283,563,800
Subsidiaries 7,497,234,700 9,138,610,500
277,959,714,000 147,422,174,300
Deferred
Company 31,031,036,729 104,470,830,942
Subsidiaries (2,020,253,244) (759,640,612)
29,010,783,485 103,711,190,330
Total 306,970,497,485 251,133,364,630
d. The calculation of estimated claims for income tax refund is as follows:
2007 2006
Current income tax expense
Company 270,462,479,300 138,283,563,800
Subsidiaries 7,497,234 ,700 9,138,610,500
Total 277,959,714,000 147,422,174,300
10 . TAXATION (continued)
2007 2006
Prepayments of income tax
Company 148,070,814,639 91,641,624,219
Subsidiaries 10,451,873,808 8,948,938,608
Total 158,522,688,447 100,590,562,827
Estimated claims for income tax refund - presented as part of “Prepaid Taxes” in the consolidated balance sheets
Company - -
Subsidiaries 3,335,405,072 2,076,281,850
Total for the current year 3,335,405,072 2,076,281,850
Claims for income tax refund from prior years: Company
2005 - 10,414,347,316
Subsidiaries 3,027,171,528 6,510,604,140
Total 6,362,576,600 19,001,233,306
In March 2007, the Company received a decision letter from the Tax Office wherein the Tax Office approved to refund the claim for 2005 income tax and increased the 2005 taxable income by Rp16,328,657,367. Out of the said total amount of assessment, Rp5,292,461,212 will be contested by the Company. In addition, the Company also received withholding tax Article 26 and value added tax assessments for 2005, whereby, according to the Tax Office, the Company has to pay additional taxes and penalties totalling Rp8,916,678,829. The Company has contested the result of the tax assessments.
In March 2006, the Company received a decision letter from the Tax Office wherein the Tax Office approved to refund the claim for 2004 income tax and increased the 2004 taxable income to Rp57,969,361,654. The difference of Rp6,359,790,385 between the amount of taxable income approved by the Tax Office and the amount reported was recognized as an adjustment to the Company’s tax loss carryforward in 2006.
In December 2006, DAP received a decision letter from the Tax Office wherein the Tax Office approved to refund DAP’s 2005 claim for tax refund amounting to Rp5,849,231,775.
In April 2006, DAP received a decision letter from the Tax Office wherein the Tax Office approved to refund DAP’s 2003 claim for tax refund amounting to Rp3,824,659,200, out of the total claim of Rp3,830,534,868.
In March 2006, DAP received a decision letter from the Tax Office wherein the Tax Office approved to refund DAP’s 2004 claim for tax refund amounting to Rp2,946,642,366, out of the total claim of Rp2,991,878,166.
10 . TAXATION (continued)
e. The reconciliation between income before corporate income tax expense (after the reversal of inter -company eliminating entries during consolidation) multiplied by the applicable tax rate and corporate income tax expense as shown in the consolidated statements of income for the nine months ended September 30 , 2007 and 2006 is as follows:
2007 2006
Income before corporate income tax expense 1,006,437,808,563 808,976,520,116
Reversal of inter-company eliminating entries
during consolidation (3,606,493,474) (4,776,876,808)
Combined income, net of loss, before income tax
of the Company and Subsidiaries 1,002,831,315,089 804,199,643 ,308
Tax expense at the applicable tax rate 300,796,893,888 241,189,892,238
Tax effects on permanent differences:
Non-deductible expenses 9,429,357,274 15,609,909,799
Income already subjected to final tax (1,988,054,145) (6,670,956,510)
Equity in net earnings of associated
companies - net (1,184,799,795) (903,418,013)
Others (82,899,737 ) -
Tax corrections - 1,907,937,116
Corporate income tax expense per consolidated
statements of income 306,970,497,485 251,133,364,630
f. Deferred tax assets (liabilities) consist of:
Deferred Tax
Obligation under capital lease 2,635,889,954 36,410,800,652 39,046,690,606
Estimated liability for employee benefits 14,398,065,929 1,054,745,110 15,452,811,039
Allowance for doubtful accounts and
inventory losses 13,156,064,068 (1,194,405,679) 11,961,658,389
Reserve for recultivation 5,353,174,181 (148,935,525) 5,204,238,656
Estimated liability for post -
retirement healthcare benefits 2,267,282,321 601,860,962 2,869,143,283
Others 833,851,800 - 833,851,800
Sub-total 38,644,328,253 36,724,065,520 75,368,393,773
Subsidiaries 7,642,479,221 2,056,178,243 9,698,657,464
Difference in net book value of fixed assets between tax and
accounting bases (639,347,120,920) (16,289,995,784) (655,637,116,704)
Net book value of assets under
capital lease (5,565,844,588) (51,465,106,465) (57,030,951,053)
Sub-total (644,912,965,508) (67,755,102,249) (712,668,067,757)
Subsidiaries (1,747,728,636) (35,924,999) (1,783,653,635)
10 . TAXATION (continued)
Subsidiaries 5,894,750,585 2,020,253,244 7,915,003,829
Net Deferred Tax Liabilities:
Company (606,268,637,255) (31,031,036,729) (637,299,673,984)
Estimated liability for employee benefits 13,156,508,384 777,958,417 13,934,466,801
Allowance for doubtful accounts and
inventory losses 9,412,817,503 (492,945,000) 8,919,872,503
Reserve for recultivation 3,814,876,992 (448,386,668) 3,366,490,324
Estimated liability for post -retirement
healthcare benefits 1,322,794,200 703,034,571 2,025,828,771
Tax loss carryforward 77,079,091,278 (77,079,091,278) -
Others 833,851,800 - 833,851,800
Sub-total 105,619,940,157 (76,539,429,958) 29,080,510,199
Subsidiaries 6,566,388,568 944,637,264 7,511,025,832
Total 112,186,328,725 (75,594,792,694) 36,591,536,031
Deferred Tax Liabilities:
Company
Difference in net book value of fixed assets between tax base and
accounting base (600,757,677,552) (27,931,400,984) (628,689,078,536)
Subsidiaries (1,162,146,908) (184,996,652) (1,347,143,560)
Total (601,919,824,460) (28,116,397,636) (630,036,222,096 )
Net Deferred Tax Assets:
Subsidiaries 5,404,241,660 759,640,612 6,163,882,272
Net Deferred Tax Liabilities:
Company (495,137,737,395) (104,470,830,942) (599,608,568,337)
Management believes that the above deferred tax assets can be fully recovered in future periods.
11 . LONG-TERM LOANS FROM BANKS AND FINANCIAL INSTITUTIONS
This account consists of loans from:
2007 2006
Third parties
Rupiah 276,315,789,472 350,000,000,000
U.S. dollar 252,469,736,958 323,225,000,000
Japanese yen 165,052,576,000 777,022,805,676
11 . LONG-TERM LOANS FROM BANKS AND FINANCIAL INSTITUTIONS (continued)
2007 2006
Related party (Note 22 )
U.S. dollar 1,370,550,000,000 1,385,250,000,000
Total 2,064,388,102,430 2,835,497,805,676
Less current maturities 259,085,547,260 388,844,061,199
Long-term maturities 1,805,302,555,170 2,446,653,744,477
The balances of the above loans in their original currencies are as follows:
2007 2006
Rupiah
Third parties
PT Bank Central Asia Tbk. 276,315,789,472 350,000,000,000
Total rupiah loans 276,315,789,472 350,000,000,000
U.S. dollar Third parties
ABN-AMRO Bank N.V., Jakarta US$ 13,815,789 US$ 17,500,000
Standard Chartered Bank, Jakarta 13,815,789 17,500,000
Related party
HC Finance B.V. 150,000,000 150,000,000
Total U.S dollar loans US$ 177,631,578 US$ 185,000,000
Japanese yen Third parties
ABN-AMRO Bank N.V., Jakarta JP¥ 1,040,000,000 JP¥ 3,534,000,000
Calyon Deutschland, Germany 1,040,000,000 3,534,000,000
Japan Bank for International Cooperation, Tokyo - 1,663,450,503
Marubeni Corporation, Tokyo - 1,178,000,000
Total Japanese yen loans JP¥ 2,080,000,000 JP¥ 9,909,450,503
The ranges of interest rates per annum for the above indebtedness are as follows:
2007 2006
Japanese yen 1.38% - 1.6 8% 1.01% - 3.80%
U.S. dollar 6.22% - 6.56% 5.25% - 6.88%
11 . LONG-TERM LOANS FROM BANKS AND FINANCIAL INSTITUTIONS (continued)
The HC Finance B.V. loan has a term of four (4) years and will be fully repaid at the end of the fourth year (2009) . This loan bears interest at the rate of 1.8% above the 3 Months’ LIBOR with the same interest payment schedule as that of the other H ZMFA creditors. Starting July 1, 2006, the interest rate was reduced from 3 Months’ LIBOR + 1.80% per annum to 3 Months’ LIBOR + 1.15% per annum .
To reduce the exposure to exchange rate fluctuations relating to the above-mentioned refinancing transaction with HC Finance B.V., the C ompany entered into a Cross Currency Interest Rate Swap (CCIRS) transaction with a notional amount of US$150 million with Standard Chartered Bank, Jakarta Branch. The CCIRS contract has the same period as the HC Finance B.V. loan (Note 24 ).
Total interest payments made by the Company amounted to Rp116,380,676,126 (consisting of US$9,657,101 , JP¥44,072,383 and Rp 25,518,106,485) for the nine months ended September 30, 2007 and Rp 14 1,924,648,552 (consisting of US$11,161,648, JP¥269,625,868 and Rp 15,257,469,303) for the nine months ended September 30 , 2006, while the unpaid interest charges amounting to R p34,851,732,096 and Rp55,913,965,767 as of September 30 , 2007 and 2006, respectively, are presented as part of “Accrued Expenses” in the consolidated balance sheet.
For the nine months ended September 30, 2006, total prepayments of the principal loan installments amounted to US$4,334,814 (equivalent to Rp42,383,356,775).
On March 29, 2006, the Company obtained the approval of independent shareholders to obtain a corporate guarantee from HeidelbergCement AG (HC), a related party (which is considered a conflict of interest), in connection with the Company’s plan to refinance its debt. The corporate guarantee is issued to :
• Standard Chartered Bank as Coordinating Lead Arranger of the syndicated loan with a total amount
equivalent to US$158 million (consisting of US$60 million, Rp350 billion and JP ¥7,068 million)
• Marubeni Corporation for the bilateral loan of JP¥1,178 million.
On April 7, 2006, the Company (as the Borrower) together with HeidelbergCement AG (as the Guarantor), signed the syndicated loan facility (“the Facility”) agreement with Standard Chartered Bank (as the Coordinating Lead Arranger and Facility Agent), ABN-AMRO Bank N.V., Jakarta Branch, PT Bank Central Asia Tbk. and Calyon Deutschland acting as the Lead Arrangers with a total amount equivalent to US$158 million. The Company also paid Standard Chartered Bank front-end and agency fee of Rp5,836,364,240 (consisting of US$250,000, JP ¥28,272,000 and Rp1,400,000,000). The Facility consists of the following:
(i) Term loan facility of US$35 million and revolving credit facility of US$25 million, with annual interest rate at US$ LIBOR plus 0.9%
(ii) Term loan facility of Rp350 billion, with annual interest rate at SBI plus 1%
(iii) Term loan facility of JP¥ 7,068 million, with annual interest rate at JP ¥ LIBOR plus 0.9%.
The Facility will expire in five years from the date of the first drawdown. The term loans will be repaid in 19 equal quarterly installments with the first installment commencing six months from the first drawdown date, while for the revolving credit facility, each drawdown shall be repaid on the las t day of its interest period, and may be re-borrowed during the credit facility period.
The above Facility agreement (the “agreement”) covers certain matters, among others ,
11 . LONG-TERM LOANS FROM BANKS AND FINANCIAL INSTITUTIONS (continued)
(ii) negative pledge whereby the Company shall not, among others:
a. pledge, sell, transfer, dispose of any of its assets on term s whereby they are or may be leased to or re -acquired by the Company
b. sell, transfer, or otherwise dispose of any of i ts receivables or recourse them c. items (a) and (b) do not apply for transactions in the ordinary course of business.
On April 11, 2006, the Company (as the Borrower) signed a bilateral loan facility agreement with Marubeni Corporati on (as Lender) to partially refinance the Marubeni Contractor Facility in the amount of JP¥ 1,178 million that was set to mature on December 29, 2012 and the JBIC P11 Guarantee Facility in the amount of JP¥2.4 billion, which was guaranteed by Marubeni Corporation. The loan from Marubeni Contactor Facility was fully paid in October 2006 and the JBIC P 11 Guarantee Facility was fully paid in December 2006.
The bilateral loan bears annual interest at Long-Term Prime Rate (LTPR) plus 0.9%. The guarantee fees paid to Marubeni Corporation arising from the previous loans were reduced from 1% to 0.7% per annum in 2006 .
The Facility and the Ma rubeni Contractor Facility mentioned above are secured by the Corporate Guarantee of HC. The Company pays a guarantee fee of 0.2% per annum of the available loan facility balance as compensation to HC.
On April 20, 2006, the Company terminated the HZMFA loan and repaid the outstanding principal balance of Rp1,801,595,022,984 (consisting of US$98,723,524, JP ¥11,078,193,765 and Rp52,895,195,219) by using the drawdown of the Facility as stated above and the Company’s cash th rough the escrow accounts. In May 2006, following the full repayment of the outstanding balance of the HZMFA loan and the termination of the HZMFA, the Company closed all the escrow accounts and the remaining cash balances in those accounts totaling Rp339,511,121 were transferred to “Cash and Cash Equivalents”.
12 . OBLIGATIONS UNDER CAPITAL LEASE
The future minimum lease payments required under the lease agreements as of September 30, 2007 and 2006 are as follows:
Years 2007 200 6
___________________________________
2006 - 488,179,161
2007 56,538,140,319 125,792,516
2008 34,278,487,294 -
2009 31,782,354,731 -
2010 19,905,773,405 -