School Factors Influencing Indonesian Student Reading Literacy
based on PIRLS Data 2006 and 2011
Safitri Yosita Ratria a
Yogyakarta State University, FIP UNY Karang Malang, Yogyakarta, Indonesia
corresponding e-mail: [email protected]
Abstract: The study was aimed at (1) examining school factors (school sector, teaching and instruction, school resources and technology, school climate, school teachers and leadership activities) influenced reading literacy, and (2) investigating how the factor interacts with reading aspects (reading experience, process and comprehension, and reading attitudes and behaviours). The study used Progress in International Reading Literacy (PIRLS) 2006 and 2011 data that was categorized as secondary data. The study was quantitative research and employed Rasch and hierarchical linear modelling (HLM) analyses. The subjects of data 2006 were 4774 and 2011 were 4779 Primary-School students nested within 158 schools sampled using a random sampling technique. Findings of the study revealed that only some school factors were influential. There were identifiable significant correlations between reading literacy and school factors such as school sector and teaching instruction in 2006, and between school sector, teaching instruction and leadership activities in 2011.
Keywords: school factors, reading literacy, reading aspects
1. INTRODUCTION
Decades of research studies emphasises the importance of reading for human development (OECD, 2010a). Reading functions as a vehicle for enriching knowledge but also as a mean of educating and improving people both as an individual and part of society (Rena, Abedalaziz, & Leng 2013, p.1). Without knowledge, people find it difficult to resolve problems in everyday life. Knowledge will certainly be acquired or learned through several active and continuous learning processes as humans interact with other in homes, schools, and outside schools. Many studies have been undertaken to examine the level of reading literacy by measuring students’ reading activities. One of the largest international comparative studies was the Progress in International Reading Literacy Study (PIRLS). It aimed to measure the capability of four grades of primary student in reading literacy. Likewise, it tested critical thinking in reading
and weakness of student performance on reading and collect in-depth information about school environment, facility, resources, and instruction. Furthermore, it benefits as data in recruiting business to the country and making comparisons for global competitiveness for students in future.
Related to PIRLS, Indonesia has taken the tests in 2006 and 2011 which 45 countries around the world. The participation was aimed to obtain Indonesian reading ability in literacy area compared to students from other countries.Although reading plays essential role for Indonesian human real life, the reality shows otherwise in the tests. An important message was derived from a country that now developing human competitiveness. Indonesia is now concern about the problem of reading literacy achievement in schools (Basuki 2011, p.203). Based on a study by Basuki (2011, p.203), it showed from a research in 1999 that Indonesian reading skill four grade students stands in the lowest level in East Asia with score of 51.7. It was compared to 75.5 (Hong Kong), 74.0 (Singapore), 65.1 (Thailand), and 52.6 (Philippines). The study also revealed that Indonesian students could only master about 30% of reading materials as they finds difficulties in answering questions that require more understanding and reasoning.
Suhardjono (2009, p.11) also mentioned that some factors investigated to the problem of Indonesian and school characteristics and environment. The ability of teachers in teaching reading comprehension was relatively low, reaching only 42.85% of the ideal capabilities which affected by factor of education background, academic qualification, teaching experience, and experience teaching reading. School factors were also influential. There were specific
characteristics of Indonesian school differed from other countries due to diverse type of school namely: public schools, religious public schools, private schools, and religious private schools. This type of schools might be affect the reading ability since one type school define how the environment condition of the schools. Describing how actually Indonesia students practice reading experience, process and comprehension and maintain supportive reading attitudes and behaviours are now still unclear. Thus, it was necessary to explore the trend and factors about reading literacy problem based on data that has been collected from PIRLS survey.
2. RESEARCH QUESTIONS
The purpose of this study is to investigate the influence factors of Indonesian students’ reading literacy based on PIRLS data 2006 and 2011. Given the conceptual framework above, the following
3. REVIEW OF RELATED
Educational Achievement) to measure the outcomes of children’s assess changes into the future, for example, providing educational achievements, policies, and learning context. The test has a countries during the first testing in 2001, then by 45 countries in 2006 and 2011. The test consists of a written reading comprehension and a background questionnaire provided by the PIRLS Reading Development Group (RDG) and National Research Coordinator (NRC) from the initial 35 countries. The written test is designed to fulfil the objectives of the process of comprehension and the purposes of reading, while the background questionnaire is intended to discover the reading behaviours and attitudes. The three PIRLS surveys were conducted in 2001, 2006, and 2011. Anin the students’ learning process. common theme, outlining the story and allowing students to complete the plot, or perform profile character from books (Genick 1997, p.83). Voracious students will be able to become self-selective readers. They also can be encouraged to read closely and carefully. The teaching instruction activities in this study is drawn from In turn, they will be highly skilled as actors who play a digital native in this technology driven era. School resources and technology in schools such as library, science laboratory, and computer laboratory are indicated support the teaching and learning. The availability of library will motivate students to borrow and read books, thus it will foster reading interest among students and minimise the difficulties understanding materials in the class (Tunjung, 2009, p.2) Moreover, there has been substantial effect in the potential of learning activity with the tools of computer in supporting primary school students' reading and literacy development (Wood, Pillinger, & Emma 2006, p.190). The authors say that computer can be also set e-book so students, in the same time, can develop ICT skills. 3.2.4 School Climate
The agenda for reading literacy may be incorporated with how school characteristics. For this purpose, a school must provide good condition and opportunities which help to promote students’ learning activities in regarding to the success and happiness
(Bowring-Carr & West-Burnham 1997 cited in O’Donoghue & Clarke 2010, p.6). The capacity of school climate relates to teachers job satisfaction, parental support, the problems such as student absenteeism, classroom disturbance, cheating, profanity, vandalism, intimidation, physical conflict, drug abuse, weapons, and Harmonious relationship between teachers and students and also among teachers would be a motivation for students to learn better in school. Sympathetic behaviour and can be an example of a teacher or administration may be incentive for students to learn. Upon reviewing the literature, researchers Becker, McElvany, and Kortenbruck (2010 p.774) report that to motivate students in reading is basically accompanied external recognition, one element is teachers. A thing that most affect the success of the students studying in schools namely teacher collaboration. Teacher collaboration reflects on one teacher works together with other teachers to improve teaching and learning practice in an ongoing cycle of commitment that improve team learning (DuFour 2004, p.9). It may not go directly change the reading literacy on student but teacher collaboration may become a powerful opportunity tool to driven teachers across a school system to learn, discuss, and make reflection from what they have done in classroom in order to improve their practice which leads to improve student achievement (Annenberg Institute for School Reform 2004, p.2).
3.2.6 Leadership Activities
Duke (2008, p.285), a principal functions as an instructional leader for teachers in improving teaching learning and for administrative staff in supporting school management systems. The principal must be the particularly in Indonesia, a principal as a leader must be able to provide guidance, increase the willingness of educational personnel, open two-way communication and delegate tasks. Further, a leader must have a special character that includes basic personality skills, experience, and knowledge of administrative oversight. A principal should be able to give provide to the teachers the motivation to improve in teaching and learning. Likewise, in administrative area, a good principal will act as a motivator who has the correct strategy to provide motivation to the educational staff in performing various tasks and functions. This motivation can be fostered through setting the physical environment, work atmosphere, encouragement, giving rewards effectively, and providing a variety of learning resources through the development of a learning resource centre. Hence, the role of principals is a vital element in improving reading literacy in school.
3.2 Reading Aspects
Drawing from the literature above, this study relate to three concerns of reading aspects that stated in the overview of aspects of student’s reading literacy (PIRLS, 2011). Those three aspects are purposes for reading, process of comprehension, and reading behaviours and attitudes. The reading purposes focus on reading for literary experience and reading to acquire and use information. The process of comprehension assesses explicitly stated information, make straightforward inferences, interpret and integrate ideas and information and examine and evaluate content, language,
and textual elements. Reading literacy behaviours and attitudes involves behaviours and attitude that support students to face their individual's potential within a literate society. Those aspects are the foundation for the
assessment (PIRLS, 2011).
However, as developed the research questions, the reading aspects in this study are limited to measure reading experience, process and comprehension, and reading attitudes and behaviours. Thus this study pitches student factors to those three reading aspects.
4. RESEARCH METHOD
were scored to discover the readingaspects namely, reading
experience, process and
comprehension, and reading attitude and behaviours.
This study investigated the factors that most influence Indonesian student reading literacy that results in the final point of reading literacy (plausible value), which would provide an understanding of students’ reading achievement. The data in this study came from the 2006 and 2011 PIRLS for Indonesia conducted by the OECD. The participants of this study were the fourth-grade of primary-school students (aged 9 to 11 years old) that participated in the PIRLS data from government schools and non-government schools throughout Indonesia.
This quantitative study was based on descriptive and inferential statistics with the application of the Rating Scale (Rasch) Model. The nested relationship of the variables was examined through using Hierarchical Linear Modelling (HLM). Initially, in accordance with the utility of the instrument used to gather data related to this study, Rasch Model analysis was employed. Second, a descriptive approach aimed to discover information about the ability of student reading comprehension in fourth grade. Finally, HLM analysis was utilised to investigate the influence of reading literacy (plausible value) based on reading aspects perceived by student factors.
4.2 Secondary Data Analysis
In this study, schools constituted the secondary data that was derived from the PIRLS in 2006 and 2011.The primary school participants come from 168 schools in 2006 and 158 schools in 2011. Four thousand, seven hundred and seventy-four students (2,374 girls
and 2,396 boys) that participated in 2006 and 4,779 (2,413 girls and 2,366 boys) that participated in 2011 were anonymous sample during the time of test. Subjects were both girls and boys in fourth grade. These participants were selected for voluntary and anonymous random sampling during the data collection. Hence, they are called the representative samples.
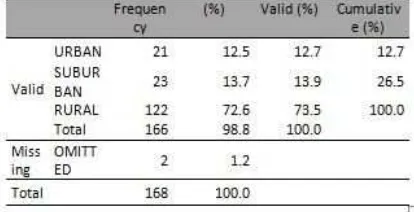
Table 1. Description of the sample of Indonesian school sectors used in 2006
Table 2. Description of the sample of Indonesian school sectors used in 2011
4.3
Research Analysis
items of students in the year of 2011 according to IRT Rasch Analysis by Conquest software.
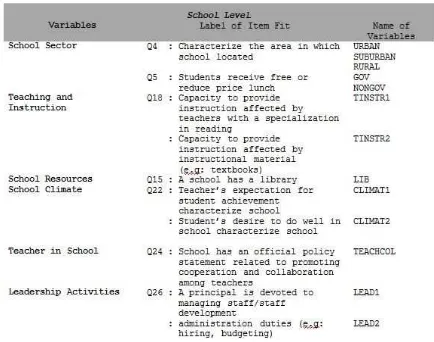
Table 3. Questionnaire Items 2006
Table 4. Questionnaire Items 2011
4.4 HLM Analysis
This study was intended to investigate the interaction between students’ reading aspects scores perceived by student factors derived from a student questionnaire. In order to determine the interaction effect among the groups of the factors, HLM modelling was employed. The representative sample consisted of students that are grouped into the schools. Further, to define the situation in which students were nested in groups of schools, the study uses the two-level HLM model, one at the student level (level 1) and another one at school level (level 2), in which each group was assumed to be a random sample from a population of individuals associated with those groups. For the purpose of HLM analysis, the data of this study is comprised of 4,779 students nested within 158 schools. The outcome of interest was plausible value in reading. The outcome of
interest was plausible value in reading. Some missing data were deleted by this analysis, thus it remains 4172 students and 150 schools for 2011, as is shown on Table 5.
Table 5. Different numbers of each level before and after HLM2 Analysis
There is one common representation of HLM reviewing on multivariate formulation, followed by single-equation representation. The specification of the multilevel formulations started with identification of level 1 or within-group modelling. It was then continued by identification; level 2students were used as level 1 and schools are used as level 2. Further, the techniques were completed by several model and parameter interpretations. Two-level HLM considered the predictors of the individual or unit in which the situation of individuals (students) were nested in two levels, with level 1 students nested in the level 2 unit (school). First is in the level 1 model of the multilevel representation. In addition, in level 2, the model expressed the random level 1 model parameters as functions of the level 2 variable. Three variables were used as dependent variables: reading experience (PRE), process and comprehension (PAC), and reading attitudes and behaviours (PRAB).
Level-1 Model
PVTOTij = β0j + rij
Level-2 Model
β0j = γ00 + u0j
Where,
PVTOTijis reading literacy plausable value
for student i in school j
βoj is the mean of reading literacy plausable
value in school j
γ00is grand mean reading literacy plausable
value
rij is within-group variance in reading
literacy plausable value
uoj is the between-group variance in reading
literacy plausable value
The analysis examined the interaction of school level to reading literacy plausible value. There variables were related to teacher and school which is grouped into one type of school sectors (URBAN, SUBURBAN, RURAL, CITY, VILLAGE, REMOTE, INHIGH, INMED, INLOW), teaching and instruction (TINSTR), school resources and technology (LIB and LAB), school climate (CLIMAT), teachers in school (TEACHCOL), and leadership activities (LEAD).
Model 2006,
Level-1 Model
PVTOTij = β0j + rij
Level-2 Model
β0j = γ00 + γ01*(TINSTR1j) +
γ02*(TINSTR2j) + γ03*(CLIMAT1j)
+ γ04*(CLIMAT2j) +
γ05*(LEAD1j) + γ06*(LEAD2j) +
γ07*(URBANj) + γ08*(SUBURBANj)
+ γ09*(RURALj) +
γ010*(HASLIBRAj)
+γ011*(TEACHCOLj) +
γ012*(GOVj) + γ013*(NONGOVj) + u0j
Model 2011,
Level-1 Model
PVTOTij = β0j + rij
Level-2 Model
β0j = γ00 + γ01*(URBANj)
+γ02*(SUBURBANj) +
γ03*(CITYj) + γ04*(VILLAGEj)+
γ05*(REMOTEj) + γ06*(LABj) +
γ07*(LIBj)
+ γ08*(TINSTR1j) γ09*(TINSTR2j) +γ010*(CLIMAT1j) + γ011*(CLIMAT2j) +
γ012*(TEACHj)
+ γ013*(LEAD1j) + γ014*(LEAD2j) + γ015*(INHIGHj) +
γ016*(INMEDIUMj) + γ017*(INLOWj) + u0j
To sum up, estimating the null model would be useful as a preliminary step in hierarchical linear model analysis for determining meaningful interpretation of PIRLS tests 2006 and 2011. More importantly, it would provide information about the outcome explaining to what factors exactly influence Indonesian student’s reading literacy.
5. ANALYSIS AND
INTERPRETATION DATA
5.1 School sectorclassification of school in each year. For 2006, there were school sector by its area (urban, suburban, and rural) and by student receive free lunch. Differently in 2011, there were school sector by its area (urban, suburban, city, village, and remote) and by the average income level of the school’s area. However, due to meaningfully differences, the estimation was taken by looking at the first and the last categories except for those which only have two categories. Thus, it estimates URBAN – RURAL and GOV – NONGOV from data 2006, and URBAN – REMOTE and INHIGH – INLOW from data 2011. Results are tabulated as follow.
Table 6. Final estimation of fixed effects (with robust standard errors) school sectors 2006
The evidence of URBAN – RURAL indicated that two of the coefficients are statistically significant (URBAN r = 54.78, p<0.001; RURAL -44.70, p<0.001). Nonetheless, two of school areas had different influence. URBAN has positively significant, contrast to RURAL that has negatively significant. This finding showed that, in 2006, urban
schools areas had better performance of students’ reading literacy than rural schools. This might occur since urban school areas were more completely facilitated of resources than rural school areas.
Turn to GOV – NONGOV, the result indicated that two of the coefficients were statistically not significant [GOV (r = 2.80, p>0.05 and NONGOV (r = 11.22, p>0.05)). It proved that the school classification based on giving free lunch or not does not influence on reading literacy.
In 2011, the estimation of URBAN – REMOTE showed that two of the coefficients were statistically significant (URBAN 37.87,p<0.001; REMOTE -35.023, p<0.05). Two of school areas were not similar in the reading literacy performance. URBAN had
positively significant, contrast to REMOTE that had negatively significant. This finding showed that, in 2006, urban schools areas had better performance of students’ reading literacy than rural schools.
Table 7. Final estimation of fixed effects (with robust standard errors) school sectors 2011
Related to the school classification between INHIGH – INLOW, the result indicated that two of the coefficients were statistically significant [(INHIGH (r = -35.023, p>0.05) and INLOW (r = -28.66, p>0.001)]. However, two of them had negatively significant. Thus, it confirmed that the school sector in both high income and low income areas did not influence on reading literacy.
5.2 Teaching and Instruction
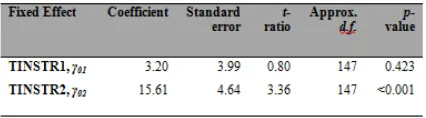
The research question is: How type of instruction by teacher (TINSTR) best predict students’ attitude toward reading? Results of the analysis for 2006 indicated that two of the coefficients were different, in which TINSTR1 was statistically not significant (r = 3.20, p>0.05), while TINSTR was statistically significant (r = 215.61, p<0.001). This finding proves that, in 2006, teaching instruction affected by instructional material such as textbooks was significantly impacts on reading literacy. Different from 2011, unlike TINSTR2, TINSTR1 was significant. It signed that teaching and instruction affected by the availability computers impacts on reading literacy. These findings are reflected in tables as follow.
Table 9. Final estimation of fixed effects (with robust standard errors) teaching and instruction 2011
5.3 School Resources and Technology
The research question is: What type of resources and technology (LIB and LAB) in schools which may help students in reading? While the library (LIB) was the only one factor of school resource and technology for 2006, there were two factors of library (LIB) and laboratory (LAB) for 2011. Result of analysis for 2006 showed that LIB is positively significant (r = 23.43, p<0.05). It indicated that the library has a meaningful relationship with reading literacy. This condition remains stable in 2011 where LIB (r = 16.86, p<0.05) was still significant on PVTOT. The library has clearly contributed to reading literacy. Surprisingly, LAB was not significant on reading literacy. In this case, the activity in laboratory might not stimulate students to do reading activity. In addition, Indonesian students in fourth-grade primary schools might have not been set to use laboratories in school compared to those in high schools.
Table 10. Final estimation of fixed effects (with robust standard errors) school resources and technology 2006
Table 11. Final estimation of fixed effects (with robust standard errors) school resources and technology 2011
5.4 School Climate
The research question is: How does the school climate (CLIMAT) influence students in reading literacy? For 2006, the CLIMAT1 referred to school climate in which teacher’s expectation for student achievement. In addition, CLIMAT2 referred to student’s desire to do well in school. A slightly different from 2006, CLIMAT1 in 2011 meant student’s desire to do well in school but CLIMAT2 was about student absenteeism. Nonetheless, findings showed that all variables did not significant to reading literacy.
Table 12. Final estimation of fixed effects (with robust standard errors) school climate 2006
Table 13. Final estimation of fixed effects (with robust standard errors) school climate 2011
5.5. Teacher in School
= -20.70, p=0.001) to PVTOT. By this indicates that the absence of policy outperformed the presence of policy. It compared to result in 2011, TEACHCOL was not significant (r = 14.95, p>0.05) to PVTOT. It meant that whether there is a policy of teacher collaboration initially did not influence the performance of students’ reading literacy. These findings are shown in tables as follow.
Table 14. Final estimation of fixed effects (with robust standard errors) teacher in school 2006 and 2011
5.6 Leadership Activities
The research question is: How the principals’ policy (LEAD) in supporting reading attitudes and reading behaviours? The school factor of leadership activities were divided into two categories such as managing staff (LEAD1) and managing administration (LEAD2). Results of the analysis for both years of assessment indicated that two of the categories are. This finding gave evidence that leadership activities did not affect directly to reading literacy.
Table 15. Final estimation of fixed effects (with robust standard errors) leadership activities 2006
Table 16. Final estimation of fixed effects (with robust standard errors) leadership activities 2011
5.7 Influence factors
The research question is: What are the most influence factors to reading literacy plausible value between 2996 and 2011? While there were not some indirect influences on some factors above, the next step aimed to examine the relationship between the independent variables and reading literacy with employ interaction within others. The interaction was applied between student factor and reading aspects. Models had been tabulated based on earliest to the last mode that referred to significant variables of reading literacy.
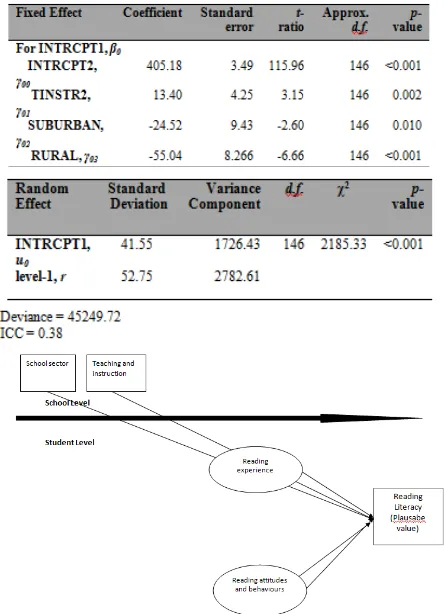
In 2006, school factors analysis carried out evidence that only some factors such as SUBURBAN, RURAL, TINSTR2 were statistically significant[SUBURBAN(r = -24.52, p<0.05, RURAL (r = -55.04,p<0.001), and TINSTR2 (r = 13.40, p<0.01)]. The negative value of suburban and rural school sector area specified that urban school went better than those two of school sectors in affecting reading literacy. In contrast with teaching and instruction affected by instructional textbooks material (refers to Q18 2006) denoted that the more the presence of this factor, the better students perform on reading literacy.
Figure 1. Numbers factor interaction that influence of reading literacy 2006
For the 2006 data set, the ICC was 0.38. It denoted that in 2006, 38% of the variability in student factors scores were estimated to lie between schools, thus it referred to about 62% lied within schools. Additionally, Figure 1 concluded the significant variables that affected reading literacy (plausible value/PVTOT).
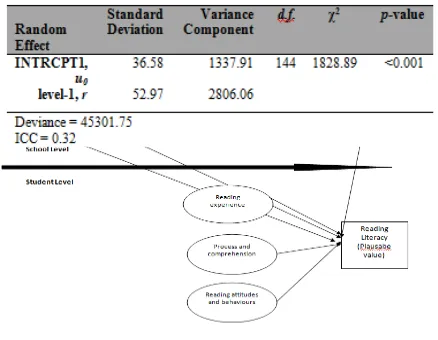
In 2011, school factors analysis carried out evidence that only URBAN, VILLAGE, INLOW, TINSTR1, and LEAD1 were statistically significant [URBAN (r = 25.26, p<0.001, VILLAGE (r = -20.51,p<0.01), INLOW (r = -18.08, p<0.05), TINSTR2 (r = 13.40, p<0.001) and LEAD1 (r = -12.93, p< 0.05)]. The positive value of urban school sector area specified went better than any other school sectors areas in affecting reading literacy. Conversely, the negative coefficient value meant that the performance of reading literacy in village school sector were below that in any other school sector areas. Another sector had negatively value was low income area, which meant that high and medium income of school area were better in reading literacy than that in low income area. In addition, teaching and instruction affected by audio visual resources for reading instruction (refers to Q10 2011) instructional textbooks material denoted that the more the presence of this factor, the better students perform on reading literacy.
For the 2011 data set, the ICC was 0.32. It denoted that in 2011, 32% of the variability in student factors scores were estimated to lie between schools, thus it referred to about 68% lied within schools. What is more, Figure 2 concluded the significant variables that affected reading literacy (plausible value/PVTOT).
Table 18. Significant school level variables influence on Reading Literacy 2011
Figure 2. Numbers factor interaction that influence of reading literacy 2011
In summary, although some of factors were significantly negative on reading plausible value, the significant values indicated that those factors were influential in the performance of Indonesian students’ reading literacy from 2006 to 2011. Thus the influence could be positive and negative.
6
CONCLUSION
1. School sectors were important in terms of reading literacy, especially in the suburban, rural and village sectors. The findings revealed that these three sectors affected reading literacy during the five years of assessment.
2. The capacity to provide instruction was affected by computer and audio visual aspects differently in each year. In 2006, the relationship was between ‘instructions affected by computer’ and reading literacy, while in 2011 it was ‘instruction affected by audio visual resources’ and the reading literacy.
3. Although the demand for libraries and laboratories may be crucial, the availability of these resources did not influence reading literacy to a significant degree.
reading literacy in 2006 or2011. Likewise, the school characteristic of absenteeism was not related to reading literacy improvement in either year.
5. The practice of teacher collaboration and peer review was not statistically significant to reading literacy. This factor may influence wider content, such as teaching and learning, rather than students’ reading literacy.
6. The activities of principals in managing staff development and educational goals showed remarkable influence on reading literacy, but only in 2011.
7. The most influential factors on reading literacy between 2006 and 2011 were some of the school factor variables, although these differed in different years. In 2006, the school factor of school sector and teaching instruction directly affected reading literacy. In contrast, in 2011, the school factors teaching and instruction, and leadership activities, had a direct relationship with reading literacy.
7 BIBLIOGRAPHY
Al-sabbah, S.A., Mey, S.C. & Lan, O.S., 2010. The Using of Rasch-Model in Validating the Arabic version of Multiple Intelligence Development Assessment Scale (MIDAS)., 0174343036, pp.574– 579.
Annenberg Institute for School Reform, 2004, Making
School Improvement Part of Daily Practice, Brown
University.
Anon, n.d., Dummy Variables, viewed on 20 November 2013,
<http://web.pdx.edu/~stipakb/download/PA552/>
Anon, 1984. Secondary data analysis : an introduction .
Arifin, 2012, The principal role in improving teachers’ pedagogical competence of Islamic religious education (case study in MTs Aswaja, Magelang).Thesis, State Islamic University Sunan Kaljaga, Indonesia.
Becker, M., McElvany, N. & Kortenbruck, M., 2010. Intrinsic and extrinsic reading motivation as predictors of reading literacy: A longitudinal study.
Journal of Educational Psychology, 102(4),
pp.773–785.
Ben, F., 2010, Student's uptake of physics: a study of south australian and filipino physics students.Thesis, University of Adelaide.
Boslaugh, S., 2007,Secondary data sources for public
health, Cambrige University Press.
Carudin, 2011, Effect of principal leadership. Invotec, 7 (2), pp.131-144.
DuFour, R., 2004. What is a professional learning community? Schools as Learning Communities, 61(8), pp.6-11.
Garson, G.D., 2002. With HLM 7 Software., pp.55–96.
Gil-Flores, J., Torres-Gordillo, J.-J. & Perera-Rodríguez, V.-H., 2012. The role of online reader experience in explaining students’ performance in digital reading.
Computers & Education, 59(2), pp.653–660. Grade,
F., 2011. Timss 2011.
Hao, S. & Johnson, R.L., 2013. Teachers’ classroom assessment practices and fourth-graders' reading literacy achievements: An international study.
Teaching and Teacher Education, 29, pp.53–63.
Imelda, Andreani, W., 2012. Indonesian reading ability of monolingual and multilingual students. Thesis, Bina Nusantara University, Indonesia.
Impact, T., Use, T. & Habits, R., 2009. The Impact of Internet and Television Use on the Reading Habits and Practices of College Students. , 52(April), pp.609–619.
Institute for Objective Measurement, Inc.,
www.rasch.org.
Koziol, N. & Arthur, A., n.d, An Introduction to
Secondary Data Analysis.
Lee, Y.-H. & Wu, J.-Y., 2013. The indirect effects of online social entertainment and information seeking activities on reading literacy. Computers &
Lee, Y.-H. & Wu, J.-Y., 2012. The effect of individual differences in the inner and outer states of ICT on engagement in online reading activities and PISA 2009 reading literacy: Exploring the relationship between the old and new reading literacy. Learning
and Individual Differences, 22(3), pp.336–342.
Lubienski, S.T. & Lubienski, C., 2006. School Sector and Academic Achievement: A Multilevel Analysis of NAEP Mathematics Data. American Educational
Research Journal, 43(4), pp.651–698.
Lunz, M.E. & Bergstrom, B.A., 2013. An Empirical Study of Computerized Adaptive Test Administration Conditions. , 31(3), pp.251–263.
Luu, K. & Freeman, J.G., 2011. An analysis of the relationship between information and communication technology (ICT) and scientific literacy in Canada and Australia. Computers &
Education, 56(4), pp.1072–1082.
Mackey, F.D., 2006, I never used to read, pettern of talk in regulative and instructional discourse: a systemic functional approach to analysing a literacy difficulty, Thesis, University of Adelaide.
Marzban, A., 2011. Improvement of reading comprehension through computer-assisted language learning in Iranian intermediate EFL students.
Procedia Computer Science, 3, pp.3–10.
Marzban, A., 2011. Investigating the role of multimedia annotations in EFL reading comprehension.
Procedia - Social and Behavioural Sciences, 28,
pp.72–77.
PIRLS 2011, International student schievement in reading
chapter 1, TIMSS & PIRLS Study Centre, Boston
College.
Pitkin, A.K. & Vispoel, W.P., 2013. Differences Between Self-Adapted and Computerized Adaptive Tests : A Meta-Analysis. , 38(3), pp.235–247.
Report, I., 2001. PIRLS 2001 International Report,
Rocklin, T.H. O'Donnell, A.M & Holst, P.M., 1995, Effects and underlying mechanism of self-adapted testing, Journal of Educational Psychology, 87(1), pp.103-116.
Schneider, J.L. & Foot, R., 2013. Teaching Strategies to Support Vocational Education Students ’. , (September), pp.37–41.
Schubert, F. & Becker, R., 2010. Social inequality of reading literacy A longitudinal analysis with cross-sectional data of PIRLS 2001 and PISA 2000 utilizing the pair wise matching procedure.
Research in Social Stratification and Mobility,
28(1), pp.109–133.
Shiel, G. & Cosgrove, J., 2002, International perspectives on literacy, The Reading Teacher, 55(7), pp.690-692.
Sideridis, G. & Padeliadu, S., 2013. Creating a brief rating scale for the assessment of learning disabilities using reliability and true score estimates of the scale’s items based on the Rasch model. Journal of
learning disabilities, 46(2), pp.115–32.
Stiggins, R & Duke, D 2008, Effective historical leadership requires assessment leadership, The Phi
Delta Kappan, vol.90, no.4, pp. 285-291.
Ten, I.B.R.A., Lie, A. & Andreassen, R., 1999. Leisure time reading and orthographic processes in word recognition among Norwegian third- and fourth-grade students. , (Ehri 1992), pp.65–88.
The Organisation for Economic Co-operation and Development, www.oecd.org.
Tunjung, I.W., 2009, As school library support education in schools. Pp.1-9. Available at: http://bpad-differences. Journal of Educational Measurement, 39 (1), pp.1-37.
Wood, C., Pillinger, C. & Jackson, E., 2010. Understanding the nature and impact of young readers’ literacy interactions with talking books and during adult reading support. Computers &
Zuckerman, G. A., Kovaleva, G.S. & Kuznetsova, M.I., 2013. Between PIRLS and PISA: The advancement of reading literacy in a 10–15-year-old cohort.