Summary Potential increases in plant productivity in re-sponse to increasing atmospheric CO2 concentration are likely to be constrained by nutrient limitations. However, the interac-tive effects of nitrogen nutrition and CO2 concentration on growth are difficult to define because both factors affect several aspects of growth, including photosynthesis, respiration, and leaf area. By expressing growth as a product of light intercepted and light use efficiency (ε), it is possible to decouple the effects of nutrient availability and CO2 concentration on photosyn-thetic rates from their effects on other aspects of plant growth. I used measured responses of leaf photosynthesis to leaf nitro-gen (N) content and CO2 concentration to parameterize a model of canopy radiation absorption and photosynthesis, and then used the model to estimate the response of ε to elevated CO2 concentration for Pinus radiata D. Don, Nothofagus fusca
(Hook. f.) Ørst. and Eucalyptus grandis W. Hill ex Maiden. Down-regulation of photosynthesis at elevated CO2 was repre-sented as a reduction in either leaf N content or leaf Rubisco activity.
The response of ε to elevated CO2, which differed among the three species, was analyzed in terms of the underlying relationships between leaf photosynthesis and leaf N content. The response was independent of leaf N content when photo-synthesis was down-regulated to the same extent at low and high leaf N content. Interactive effects of N availability and CO2 on growth are thus likely to be the result of either differ-ences in down-regulation of photosynthesis at low and high N availability or interactive effects of CO2 and N availability on other aspects of plant growth.
Keywords: canopy model, elevated CO2, photosynthetic
down-regulation.
Introduction
The present increase in atmospheric CO2 concentration is well documented (Watson et al. 1990), but its long-term effects on growth of terrestrial vegetation are less well understood (Ea-mus and Jarvis 1989). Although plant photosynthetic produc-tivity increases in response to short-term exposure to elevated CO2 (e.g., Kimball 1983, Cure and Acock 1986, Stitt 1991), other environmental factors also limit plant productivity, and
may moderate the response of vegetation to elevated CO2 in the longer term (Gunderson and Wullschleger 1994, Sage 1994). It has been suggested that soil fertility, in particular, may constrain any CO2-induced increase in productivity (Kramer 1981, Bazzaz and Fajer 1992). Because nutrient availability is often limiting in terrestrial ecosystems (Tamm 1991), it could have a large impact on the ability of nonagricultural systems to respond to elevated CO2.
Conflicting results have been obtained from studies of the effect of soil nutrition on the response of vegetation to elevated CO2. Thus, CO2 stimulation of growth was reduced at low nutrient availability in wheat (Sionit et al. 1981), a C3 grass (Larigauderie et al. 1988), willow (Silvola and Alholm 1992), three out of four species of eucalypts (Wong et al. 1992), and wild cherry (Wilkins et al. 1994). However, in other experi-ments, the percentage stimulation of growth at elevated CO2 was similar in both high and low nutrient treatments (cotton, Wong 1979; soybean, Sionit 1983 and Cure et al. 1988; Noo-goora burr, Hocking and Meyer 1985; yellow poplar, Norby and O’Neill 1991; and sweet chestnut, El Kohen and Mousseau 1994).
Although it is not clear how low nutrient availability will affect plant responses to elevated CO2, it is evident that the interactive effects of CO2 and nutrition on plant growth are complex (Eamus and Jarvis 1989, Mousseau and Saugier 1992). Insight into such complex growth responses may be gained by expressing growth as a function of several inde-pendent factors, and investigating the responses of the individ-ual factors. One such method of analyzing plant growth responses is the light use efficiency approach (Monteith 1977) in which growth of vegetation over time (i.e., annual C uptake,
G, g C m−2 year−1) is modeled as:
G=εφabsYg(1 −R), (1)
where ε is the photosynthetic light use efficiency of the canopy (g C MJ−1), φabs is the photosynthetically active radiation absorbed by the canopy (MJ m−2 year−1), Yg is the conversion efficiency of photosynthate to biomass, and (1 −R) represents the fraction of photosynthate that is not respired (Jarvis and Leverenz 1983). Equation 1 separates the effects on growth of photosynthetic rates (that affect ε), leaf area (that affect φabs ),
Interactive effects of atmospheric carbon dioxide and leaf nitrogen
concentration on canopy light use efficiency: a modeling analysis
B. E. MEDLYN
School of Biological Science, University of New South Wales, Sydney, NSW 2052, Australia
Received March 2, 1995
and respiration. The light use efficiency approach has been used to investigate the effects of nitrogen fertilization and irrigation on plant growth (Gallagher and Biscoe 1978, Legg et al. 1979, Cannell et al. 1987, Garcia et al. 1988), but has rarely been used to interpret responses to elevated CO2 (but see Gifford and Morison 1993, Pinter et al. 1994). In this paper I used the light-use efficiency approach to evaluate the contribu-tion of changes in photosynthetic rate to the overall growth response of plants to elevated CO2. I estimated light use effi-ciency with MAESTRO (Wang and Jarvis 1990a), a detailed model of radiation absorption and photosynthesis integrated through the canopy and over time. The model MAESTRO (Wang and Jarvis 1990a) was used to predict the interactive effects of changes in atmospheric CO2 concentration and leaf nitrogen (N) content on ε, based on the observed responses of leaf photosynthesis.
The rate of leaf photosynthesis is assumed to be controlled by (1) the rate of regeneration of ribulose-1,5-bisphosphate (RuBP), (2) the activity of the carbon-fixing enzyme ribulose-1,5-bisphosphate carboxylase-oxygenase (Rubisco), and (3) the rate of regeneration of inorganic phosphate (Pi) (Farquhar and von Caemmerer 1982, Sharkey 1985). Each of these proc-esses has been shown to depend on leaf N content (Harley et al. 1992); however, because the rate of photosynthesis per unit leaf N (N use efficiency) varies among species (Evans 1989), I incorporated the published relationships between photosyn-thesis and leaf N content for three species into the model.
Down-regulation of photosynthesis affects light use effi-ciency. Therefore, I incorporated into the model two hypothe-ses to explain down-regulation of photosynthesis at elevated CO2: (1) a decrease in leaf N content (Ceulemans and Mous-seau 1994, Thomas et al. 1994), and (2) a decrease in Rubisco content (Besford et al. 1990, Sage 1994). Both hypotheses predict reduced Rubisco activity at elevated CO2, but they differ on whether the activities of other photosynthetic proc-esses are also reduced. The model was used to estimate light use efficiency at a range of leaf N contents, and two atmos-pheric CO2 concentrations (350 and 700 ppmv), for the follow-ing assumptions: (1) no photosynthetic down-regulation; (2) a 10% decrease in leaf N content at elevated CO2; (3) a 20% decrease in leaf N content at elevated CO2; (4) a 20% decrease in Rubisco activity at elevated CO2; and (5) a 40% decrease in Rubisco activity at elevated CO2. In cases (4) and (5), there were no indirect effects of elevated CO2 on any processes other than Rubisco activity.
Model description
Leaf photosynthesis
I used Farquhar and von Caemmerer’s (1982) model of leaf photosynthesis, as modified by Sharkey (1985), to determine the rate of photosynthesis (A, µmol m−2 s−1):
A =(1 − Γ∗ Ci
)min(Wc,Wj,Wp) − 0.6Rd, (2)
where Γ* is the CO2 compensation point in the absence of dark respiration (ppmv), Rd is the rate of dark respiration (assumed to be reduced by 40% in the light; µmol m−2 s−1), Ci is the intercellular CO2 concentration (ppmv), Wc is the rate of carboxylation when Rubisco activity is limiting, Wj is the rate of carboxylation when RuBP regeneration is limiting, and Wp is the rate of carboxylation when Pi regeneration is limiting.
The rate of carboxylation when Rubisco limits photosynthe-sis (Wc) is given by: s−1), Oi is the intercellular oxygen concentration (ppmv), and
kc and ko are the Michaelis-Menten constants (µmol mol−1) for Rubisco catalytic activity for CO2 and O2, respectively.
The rate of carboxylation when RuBP regeneration limits photosynthesis (Wj), which occurs when light is limiting, is given by: a saturating function of the absorbed quantum flux, Q (µmol m−2 s−1):
θJ2 − (αQ + Jmax)J + αQJmax = 0, (5)
where Jmax is the maximum rate of electron transport (µmol m−2 s−1), α is the quantum yield of electron transport (mol mol−1), and θ is a constant (= 0.9) that defines the curvature of the light response of J.
The rate of carboxylation when Pi regeneration limits pho-tosynthesis (Wp), which occurs when the rate of use of the end-products of photosynthesis is limiting, such that:
A = 3TPU− 0.6Rd, (6)
where TPU is the rate of phosphate release in triose phosphate utilization (µmol m−2 s−1) (Harley et al. 1992).
Equation 2 describes the rate of CO2 utilization by the chloroplast. The rate of supply of CO2 is determined by sto-matal conductance (gs, µmol m−2 s−1), which is predicted by
low values of A; this result is often reported (Wong et al. 1979, Wong et al. 1985, Spencer and Bowes 1986, Sage 1994, Thomas et al. 1994).
The temperature dependence of TPU is taken from Harley et al. (1992), and those of Jmax and Vcmax are taken from Kirschbaum (1986), with the modification that both quantities decline linearly to zero between 10 and 0 °C. Other tempera-ture dependences in the model are taken from McMurtrie and Wang (1993).
Relationship between leaf photosynthesis and leaf N content at current CO2 concentration
The three parameters determining the light-saturated rate of leaf photosynthesis, Asat , namely Jmax , Vcmax and TPU, are linearly related to leaf N content (Table 1). Because Rubisco content increases with increasing leaf N, Vcmax is related to leaf N content (Seemann et al. 1987). Similarly, N is needed for chlorophyll and various components of the electron transport chain (Evans 1989) and hence Jmax scales with leaf N. The link between TPU and leaf N is not clearly understood, but TPU may scale with N simply because Jmax and Vcmax do (see von Caemmerer and Farquhar 1984, Evans 1989, Stitt 1991). This assumption was used to derive relationships between TPU and leaf N content. Because photosynthesis was not limited by Pi regeneration in most of the studies used to compile Table 1, I derived the N-dependence of TPU for several species based on the relationship between Jmax and TPU developed by Wull-schleger (1993):
TPU = 0.06Jmax (r2 =0.844). (8)
Three of the sets of relationships given in Table 1, for Eucalyp-tus grandis,Nothofagus fusca and Pinus radiata, were used to parameterize MAESTRO.
Parameterization of canopy model
The leaf photosynthesis model was scaled up to the canopy using the model MAESTRO (Wang and Jarvis 1990a). MAES-TRO calculates canopy radiation absorption and consequent
photosynthesis on an hourly time step. Penetration of radiation is calculated using the method of Norman and Welles (1983). Diffuse and direct components of radiation are treated sepa-rately, with multiple scattering considered as described by Norman (1979). Photosynthesis is calculated as a function of absorbed quantum flux density. Leaf temperatures are assumed equal to air temperatures. Leaf N content is assumed to decline exponentially through the canopy. I assumed no effect of low water potentials on photosynthesis, in order to focus only on N limitations.
MAESTRO was parameterized for the Pinus radiata Biol-ogy of Forest Growth (BFG) site near Canberra, Australia (35°21′ S, 148°56′ E, elevation 625 m above sea level; see Benson et al. (1992) for a full site description). Stocking density, green crown height and crown radius were 700 stems ha−1, 8.5 m and 2.83 m, respectively. Tree crowns were as-sumed to be of equal dimensions and equally spaced. Projected leaf area index was 7. Leaf area distribution was assumed to follow beta distributions given by Wang et al. (1990), and the ‘‘clumping factor’’ (Wang and Jarvis 1990b) was 0.7. The leaf angle distribution was assumed to be spherical.
The distribution of leaf N through the canopy was calculated based on data from biomass harvests on all experimental plots at BFG (Snowdon and Benson 1992). In these harvests, tree crowns were divided into quarters vertically, and the N content and leaf area in each section were measured. These data were fitted to the model of Hirose and Werger (1987):
Ni=N0exp(−kLi/Lt), (9)
where Ni is the leaf N content above canopy height i (g m−2),
Li is leaf area index above canopy height i, Lt is the total leaf area index (= 7), N0 is a parameter determining total canopy N content (g m−2), and k is a constant (average value = 0.86) determining rate of decline of N content with increasing can-opy depth. Equation 9 was used to calculate leaf N content for five vertical levels in the canopy at varying N0.
MAESTRO requires hourly radiation and temperature data as input. Daily values of incident radiation and average daily
Table 1. Relationships between Jmax , Vcmax and TPU, and leaf N content used in modeling.
Species Jmax Vcmax TPU Reference
Alocasia macrorrhiza (L.) G. Don 70.7N − 10.35a 43.1N − 5.0 4.24N − 0.62c Sims and Pearcy 1989
Colocasia esculenta (L.) Schott 78.3N − 7.65a 55.5N − 14.5 4.7N − 0.46c Sims and Pearcy 1989
Eucalyptus grandis W. Hill ex Maiden. 58Na 31.0N + 16.7 3.48Nc Leuning et al. 1991
Gossypium hirsutum L. 70.6N − 3.3b 33.8N − 5.4b 4.15N + 0.51b Harley et al. 1992
Lepechinia calycina Benth. Epl. 82.3N + 12.3a 35.8N + 12.4 4.94N + 0.74c Field 1983
Nothofagus fusca (Hook. f.) Ørst. 32.9N + 6.6a 14N + 2.3 1.97N + 0.39c D.Y. Hollinger, pers. comm.
Pinus radiata D. Don 50.3N − 44.9 30.2N − 28.3 3.02N − 2.7c Kirschbaum et al. 1994
Quercus lobata Nee 63.2N + 34.22a 22.8N +6.8 3.79N − 2.05c Hollinger 1984
a J
max was multiplied by either 4 or 4/4.5 to standardize units of expression. b
Values were referenced to 25 °C based on temperature dependences given by Harley et al. (1992). c Calculated from J
temperatures recorded at the BFG site were obtained for the period July 1, 1985 to June 30, 1986. Daily mean temperatures over this period averaged 19 °C. Hourly radiation was calcu-lated from daily values (Gates 1980), and temperatures were assumed to vary sinusoidally during the day.
Results
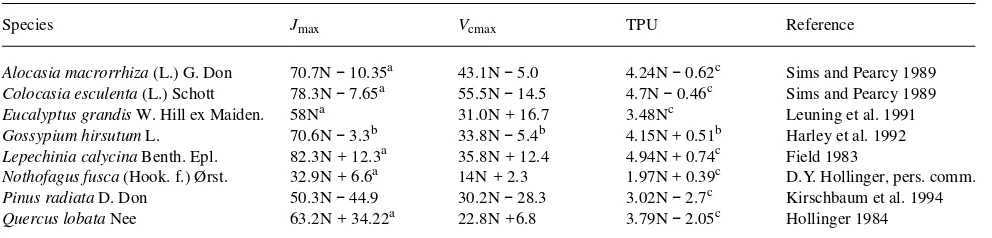
Figure 1 illustrates the increase in annual light use efficiency predicted for a doubling in CO2, from 350 to 700 ppmv, for the three species and five scenarios regarding down-regulation of photosynthesis. The increase in light use efficiency represents the increase in photosynthetic production that would be ex-pected from the effects of elevated CO2 on leaf photosynthetic rates alone.
On the assumption that there is no down-regulation of pho-tosynthesis at elevated CO2, there is little effect of leaf N content on the response of ε to elevated CO2, but there are considerable differences in response among species (Figure 1). The CO2-induced increase in ε is predicted to be about 20% for
E. grandis,25% for P. radiata, and 35% for N. fusca. Inspection of the leaf photosynthesis model (especially Equations 3--5) shows that the response of leaf photosynthesis to elevated CO2 does not change with changing leaf N content provided that the process that is limiting photosynthesis does not change. If, as Equation 7 implies, Ci /Ca does not change with leaf N content, and respiration rate is small compared to photosynthetic rate, then the ratio of leaf photosynthesis at 700 ppmv CO2 to that at 350 ppmv CO2 (A700 /A350) is independent of leaf N content; however, the value of this ratio depends on which process is limiting photosynthesis. Figure 2 shows the response, at 25° C, of leaf photosynthesis to a doubling of CO2 when photosynthesis is limited by Rubisco activity, RuBP regeneration or Pi regeneration. (Note that the CO2 responses of Rubisco-limited photosynthesis, Ac, and RuBP-regenera-tion-limited photosynthesis, Aj, both increase with increasing temperature, but that at any given temperature, the CO2 re-sponse of Ac is greater than that of Aj.) The response of A to elevated CO2 is highest when Rubisco activity is limiting photosynthesis (Ac), and is intermediate when RuBP regenera-tion is limiting (Aj), and there is no response if the rate of Pi regeneration is limiting (Ap) (cf. Stitt 1991). If control of photosynthesis shifts from one process to another at elevated CO2, then the CO2 response lies between the CO2 responses for the two processes. The response of ε to a doubling of Ca should therefore depend on the proportions of photosynthesis that are Figure 1. Ratio of ε at 700 ppmv CO2 (ε700) to ε at 350 ppmv CO2
(ε350) versus average leaf N content. Values of ε were calculated with the model MAESTRO. Relationships between the leaf photosynthetic parameters Jmax , Vcmax and TPU, and leaf N content from three different species were used: (a) P. radiata; (b) N. fusca; and (c) E. grandis. The range of average leaf N content for each species is the range of leaf N content reported in the study listed in Table 1. Five assumptions about down-regulation of photosynthesis at elevated CO2 were made: (1) no down-regulation = uppermost solid line; (2) a 10% decrease in leaf N content = middle solid line; (3) a 20% decrease in leaf N content = lowest solid line; (4) a 20% decrease in leaf Rubisco activity = upper broken line; and (5) a 40% decrease in leaf Rubisco activity = lower broken line. Dotted line indicates the value of ε700 /ε350 at which there is no response of ε to an increase in CO2.
controlled by each limitation.
The MAESTRO model was used to calculate the propor-tions of annual canopy photosynthesis that are controlled by each limitation, for each species at CO2 concentrations of 350 and 700 ppmv and for low and high average canopy N content (Figure 3). Canopy N content does not greatly affect the proportions of photosynthesis controlled by each limitation, but there are species-specific differences. The proportion of photosynthesis that is Rubisco-limited is higher for N. fusca
than for the other two species. Because Rubisco-limited pho-tosynthesis is most responsive to CO2, the CO2-induced in-crease in ε is higher for N. fusca than for the other species (Figure 1).
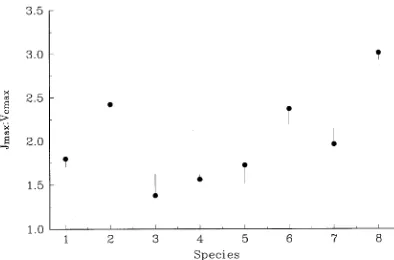
The proportion of photosynthesis controlled by each of the limitations is determined largely by the ratio of the maximum rates of RuBP-regeneration and Rubisco activity (Jmax /Vcmax ). (The ratio of Jmax /TPU is assumed to be constant (Equation 8).) Rubisco activity is more often the limiting factor when Jmax /Vcmax is high than when this ratio is low. The Jmax /Vcmax ratio is higher for N. fusca than for P. radiata or E. grandis (Figure 4), which explains the high proportion of photosynthesis that is Rubisco-limited for N. fusca. Thus, the response of ε to a doubling in CO2, in the absence of down-regulation of photo-synthesis, is largely determined by the relative rates of RuBP regeneration (Jmax ) and carboxylation (Vcmax ).
Next, consider the increase in ε predicted when photosyn-thesis is assumed to be down-regulated in response to elevated CO2 as a result of a decrease in leaf N content. MAESTRO was run with leaf N content decreased by 10 and 20%. Figure 1 shows that the effect of a decrease in leaf N content is much greater for P. radiata than for N. fusca and E. grandis. This is because of differences in N use efficiency among the species. The effect of decreasing leaf N content on the response of ε to elevated CO2 depends on the steepness of the relationship between ε and leaf N content (Figure 5). Because this relation-ship is steepest for P. radiata, a decrease in leaf N contenthas a greater effect on ε for P. radiata than for the other two species.
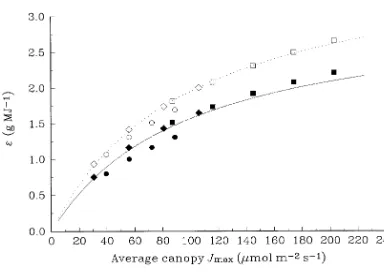
Differences in the response of ε to leaf N content among the three species are explained in Figure 6, which shows that ε is a saturating function of Jmax . Saturation occurs because in-creasing Jmax increases the rate of photosynthesis in leaves that are below light saturation, and at high values of Jmax , only a small proportion of the canopy is below light saturation. Spe-cies with a high value of Jmax per unit N, such as E. grandis, tend to operate on the saturated part of the ε--Jmax curve, and so a decrease in Jmax , as a result of a decrease in leaf N content,
Figure 3. The proportions of annual canopy photosynthesis that are limited by each of the three potential limitations, at the lowest and highest average leaf N content for each species, and at current (350 ppmv) and elevated (700 ppmv) Ca: (a) P. radiata; (b) N. fusca; and (c)
E. grandis. Dotted lines indicate how the proportions of annual canopy photosynthesis controlled by each limitation change when the atmos-pheric CO2 concentration is doubled from 350 to 700 ppmv.
Figure 4. Ratio of Jmax /Vcmax for each species. The ratio was calcu-lated for the range of published leaf N contents; the resulting range in
Jmax /Vcmax is indicated by the vertical lines. Circles show the Jmax /Vcmax at the lowest leaf N content considered. Species are: 1 = P.
has little effect on ε. On the other hand, for species with a low
Jmax per unit N, such as P. radiata, ε responds approximately linearly to decreasing Jmax , and thus is markedly affected by decreases in leaf N content. This explanation does not apply to
N. fusca because the relationship between ε and Jmax for
N. fusca is different from that for the other species (Figure 6). For N. fusca, the Jmax /Vcmax ratio is high (Figure 4), indicating that Rubisco activity more often limits annual canopy photo-synthesis in this species than in P. radiata and E. grandis; consequently, the value of ε is reduced for a given Jmax .
In Figure 1, the response of ε to elevated CO2, assuming a 10% decrease in leaf N content, lies about halfway between the response assuming no change in leaf N and the response assuming a 20% decreases in leaf N content, suggesting that the stimulation of ε at elevated CO2 decreases linearly as leaf N content declines. The same cannot be said of the decreases in leaf Rubisco activity. For P. radiata and E. grandis, a 20% decrease in leaf Rubisco activity has little effect on the re-sponse of ε to elevated CO2, whereas a 40% decrease in Rubisco activity has a large effect. At elevated CO2, Rubisco activity may decrease without having an impact on leaf
photo-synthesis or ε, because the efficiency of the enzyme is in-creased. The extent to which Rubisco activity can be decreased at elevated CO2 without affecting ε depends on how often Rubisco activity limits photosynthesis at current ambient CO2; this is indicated by the ratio of Jmax /Vcmax (Figure 4). For
N. fusca, which was strongly limited by Rubisco activity, a reduction in Rubisco activity decreases the response of ε to elevated CO2 considerably more than for P. radiata or E. gran-dis.
Discussion
The effect on growth of changes in photosynthetic rates in response to elevated CO2 depends on the relationship between leaf photosynthesis and leaf N content. Assuming that there is no down-regulation of photosynthesis at elevated CO2, growth responses due to increased photosynthetic rates range from 20% in E. grandis and P. radiata to 35% in N. fusca. A 10% decrease in leaf N content reduces the CO2-induced stimula-tion of ε to 15% in E. grandis and leads to a decrease of ε in
P. radiata. A 40% reduction in Rubisco activity reduces the CO2-induced increase in ε to 15% in E. grandis and to zero in
N. fusca.
The responses to elevated CO2 are strongly dependent on (1) the N use efficiency of photosynthesis, and (2) the ratio of Jmax /Vcmax There is a general understanding of how nitrogen use efficiency varies among species (Lambers and Poorter 1992), but there is a need to develop explicit relationships, such as those given in Table 1, for different species. It would also be useful to know how these relationships vary over time and through the canopy.
It is not clear why the ratio of Jmax /Vcmax differs among species (Figure 4). The mean ± standard deviation of Jmax /Vcmax in a survey of 109 species was 2.27 ± 0.55 (Wullschleger 1993). The Jmax /Vcmax ratio was lowest in conifers and highest in monocotyledonous crop species, vegetables and schlero-phyllous shrubs; however, consistent differences among spe-cies have yet to be established.
A clearer understanding of the relationship between leaf photosynthesis and N may help to elucidate the mechanism(s) underlying down-regulation. If down-regulation is caused by a decrease in leaf N content alone, the relationships between
Jmax , Vcmax and TPU, and leaf N will not change; however, if acclimation of photosynthesis to elevated CO2 involves a shift of resources away from Rubisco, then these relationships will change. Harley et al. (1992) found that leaf N content of cotton did not decrease significantly at elevated CO2, but the relation-ship between Vcmax and leaf N content was decreased at ele-vated CO2, indicating some down-regulation of Rubisco activity. In loblolly pine, however, down-regulation of photo-synthesis at elevated CO2 was completely explained by a decrease in leaf N content (Thomas et al. 1994). Both hypothe-ses are thus supported by the data. Because both hypothehypothe-ses predict that Rubisco activity is decreased at elevated CO2, studies that only report changes in Rubisco activity at elevated CO2, without reference to leaf N content, provide little infor-mation about the process that is driving down-regulation. Figure 6. Response of canopy light use efficiency to average canopy
Jmax for P. radiata, N. fusca, and E. grandis. Symbols as in Figure 5. Lines indicate rectangular hyperbolae fitted to values of canopy light use efficiency predicted by MAESTRO for all eight species listed in Table 1. Solid line, CO2 = 350 ppmv; dashed line, CO2 = 700 ppmv. Figure 5. Response of canopy light-use efficiency to average canopy leaf N content for P. radiata (e, r); N. fusca (s, d); and E. grandis
(h, j), at CO2 = 350 ppmv (filled symbols) and at CO2 = 700 ppmv
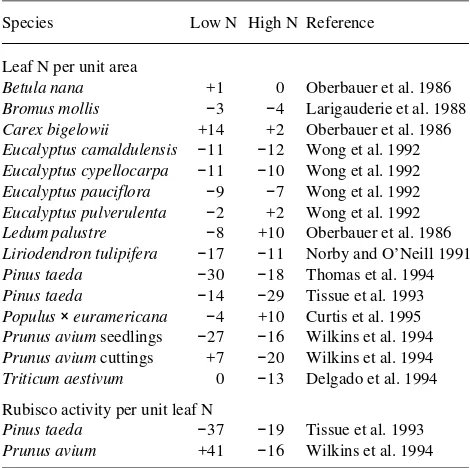
I conclude that leaf N content often does not markedly affect the response of ε to elevated CO2. Only under the assumption of decreased leaf N content for P. radiata was there an interac-tive effect of leaf N and CO2, indicating that any interacinterac-tive effects of N availability and CO2 on growth are likely to result from either (1) differences in down-regulation of photosynthe-sis at low and high N availability, or (2) interactive effects of CO2 and N availability on the other components of Equation 1, such as leaf area expansion and respiration. It has been sug-gested that down-regulation of photosynthesis is stronger when nitrogen availability is limiting (Sage 1994). If so, and if down-regulation is due to one of the two hypotheses consid-ered above, then either leaf N content or Rubisco activity should decrease, in response to elevated CO2, more strongly when N availability is limiting. The data summarized in Ta-ble 2 indicate that there was no consistent pattern of responses of leaf N content or Rubisco activity at high and low N, indicating that down-regulation was not necessarily stronger at low N availability.
Other components of Equation 1 are also strongly affected both by N and CO2 availability. Respiration increases with increasing tissue N concentration (Ryan 1991) and commonly decreases at elevated CO2 (Bunce 1994). Absorbed photosyn-thetically active radiation depends on canopy leaf area, which generally increases with N availability (Brix 1983, Cromer et al. 1993) and often increases with increasing CO2 (Ceulemans and Mousseau 1994). The response of leaf area to elevated CO2 might be expected to be greater at high fertility, because more nutrients are available to support canopy expansion. This was found by El Kohen and Mousseau (1994); leaf area in their unfertilized Castanea sativa plants did not change between CO2 treatments, but it increased 24% in the fertilized plants.
However, Norby and O’Neill (1991) found that leaf area de-creased slightly in both low-nutrient and high-nutrient treat-ments of Liriodendron tulipifera, and Wong (1979) found leaf area increased equally (~50%) in cotton plants at all nutrient levels.
In conclusion, I investigated how observed changes in leaf photosynthetic rates at elevated CO2 impact on total plant growth. The model used to scale up from leaf photosynthesis to canopy light use efficiency, MAESTRO, is based on the radiation interception characteristics of a forest canopy. The results are therefore most applicable to tree species. However, comparison with the CO2 response of light use efficiency reported in a FACE (free-air CO2 exchange) experiment with cotton grown at 370 ppmv (ambient) and 550 ppmv (elevated) CO2 indicates that crop species are likely to respond in a similar way (Pinter et al. 1994, Idso et al. 1994). Photosynthe-sis in cotton does not appear to be down-regulated at elevated CO2 (Idso et al. 1994). Based on the scenario used for the cotton study, MAESTRO predicts an increase in light use efficiency of 20% (data not shown), whereas the CO2 response of light use efficiency in the cotton experiment was 25%. The difference may be partly explained by the high temperatures experienced by the cotton crop (daily mean of 28.7 °C, com-pared to the daily mean of 19 °C used in the MAESTRO simulations). Because photosynthetic rates respond more strongly to elevated CO2 at high temperatures than at low temperatures (Long 1991), a higher CO2-induced response of ε would be expected at high temperatures.
Acknowledgments
This work was supported by the NGAC Dedicated Greenhouse Re-search Grants Scheme. I thank Drs. Ross McMurtrie, Roddy Dewar and Peter Harley for helpful comments on the manuscript.
References
Bazzaz, F.A. and E.D. Fajer. 1992. Plant life in a CO2-rich world. Sci. Am. 266:20--24.
Benson, M.L., J.J. Landsberg and C.J. Borough. 1992. The Biology of Forest Growth experiment: an introduction. For. Ecol. Manage. 52:1--16.
Besford, R.T., L.J. Ludwig and A.C. Withers. 1990. The greenhouse effect: acclimation of tomato plants growing in high CO2, photo-synthesis and ribulose-1,5-bisphosphate carboxylase protein. J. Exp. Bot. 41:925--931.
Brix, H. 1983. Effects of thinning and nitrogen fertilization on growth of Douglas-fir: relative contribution of foliage quantity and effi-ciency. Can. J. For. Res. 13:167--175.
Bunce, J.A. 1994. Responses of respiration to increasing atmospheric carbon dioxide concentrations. Physiol. Plant. 90:427--430. Cannell, M.G.R., R. Milne, L.J. Sheppard and M.H. Unsworth. 1987.
Radiation interception and productivity of willow. J. Appl. Ecol. 24:261--278.
Ceulemans, R. and M. Mousseau. 1994. Effects of elevated atmos-pheric CO2 on woody plants. New Phytol. 127:425--446. Cromer, R.N., D.M. Cameron, S.J. Rance, P.A. Ryan and M. Brown.
1993. Response to nutrients in Eucalyptus grandis. 1. Biomass accumulation. For. Ecol. Manage. 62:211--230.
Table 2. Percentage changes in leaf N per unit area and Rubisco activity per unit leaf N in response to growth at elevated CO2, at different nutrient supply rates.
Species Low N High N Reference
Leaf N per unit area
Betula nana +1 0 Oberbauer et al. 1986
Bromus mollis −3 −4 Larigauderie et al. 1988
Carex bigelowii +14 +2 Oberbauer et al. 1986
Eucalyptus camaldulensis −11 −12 Wong et al. 1992
Eucalyptus cypellocarpa −11 −10 Wong et al. 1992
Eucalyptus pauciflora −9 −7 Wong et al. 1992
Eucalyptus pulverulenta −2 +2 Wong et al. 1992
Ledum palustre −8 +10 Oberbauer et al. 1986
Liriodendron tulipifera −17 −11 Norby and O’Neill 1991
Pinus taeda −30 −18 Thomas et al. 1994
Pinus taeda −14 −29 Tissue et al. 1993
Populus× euramericana −4 +10 Curtis et al. 1995
Prunus avium seedlings −27 −16 Wilkins et al. 1994
Prunus avium cuttings +7 −20 Wilkins et al. 1994
Triticum aestivum 0 −13 Delgado et al. 1994
Rubisco activity per unit leaf N
Pinus taeda −37 −19 Tissue et al. 1993
Cure, J.D. and B. Acock. 1986. Crop responses to carbon dioxide doubling: a literature survey. Agric. For. Meteorol. 38:127--145. Cure, J.D., D.W. Israel and T.W. Rufty, Jr. 1988. Nitrogen stress effects
on growth and seed yield of non-nodulated soybean exposed to elevated carbon dioxide. Crop Sci. 28:671--677.
Curtis, P.S., C.S. Vogel, K.S. Pregitzer, D.R. Zak and J.A. Teeri. 1995. Interacting effects of soil fertility and atmospheric CO2 on leaf area growth and carbon gain physiology in Populus ×euramericana
(Dode) Guinier. New Phytol. 129:253--263.
Delgado, E., R.A.C. Mitchell, M.A.J. Parry, S.P. Driscoll, V.J. Mitchell and D.W. Lawlor. 1994. Interacting effects of CO2 concentration, temperature and nitrogen supply on the photosynthesis and compo-sition of winter wheat leaves. Plant Cell Environ. 17:1205--1213. Eamus, D. and P.G. Jarvis. 1989. The direct effects of increase in the
global atmospheric CO2 concentration on natural and commercial temperate trees and forests. Adv. Ecol. Res. 19:1--55.
El Kohen, A. and M. Mousseau. 1994. Interactive effects of elevated CO2 and mineral nutrition on growth and CO2 exchange of sweet chestnut seedlings (Castanea sativa). Tree Physiol. 14:679--690. Evans, J.R. 1989. Photosynthesis and nitrogen relationships in leaves
of C3 plants. Oecologia 78:9--19.
Farquhar, G.D. and S. von Caemmerer. 1982. Modelling of photosyn-thetic response to environmental conditions. In Encyclopaedia of Plant Physiology, New Series, Vol. 12B, Physiological Plant Ecol-ogy II. Eds. O.L. Lange, P.S. Nobel, C.B. Osmond and H. Zeiger. Springer-Verlag, Berlin, pp 549--587.
Field, C. 1983. Allocating leaf nitrogen for the maximization of carbon gain: leaf age as a control on the allocation program. Oecologia 56:341--347.
Gallagher, J.N. and P.V. Biscoe. 1978. Radiation absorption, growth and yield of cereals. J. Agric. Sci. 91:47--60.
Garcia, R., E.T. Kanemasu, B.L. Blad, A. Bauer, J.L. Hatfield, D.J. Major, R.J. Reginato and K.G. Hubbard. 1988. Interception and use efficiency of light in winter wheat under different nitrogen regimes. Agric. For. Meteorol. 44:175--186.
Gates, D.M. 1980. Biophysical ecology. Springer-Verlag, New York, 611 p.
Gifford, R.M. and J.I.L. Morison. 1993. Crop responses to the global increase in atmospheric CO2 concentration. In Proc. Int. Crop Sci. Congress I. Eds. D.R. Buxton, R. Shibles, R.A. Forsberg, B.L. Blad, K.H. Asay, G.M. Paulsen and R.F. Wilson. Crop Science Soc. of America, Inc., Madison, Wisconsin, USA, pp 325--331. Gunderson, C.A. and S.D. Wullschleger. 1994. Photosynthetic
accli-mation in trees to rising atmospheric CO2: a broader perspective. Photosynth. Res. 39:369--388.
Harley, P.C., R.B. Thomas, J.F. Reynolds and B.R. Strain. 1992. Modelling photosynthesis of cotton grown in elevated CO2. Plant Cell Environ. 15:271--282.
Hirose, T. and M.J.A. Werger. 1987. Maximizing daily canopy photo-synthesis with respoect to the leaf nitrogen allocation pattern in the canopy. Oecologia 72:520--526.
Hocking, P.J. and C.P. Meyer. 1985. Responses of Noogoora Burr (Xanthium occidentale Bertol.) to nitrogen supply and carbon diox-ide enrichment. Ann. Bot. 55:835--844.
Hollinger, D.Y. 1984. Photosynthesis, water relations, and herbivory in co-occurring deciduous and evergreen California oaks. Ph.D. Thesis. Stanford Univ., Stanford, CA, 173 p.
Idso, S.B., B.A. Kimball, G.W. Wall, R.L. Garcia, R. LaMorte, P.J. Pinter, Jr., J.R. Mauney, G.R. Hendrey, K. Lewin and J. Nagy. 1994. Effects of free-air CO2 enrichment on the light response curve of net photosynthesis in cotton leaves. Agric. For. Meteorol. 70:183--188.
Jarvis, P.G. and J.W. Leverenz. 1983. Productivity of temperate, de-ciduous, and evergreen forests. In Encyclopaedia of Plant Physiol-ogy, New Series, Vol. 12D, Physiological Plant Ecology IV. Eds. O.L. Lange, P.S. Nobel, C.B. Osmond and H. Zeiger. Springer-Ver-lag, Berlin, pp 233--280.
Kimball, B.A. 1983. Carbon dioxide and agricultural yield: an assem-blage and analysis of 430 prior observations. Agron. J. 75:779--788. Kirschbaum, M.U.F. 1986. The effects of light, temperature and water stress on photosynthesis in Eucalyptus pauciflora. Ph.D. Thesis. Australian National Univ., Canberra, ACT, 185 p.
Kirschbaum, M.U.F., D.A. King, H.N. Comins, R.E. McMurtrie, B.E. Medlyn, S. Pongracic, D. Murty, H. Keith, R.J. Raison, P.K. Khanna and D.W. Sheriff. 1994. Modelling forest response to increasing CO2 concentration under nutrient-limited conditions. Plant Cell Environ. 17:1081--1099.
Kramer, P.J. 1981. Carbon dioxide concentration, photosynthesis, and dry matter production. BioScience 31:29--33.
Lambers, H. and H. Poorter. 1992. Inherent variation in growth rate between higher plants: a search for physiological causes and eco-logical consequences. Adv. Ecol. Res. 23:187--261.
Larigauderie, A., D.W. Hilbert and W.C. Oechel. 1988. Effect of CO2 enrichment and nitrogen availability on resource acquistion and resource allocation in a grass, Bromus mollis. Oecologia 77:544--549.
Legg, B.J., W. Day, D.W. Lawlor and K.J. Parkinson. 1979. The effects of drought on barley growth: models and measurements showing the relative importance of leaf area and photosynthetic rate. J. Agric. Sci. 92:703--716.
Leuning, R. 1995. A critical appraisal of a combined stomatal-photo-synthesis model for C3 plants. Plant Cell Environ.18:339--355. Leuning, R., R.N. Cromer and S. Rance. 1991. Spatial distributions of
foliar nitrogen and phosphorus in crowns of Eucalyptus grandis. Oecologia 88:504--510.
Long, S.P. 1991. Modification of the response of photosynthetic pro-ductivity to rising temperature by atmospheric CO2 concentrations: has its importance been underestimated? Plant Cell Environ. 14:729--739.
McMurtrie, R.E. and Y.-P. Wang. 1993. Mathematical models of the photosynthetic response of tree stands to rising CO2 concentrations and temperatures. Plant Cell Environ. 16:1--13.
Monteith, J.L. 1977. Climate and the efficiency of crop production in Britain. Philos. Trans. R. Soc. Lond. Ser. B Biol. 281:277--294. Mousseau, M. and B. Saugier. 1992. The direct effect of increased CO2
on gas exchange and growth of forest tree species. J. Exp. Bot. 43:1121--1130.
Norby, R.J. and E.G. O’Neill. 1991. Leaf area compensation and nutrient interactions in CO2-enriched seedlings of yellow-poplar (Liriodendron tulipifera L.) New Phytol. 177:515--528.
Norman, J.M. 1979. Modelling the complete crop canopy. In Modifi-cation of the Aerial Environment of Crops. Eds. B.J. Barfield and J.F. Gerber. Monogr. No. 2, Am. Soc. Agric. Eng. ASAE, St. Joseph, MI, pp 249--277.
Norman, J.M. and J.M. Welles. 1983. Radiative transfer in an array of canopies. Agron. J. 75:481--488.
Oberbauer, S.F., N. Sionit, S.J. Hastings and W.C. Oechel. 1986. Effects of CO2 enrichment on growth, photosynthesis, and nutrient concentration of Alaskan tundra plant species. Can. J. Bot. 64:2993--2998.
Ryan, M.G. 1991. Effects of climate change on plant respiration. Ecol. Appl. 1:157--167.
Sage, R.F. 1994. Acclimation of photosynthesis to increasing atmos-pheric CO2: the gas exchange perspective. Photosynth. Res. 39:351--368.
Seemann, J.R., T.D. Sharkey, J.L Wang and C.B. Osmond. 1987. Environmental effects on photosynthesis, nitrogen-use efficiency, and metabolite pools in leaves of sun and shade plants. Plant Physiol. 84:796--802.
Sharkey, T.D. 1985. Photosynthesis in intact leaves of C3 plants: physics, physiology and rate limitations. Bot. Rev. 51:53--105. Silvola, J. and U. Alholm. 1992. Photosynthesis in willows (Salix×
dasyclados) grown at different CO2 concentrations and fertilization levels. Oecologia 91:208--213.
Sims, D.A. and R.W. Pearcy. 1989. Photosynthetic characteristics of a tropical forest understory herb, Alocasia macrorrhiza, and a related crop species, Colocasia esculenta, grown in contrasting light envi-ronments. Oecologia 79:53--59.
Sionit, N. 1983. Response of soybean to two levels of mineral nutrition in CO2-enriched atmosphere. Crop Sci. 23:329--333.
Sionit, N., D.A. Mortensen, B.R. Strain and H. Hellmers. 1981. Growth response of wheat to CO2 enrichment and different levels of mineral nutrition. Agron. J. 73:1023--1027.
Snowdon, P. and M.L. Benson. 1992. Effects of combinations of irrigation and fertilisation on the growth and above-ground biomass production of Pinus radiata. For. Ecol. Manage. 52:87--116. Spencer, W. and G. Bowes. 1986. Photosynthesis and growth of water
hyacinth under CO2 enrichment. Plant Physiol. 82:522--528. Stitt, M. 1991. Rising CO2 levels and their potential significance for
carbon flow in photosynthetic cells. Plant Cell Environ. 14:741--762.
Tamm, C.O. 1991. Nitrogen in terrestrial ecosystems. Ecological Studies 81, Springer-Verlag, Berlin, 115 p.
Thomas, R.B., J.D. Lewis and B.R. Strain. 1994. Effects of leaf nutrient status on photosynthetic capacity in loblolly pine (Pinus taeda L.) seedlings grown in elevated atmospheric CO2. Tree Physiol. 14:847--960.
Tissue, D.T., R.B. Thomas and B.R. Strain. 1993. Long-term effects of elevated CO2 and nutrients on photosynthesis and rubisco in loblolly pine seedlings. Plant Cell Environ. 16:859--865.
von Caemmerer, S. and G.D. Farquhar. 1984. Effects of partial defo-liation, changes of irradiances during growth, short-term water stress and growth at enhanced CO2 on the photosynthetic capacity of leaves of Phaseolus vulgaris L. Planta 160:320--329.
Wang, Y.-P. and P.G. Jarvis. 1990a. Description and validation of an array model----MAESTRO. Agric. For. Meteorol. 51:257--180. Wang, Y.-P. and P.G. Jarvis. 1990b. Influence of crown structural
properties on PAR absorption, photosynthesis, and transpiration in Sitka spruce: application of a model (MAESTRO). Tree Physiol. 7:297--316.
Wang, Y.-P., P.G. Jarvis and M.L. Benson. 1990. Two-dimensional needle-area density distribution within the crowns of Pinus radiata. For. Ecol. Manage. 32:217--237.
Watson, R., H. Rodhe, H. Oeschger and U. Siegenthaler. 1990. Green-house gases and aerosols. In Climate Change: the IPCC Scientific Assessment. Eds. J.T. Houghton, G.J. Jenkins and J.J. Ephraums. Cambridge University Press, Cambridge, pp 1--40.
Wilkins, D., J.-J. Van Oosten and R.T. Besford. 1994. Effects of elevated CO2 on growth and chloroplast proteins in Prunus avium. Tree Physiol. 14:769--779.
Wong, S.C. 1979. Elevated atmospheric partial pressure of CO2 and plant growth. I. Interactions of ntirogen nutrition and photosyn-thetic capacity in C3 and C4 plants. Oecologia 44:68--74. Wong, S.C., I.R. Cowan and G.D. Farquhar. 1979. Stomatal
conduc-tance correlates with photosynthetic capacity. Nature 282:424--426. Wong, S.C., I.R. Cowan and G.D. Farquhar. 1985. Leaf conductance in relation to rate of CO2 assimilation. I. Influence of nitrogen nutrition, phosphorus nutrition, photon flux density and ambient partial pressure of CO2 during ontogeny. Plant Physiol. 78:821--825.
Wong, S.C., P.E. Kriedemann and G.D. Farquhar. 1992. CO2× nitro-gen interaction on seedling growth of four species of eucalypt. Aust. J. Bot. 40:457--472.
Wullschleger, S.D. 1993. Biochemical limitations to carbon assimila-tion in C3 plants----a retrospective analysis of the A/Ci curves from 109