Summary Net photosynthetic rates (A) of leaves in upper and lower crown layers (Aupper and Alower ), leaf area index (LAI),
mean tilt angle (MTA), several leaf characteristics, and volume growth were observed in fast- and slow-growing families of a 14-year-old full-sib and half-sib family progeny test of Betula pendula Roth. Each measure of net photosynthetic rate was calculated after correcting measured net photosynthesis for the effects of environmental variables. The differences in Aupper and
LAI among families were significant. The proportions of the total variance assigned to family for Aupper , Alower and LAI were
33.64, 28.93 and 54.99%, respectively. The mean Aupper and
LAI of the fast-growing families were significantly higher than those of the slow-growing families, whereas the mean Alower of
the fast-growing families was significantly lower than that of the slow-growing families. There were also significant differ-ences among families in leaf size, leaf shape, and the ratios leaf fresh weight/area and leaf dry weight/area. Between 27.55 and 54.55% of the total variance in these characteristics could be assigned to the family effect. Volume growth was positively correlated with Aupper and LAI, but it was most strongly
corre-lated with Aupper × LAI.
Keywords: leaf area index, leaf characteristics, mean tilt an-gle, modeling, volume growth.
Introduction
Genetic improvements in growth rate and stem quality of silver birch (Betula pendula Roth) have been achieved. Because large differences in volume growth are frequently observed among silver birch families (Raulo and Koski 1977), the ge-netic and physiological bases for fast growth are of great scientific interest. Wang and Tigerstedt (1993) found signifi-cant differences in phenological characteristics among full-sib (FS) families and correlations between growth rhythm and volume growth.
The importance of net photosynthetic rate and of some canopy characteristics for tree growth have been emphasized in many studies (Kramer and Kozlowski 1979, Rook 1985, Cannell 1989, Long and Smith 1990, Fownes and Harrington 1990). Experiments with several hardwood (Nelson and Ehlers 1984, Mebrahtu and Hanover 1991) and conifer species (Ledig
and Clark 1977) indicate that there are significant differences in net photosynthesis per unit leaf area among half- and full-sib families and clones. Photosynthetic rate and related parame-ters have been suggested as early selection criteria to improve the efficiency of tree breeding (Ledig and Botkin 1974, Lapido et al. 1984, Ceulemans et al. 1987). However, there have been few comparisons among families of forest tree species for canopy characteristics including leaf area index (LAI) and foliage orientation. Because direct measurements of canopy structure are tedious and labor intensive even on small cano-pies, and nearly impossible on large forest canocano-pies, we used the LAI-2000 plant canopy analyzer (Li-Cor Inc., Cary, NC), which provides accurate integrated estimates of canopy struc-tural parameters (Welles and Norman 1991), to study canopy characteristics of genetically defined silver birch families.
The objective of the study was to identify physiological factors that explain yield differences among genetically de-fined silver birch families. For this purpose, we estimated the variability in net photosynthetic rates, and several canopy and leaf characteristics among fast- and slow-growing families of B. pendula based on a genetic field trial.
Material and methods
Material
We studied material from a progeny test of silver birch estab-lished by the Forest Research Institute (experiment No. 816/1) on a clay soil close to Hämeenlinna (60°57′ N, 24°32′ E, altitude 85 m) in southern Finland. The site was planted with 2-year-old seedlings in May 1982. The trial included 55 full-sib (FS) families, 12 half-full-sib (HS) families and two standard seed mixtures from natural stands. All of the material origi-nated in southern Finland. A completely randomized block design was used for the progeny trial with 16 plants per plot and seven blocks. There were 69 plots per block, and the sizes of each plot and block were 8 × 8 and 4416 m2, respectively.
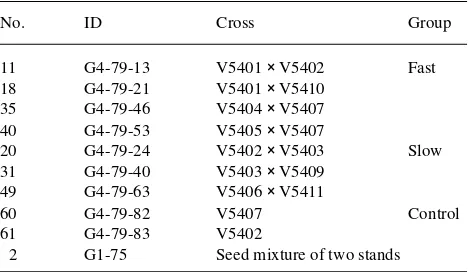
For this study, we selected three blocks containing three groups of families including (1) four fast-growing FS families, (2) three slow-growing FS families, and (3) a control group consisting of two HS families and one stand mixture (Table 1).
Photosynthesis and canopy characteristics in genetically defined
families of silver birch (
Betula pendula
)
TONGLI WANG,
1P. M. A. TIGERSTEDT
1and ANNELI VIHERÄ-AARNIO
21 Department of Plant Biology, Plant and Tree Breeding, University of Helsinki, Box 27, FIN-00014 Helsinki, Finland
2 Finnish Forest Research Institute, PL 18, FIN-01301 Vantaa, Finland
Received December 6, 1994
Measurement of A
Net photosynthetic rate (A) was measured with an LI-6200 portable photosynthesis system (Li-Cor Inc.) in late July 1993, and the measurements were repeated on one block in mid-July 1994. In each plot, four trees were mechanically sampled. The measurements were made on branches of the upper layer of the crown, where the leaves use direct sunlight, and on the lower layer of the crown, where the leaves mainly use reflected or diffuse light. For each of the two canopy layers, 3--4 leaves of similar age that had emerged in spring were measured. For the upper and lower crown layers, 533 and 392 measurements were made, respectively. The measurements were made only on the upper layer of the crown in 1994.
Because the trees were about 10 m high, branches (80--100 cm) were cut and then recut under water. To minimize water loss, the branches were kept away from strong direct light before measurement. The branches were exposed to direct light about 5 min before measurement to minimize transient photosynthetic responses to light (Chazdon 1988, Kursar and Coley 1993). The measurements were completed within 30 min of cutting.
In 1993, the measurements were made between 0800 and 1700 h at 100--2000 µmol m−2 s−1 photosynthetically active
radiation (PAR) for the upper layer of the crown and at 100--600 µmol m−2 s−1 PAR of indirect light for the lower layer of
the crown. Temperature varied within the range of 17--28 °C and relative humidity (RH) varied from 21--50%. In 1994, the measurements were made between 1000 and 1600 h at 1300--1750 µmol m−2 s−1 PAR, 29--37 °C, and 20--33% RH.
Measurement of canopy characteristics
Leaf area index (LAI) and mean tilt angle (MTA, 0° = horizon-tal, 90° = vertical) were measured with an LAI-2000 plant canopy analyzer (Li-Cor Inc.), equipped with a fisheye light sensor to measure diffuse radiation simultaneously in five distinct angular bands about the zenith point, and an optical filter to restrict transmitted radiation to below 490 nm to mini-mize the contribution of light that has been scattered by foli-age. The measurements were made on an overcast day. Because the plots were square, a 90° view cap was used to restrict the view scope of the sensor. For each plot, LAI and MTA were observed on the basis of one reading measured in
an open field away from the stand and four readings measured beneath the canopy in each of the four corners of the plot. A C2000 program was used to check and eliminate unreliable readings.
Measurement of leaf characteristics
The leaf characteristics measured were leaf size, leaf shape (width/length), and the ratios leaf fresh weight/area and leaf dry weight/area. For the measurements, 10 leaves were taken from the same branch that was used to measure Aupper . Leaf
area was measured with an LI-3000A portable area meter (Li-Cor Inc.). Leaf shape was measured manually. Leaf dry weight was obtained after the leaves were dried for 30 h at 80 °C.
Measurement of volume growth
Height and diameter at breast height (dbh) of the trees were measured in the spring of 1992 and again in the autumn of 1993. The total volume growth of each tree over 14 years was calculated on the basis of dbh and height by using the model for birch developed by Laasasenaho (1982).
Data analysis
The data were analyzed by REG, ANOVA and VARCOMP procedures in the SAS software package (SAS Institute Inc., Cary, NC). Plot means were used, and the effects of year and block were considered fixed in the ANOVA and VARCOMP.
Because the measurements were made under varying envi-ronmental conditions, theoretical values of net photosynthetic rate (tA) were modeled on the basis of measured A (mA) and environmental variables to estimate the A of each measurement under a given set of environmental conditions.
Models for calculating tA of the upper layer (tAupper ) and
lower layer (tAlower ) were built on the basis of a stepwise
regression analysis with environmental variables: PAR, tem-perature (Temp), time (Time) and relative humidity (RH), and their logarithmic transformations. Thus for upper and lower crown layers in 1993:
ln(tAupper ) = −2.7669 − 83.8788 (ln(PAR))−2 +
13.5104 (ln(PAR))−1 − 0.1482 Temp +
2.7903 ln(Temp) − 0.3774 Time, and
ln(tAlower ) = 9.8746 − 30.2515 (ln(PAR))−2 +
0.01261 RH − 8.4018 Time + 3.9576 ln(Time) − 0.02601 Temp.
For the upper crown layer in 1994:
tAupper = −37.8295 − 7.4149 Time2 + 227.7903 Temp−1
+ 2.8371 RH − 0.04134 RH2.
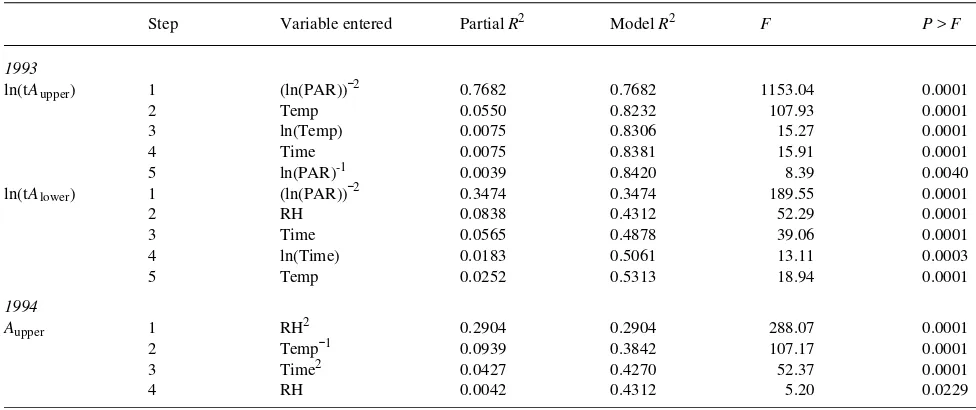
A summary of the stepwise statistical procedure is given in Table 2.
In 1993, each measurement of A was estimated on the basis of tA and mA according to the following formulae:
Table 1. Families selected for the measurements.
No. ID Cross Group
Aupper = exp(2.6373 ln(mAupper )/ln(tAupper )), and
Alower = exp(1.8592 ln(mAlower )/ln(tAlower )).
The above estimations incorporate environmental stand-ardization appropriate at both canopy levels. The constant 2.6373 in the upper formula is the value of ln(tAupper ) under
standard environmental conditions: PAR = 1000 µmol m−2 s−1,
Temp = 20 °C, and Time = 1200 h (RH excluded in this model). The constant 1.8592 in the lower formula is the value of ln(tAlower ) under standard environmental conditions: PAR =
250 µmol m−2 s−1, Temp = 20 °C, Time = 1200 h, and RH =
35%. For the upper crown layer in 1994:
Aupper = 15.871 mA/tA.
The constant 15.871 is the tA under standard environmental conditions PAR > 1300 µmol m−2 s−1, Temp = 25 °C, Time =
1200 h and RH = 27%.
Results
Environmental factors affecting A
The multiple correlations between dependent variables Aupper
and Alower and environmental variables PAR, Temp, Time and
RH (except RH for Aupper in 1993), and between Aupper and
Temp, RH and Time in 1994 were highly significant (P < 0.0001) (Table 2), demonstrating a reliable modeling of tA. However, the modeling of tAupper (R2 = 0.8420) was more
reliable than that of tAlower (R2 = 0.5313). The reason for the
lower coefficient of determination for tAupper (R2 = 0.4312) in
1994 than in 1993 was attributable to saturated PAR in the range of 1300--1750 µmol m−2 s−1. This saturation caused the
exclusion of PAR as an independent variable from the 1994 model, whereas in the 1993 model, PAR gave the highest
partial correlation coefficient.
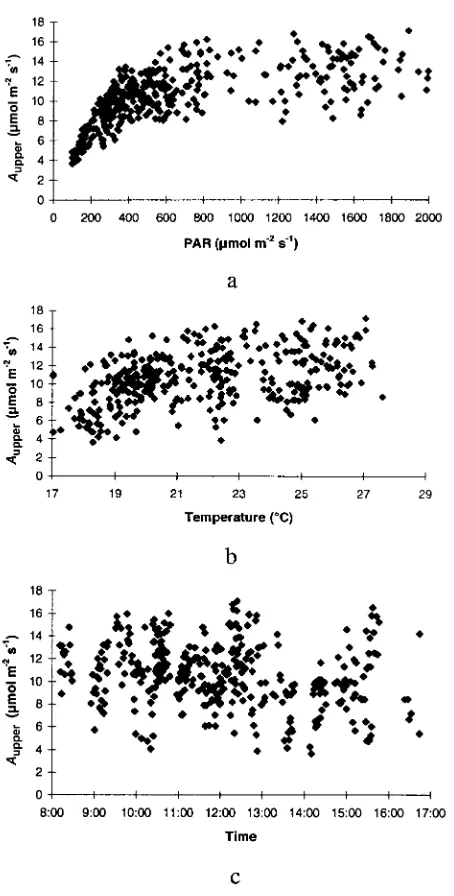
The correlations between Aupper and environmental variables
are plotted in Figure 1. Net photosynthetic rate of leaves in the upper crown layer increased with increasing PAR. The PAR saturation point was around 900 µmol m−2 s−1. Temperature
also had a positive effect on Aupper in the range of 17--28 °C,
and Aupper reached a peak at around 25 °C. Net photosynthetic
rate of leaves in the upper crown layer decreased with the measuring time from 0800 to 1700 h.
Variation in A among families
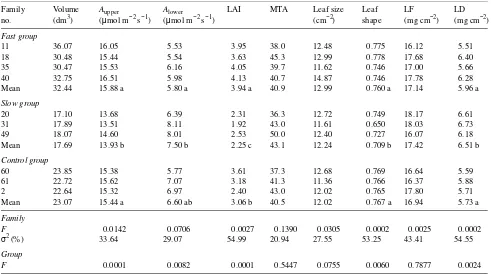
Family means of A and volume growth are given in Table 3. There was significant variation in Aupper among families, but
the variation in Alower among families was not significant.
According to the estimates of variance components, 33.64 and 29.07% of the total variance of Aupper and Alower , respectively,
could be allocated to family.
The differences in Aupper and Alower among the three family
groups were significant. The mean Aupper of the fast-growing
family group and the mean of the control group were signifi-cantly higher by 14.0 and 10.8%, respectively, than that of the slow-growing family group, whereas the mean Alower of the
fast-growing family group was significantly lower by 29.3% than that of the slow-growing family group.
Variations in canopy characteristics among families
Variation in LAI among families was significant. The mean LAI of each family varied between 1.92 and 4.13 (Table 3). The mean LAI of the fast-growing family group was signifi-cantly higher than that of the control group, which in turn was significantly higher than the mean of the slow-growing family group. The variation of MTA among families was not signifi-cant. The variance component estimate indicated that 54.99 and 20.94% of the total variance in LAI and MTA, respec-tively, could be allocated to family.
Table 2. Summary of stepwise procedure for estimating ln(tAupper ) and ln(tAlower ) in 1993, and Aupper in 1994. The variables used in the model were significant at P = 0.15.
Step Variable entered Partial R2 Model R2 F P > F
1993
ln(tAupper ) 1 (ln(PAR))−2 0.7682 0.7682 1153.04 0.0001
2 Temp 0.0550 0.8232 107.93 0.0001
3 ln(Temp) 0.0075 0.8306 15.27 0.0001
4 Time 0.0075 0.8381 15.91 0.0001
5 ln(PAR)-1 0.0039 0.8420 8.39 0.0040
ln(tAlower ) 1 (ln(PAR))−2 0.3474 0.3474 189.55 0.0001
2 RH 0.0838 0.4312 52.29 0.0001
3 Time 0.0565 0.4878 39.06 0.0001
4 ln(Time) 0.0183 0.5061 13.11 0.0003
5 Temp 0.0252 0.5313 18.94 0.0001
1994
Aupper 1 RH2 0.2904 0.2904 288.07 0.0001
2 Temp−1 0.0939 0.3842 107.17 0.0001
3 Time2 0.0427 0.4270 52.37 0.0001
Variation in leaf characteristics among families
There were significant differences in leaf size, leaf shape, and the ratios leaf fresh weight/area and leaf dry weight/area among families (Table 3). The proportion of total variance that could be assigned to family for these characteristics was be-tween 27.55 and 54.55%; however, significant differences among groups were found for leaf shape and leaf dry weight/ area ratio. The means of leaf shape of the fast-growing families and the controls were significantly higher than those of slow-growing families, whereas the means of the ratios of leaf dry weight/area of the fast-growing families and controls were significantly lower than those of the slow-growing families.
Correlations between A and leaf characteristics
Net photosynthetic rate of leaves in the upper crown layer was
positively correlated with leaf shape and negatively correlated with leaf dry weight/area ratio (Figure 2). However, Aupper was
not significantly correlated with leaf size or leaf fresh weight/area ratio.
Correlations between volume growth and A or LAI
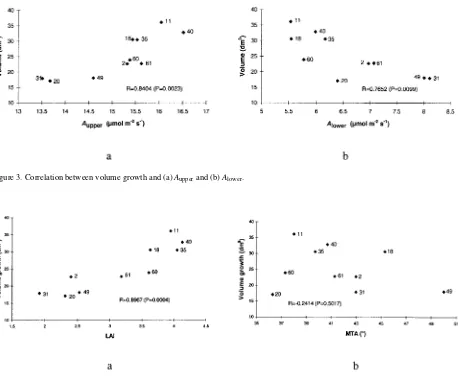
The correlation between Aupper and volume growth was
posi-tive and significant (R = 0.8404, P = 0.0023) at the family level. Families with high Aupper generally had high volume growth
(Figure 3a), e.g., Families 11, 35 and 40.
Net photosynthetic rate of leaves in the lower crown layer was negatively correlated with volume growth (R = 0.7652, P = 0.0099). Families with high Alower generally had a low
volume growth (Figure 3b), e.g., Families 31 and 49. The four fast-growing families had the four highest LAI values indicating that volume growth was positively correlated with LAI (R = 0.8967, P = 0.0004) (Figure 4). The correlation between volume growth and MTA was not significant indicat-ing that leaf tilt angle or leaf orientation have little or no influence on growth rate in silver birch.
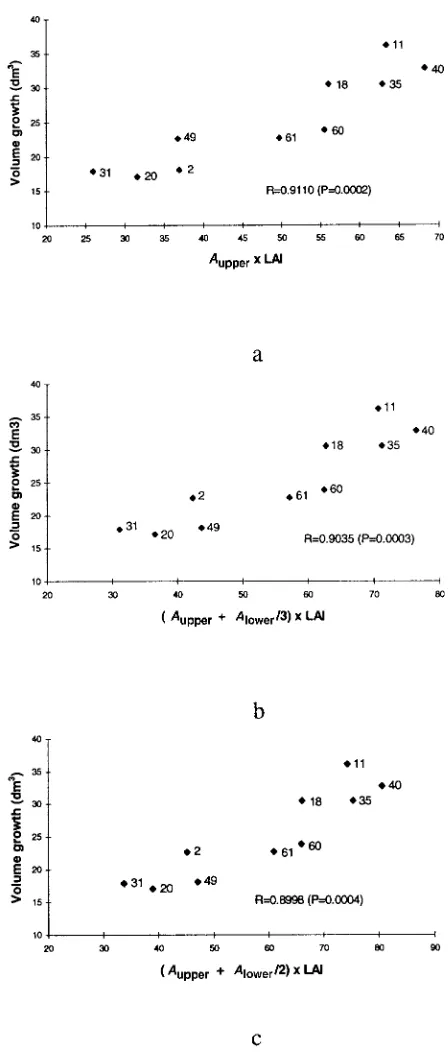
Correlations between volume growth and the combinations of LAI and A, including LAI ×Aupper , LAI × (Aupper + Alower /2)
and LAI × (Aupper + Alower /3), are given in Figure 5 and show
closer relationships (R = 0.8998 to 0.9110) than those between volume growth and Aupper , Alower or LAI alone. The less weight
given to Alower , the closer the relationship obtained. The highest
correlation was between volume growth and LAI × Aupper .
Discussion
Although the modeling of tA was highly significant, an A corrected for each measurement on the basis of tA may not be as precise as a measurement made under standard conditions. However, this method made it possible to make large numbers of measurements on trees in field trials where yield charac-teristics could also be measured. The advantages of instantane-ous measurements of A in the field are considerable and bypass several sources of error. It is also unrealistic to try to measure under standard conditions in the field, particularly when large numbers of measurements are required.
The significant differences among families for Aupper
cor-roborate earlier studies on other species. Significant variation in net photosynthesis was noted among half-sib family seed-lings in Robinia pseudoacacia L. (Mebrahtu and Hanover 1991), Pinus palustris Mill. (Ledig and Clark 1977) and among clones of Populus hybrids (Ceulemans et al. 1987). Parker and Pallardy (1991) found that there was no difference in the pattern of gas exchange response to developing water stress among families of Juglans nigra L., but families differed in their capacity for recovery of gas exchange following rehy-dration after water stress.
We found that much of the total variance in A could be allocated to family for both the upper and lower layers of the crown indicating strong genetic control of A in silver birch. Nelson and Ehlers (1984) noted that A was under strong genetic control in two hybrid Populus clones.
Studies of the correlation between CO2 exchange rate and Figure 1. Correlations between Aupper and environmental variables (a)
Table 3. The family means of volume growth, A and leaf characteristics; LF = leaf fresh weight/area, LD = leaf dry weight/area. Means with the same letter are not significantly different (α = 0.05) in Tukey’s Studentized Range Test.
Family Volume Aupper Alower LAI MTA Leaf size Leaf LF LD
no. (dm3) (µmol m−2 s−1) (µmol m−2 s−1) (cm−2) shape (mg cm−2) (mg cm−2)
Fast group
11 36.07 16.05 5.53 3.95 38.0 12.48 0.775 16.12 5.51
18 30.48 15.44 5.54 3.63 45.3 12.99 0.778 17.68 6.40
35 30.47 15.53 6.16 4.05 39.7 11.62 0.746 17.00 5.66
40 32.75 16.51 5.98 4.13 40.7 14.87 0.746 17.78 6.28
Mean 32.44 15.88 a 5.80 a 3.94 a 40.9 12.99 0.760 a 17.14 5.96 a
Slow group
20 17.10 13.68 6.39 2.31 36.3 12.72 0.749 18.17 6.61
31 17.89 13.51 8.11 1.92 43.0 11.61 0.650 18.03 6.73
49 18.07 14.60 8.01 2.53 50.0 12.40 0.727 16.07 6.18
Mean 17.69 13.93 b 7.50 b 2.25 c 43.1 12.24 0.709 b 17.42 6.51 b
Control group
60 23.85 15.38 5.77 3.61 37.3 12.68 0.769 16.64 5.59
61 22.72 15.62 7.07 3.18 41.3 11.36 0.766 16.37 5.88
2 22.64 15.32 6.97 2.40 43.0 12.02 0.765 17.80 5.71
Mean 23.07 15.44 a 6.60 ab 3.06 b 40.5 12.02 0.767 a 16.94 5.73 a
Family
F 0.0142 0.0706 0.0027 0.1390 0.0305 0.0002 0.0025 0.0002
σ2 (%) 33.64 29.07 54.99 20.94 27.55 53.25 43.41 54.55
Group
F 0.0001 0.0082 0.0001 0.5447 0.0755 0.0060 0.7877 0.0024
plant growth traits have indicated weak to strong positive correlation (Mahon et al. 1977, Ceulemans and Impens 1983, Lapido et al. 1984, Ceulemans et al. 1987) or negative to nonexistent correlation (Lapido et al. 1984, Mebrahtu and Hanover 1991). These variable results may be due to (1) the different expression of growth rate such as height growth, aboveground biomass or whole-plant dry weight (Mahon et al. 1977), or (2) the reactions of different species. However, the significantly positive correlation between Aupper and volume
growth in this study indicates the importance of Aupper to high
yield in birch.
The correlation between Aupper and leaf shape was mainly
caused by Family 31, which had extremely narrow leaves and the lowest Aupper . The correlation was lost (R = 0.3499, P =
0.3565) when this family was excluded.
Leaf fresh weight/area, which reflects leaf thickness to some extent, was not correlated with Aupper . The negative correlation
between leaf dry weight/area and Aupper (Figure 2d) suggests
that leaves with a high dry weight may have high photosyn-thate accumulation that inhibits photosynthetic efficiency.
We observed significant variation in canopy characteristics
among families and a strong genetic control for LAI, but not for MTA. The correlation between volume growth and LAI was stronger than that between volume growth and Aupper or
Alower , indicating the importance of LAI for high yield.
The negative correlation between Alower and volume growth
was probably caused by the high LAI of the fast-growing families. Fast-growing families with heavier crown foliage may cause severe depression in leaf and chlorophyll develop-ment in the lower crown layer as indicated by the significant negative correlation between LAI and Alower (R = 0.7924, P =
0.0063).
Cohen et al. (1987) suggest that the highest photosynthetic rate is obtained by maximizing the LAI of a tree, and that most photosynthesis occurs in the upper meter of the canopy in a Shamouti orange hedgerow orchard. In our study, volume growth was more strongly correlated with Aupper × LAI than
with Aupper , Alower or LAI alone, or with (Aupper + Alower /3) × LAI
or (Aupper + Alower /2) × LAI. Our results indicate that high yields
in silver birch are associated with large leaf area indices and with a large contribution of the upper part of the crown to net photosynthetic rates.
Figure 3. Correlation between volume growth and (a) Aupper and (b) Alower .
Acknowledgment
This study was supported by funding to the first author from CIMO of Finland and the Finnish Academy. The authors gratefully acknowledge the contributions of Ms. Maria Boije, Ms. Nathanig Clancy and Ms. Clodagh Duffy in assisting with field measurements.
References
Cannell, M.G.R. 1989. Physiological basis of wood production: a review. Scand. J. For. Res. 4:459--490.
Ceulemans, R. and I. Impens. 1983. Net CO2 exchange rate and shoot growth of young Populus clones. J. Exp. Bot. 34:866--870. Ceulemans, R., I. Impens and V. Steenackers. 1987. Variation in
photosynthetic, anatomical, and enzymatic leaf traits and correla-tions with growth in recently selected Populus hybrids. Can. J. For. Res. 17:273--283.
Chazdon, R.L. 1988. Sunflecks and their importance to forest under-story plants. Adv. Ecol. Res. 18:1--63.
Cohen, S., M. Fuchs, S. Moreshet and Y. Cohen. 1987. The distribution of leaf area, radiation, photosynthesis and transpiration in a Shamouti orange hedgerow orchard. Part II. Photosynthesis, tran-spiration, and the effect of row shape and direction. Agric. For. Meteorol. 40:145--162.
Fownes, J.H. and R.A. Harrington. 1990. Modelling growth and opti-mal rotation of tropical multipurpose trees using unit leaf rate and leaf area index. J. Appl. Ecol. 27:886--896.
Kramer, P.J. and T.T. Kozlowski. 1979. Physiology of woody plants. Academic Press, Orlando, FL, pp 163--221.
Kursar, T.A. and P.D. Coley. 1993. Photosynthetic induction times in shade-tolerant species with long- and short-lived leaves. Oecologia 93:165--170.
Laasasenaho, J. 1982. Taper curve and volume function for pine, spruce and birch. Comm. Inst. For. Fenn. 108:42--44.
Lapido, D.O., J. Grace, A.P. Sandford and R.R.B. Leakey. 1984. Clonal variation in photosynthetic and respiration rate and diffusion resistances in the tropical hardwood Triplochiton scleroxylon K. Schum. Photosynthetica 18:20--27.
Ledig, F.T. and D.B. Botkin. 1974. Photosynthetic CO2 uptake and the distribution of photosynthate as related to growth of larch and sycamore progenies. Silvae Genet. 23:188--192.
Ledig, F.T. and J.G. Clark. 1977. Photosynthesis in a half-sib family experiment in pitch pine. Can. J. For. Res. 7:510--514.
Long, J.N. and F.W. Smith. 1990. Determinants of stem wood produc-tion in Pinus contorta var. latifolia forest: the influence of site quality and stand structure. J. Appl. Ecol. 27:847--856.
Mahon, J.D., S.B. Lowe and L.A. Hunt. 1977. Variation in the rate of photosynthetic CO2 uptake in cassava cultivars and related species of Manihot. Photosynthetica 11:131--138.
Mebrahtu, T. and J.W. Hanover. 1991. Family variation in gas ex-change, growth and leaf ratio of black locust families. Tree Physiol. 8:185--194.
Nelson, N.D. and P. Ehlers. 1984. Comparative carbon dioxide ex-change for two Populus clones grown in growth room, greenhouse and field environments. Can. J. For. Res. 14:924--932.
Parker, W.C. and S.G. Pallardy. 1991. Gas exchange during a soil drying cycle in seedlings of four black walnut (Juglans nigra L.) families. Tree Physiol. 9:339--348.
Raulo, J. and V. Koski. 1977. Growth of Betula pendula Roth proge-nies in southern and central Finland. Comm. Inst. For. Fenn. 90:1--38.
Rook, D.A. 1985. Physiological constraints on yield. In Crop Physiol-ogy of Forest Trees. Eds. P.M.A. Tigerstedt, P. Puttonen and V. Koski. Helsinki University Press, Helsinki, Finland, pp 1--19. Wang, T. and P.M.A. Tigerstedt. 1993. Variation of growth rhythm
among families and correlation between growth rhythm and growth rate in Betula pendula Roth. Scand. J. For. Res. 8:489--497. Welles, J.M. and J.M. Norman, 1991. Instrument for indirect
measure-ment of canopy architecture. Agron. J. 83:818--825. Figure 5. Correlation between volume growth and (a) Aupper × LAI, (b)