Rapi
a
d
s
s
a
e
s
s
s
s
e
ss
po
m
te
e
n
n
t
t
ecosystem servic
i
o
a
f mang
es
l f
o
n
r
A
p
m
ay
ro
i
a
m
ve stat
nz
en
ule
t fo
in
r
u
s to
Western Region of Ghana
the
Gordon Ajonina, Ph. D., Consultant
November 2011
THE
UNIVERSITY
of Rhode Island
GRADUATE SCHOOL OF OCEANOGRAPHY
Coastal Resources
This publication is available electronically on the Coastal Resources Center’s website at
http://www.crc.uri.edu
For more information on the Integrated Coastal and Fisheries Governance project, contact: Coastal Resources Center, University of Rhode Island, Narragansett Bay Campus, 220 South Ferry Road, Narragansett, Rhode Island 02882, USA. Brian Crawford, Director International Programs at [email protected]; Tel: 401-874-6224; Fax: 401-874-6920.
For additional information on partner activities:
WorldFish: http://www.worldfishcenter.org
Friends of the Nation: http://www.fonghana.org
Hen Mpoano: http://www.henmpoano.org
Sustainametrix: http://www.sustainametrix.com
Citation: Ajonina, G. (2011) Rapid Assessment of Mangrove Status to Assess Potential for
Payment for Ecosystem Services in Amanzule in the Western Region of Ghana. USAID Integrated Coastal and Fisheries Governance Program for the Western Region of Ghana. Narragansett, RI: Coastal Resources Center, Graduate School of Oceanography, University of Rhode Island. 36 pp.
Disclaimer: This publication is made possible by the generous support of the American people
through the United States Agency for International Development (USAID)/Ghana. The contents of this report are the responsibility of the Integrated Coastal and Fisheries Governance (ICFG) Program and do not necessarily reflect the views of the United States Government. Associate Cooperative Agreement No. 641-A-00-09-00036-00 for “Integrated Coastal and Fisheries Governance (ICFG) Program for the Western Region of Ghana,” under the Leader with Associates Award No. EPP-A-00-04-00014-00.
Cover Photo: A village in Ghana
ACKNOWLEDGMENTS
The consultant is gratefully indebted to persons, projects, programmes and institutions contacted during the study. I would like to acknowledge with great thanks the guided assistance of Kofi Agogah of CRC throughout the work. I appreciate greatly the field assistance and contribution of Nicolas Breslyn of NCRC, Balertey Cormey of CRC and Felix Nani of Wildlife Division for their invaluable field assistance without which the work could not have been possible. Great thanks are also due Patrick Sarpong proprietor of Beyin Beach Resort for hospitality and responding to my interview, Tundi Agardi and Winnie Lau of MARES for giving me this opportunity to contrihute to mangrove management in Ghana. John Mason of NCRC, Frank Hicks (Forest Trends) and Joerg Seifert-Granzin (Forest Trends) for initial contacts that led to this work. I also thank Esinam Attipoe for sending complementary information about the area.
LIST OF ABBREVIATIONS AND ACRONYMS
BA Basal Area per hectare
CRC Coastal Resource Center
GWS Ghana Wildlife Society
NCRC Nature Conservation and Research Center
NGO Non Governmental Organisation
PES Payment for Ecosystem Services
PSP Permanent Sample Plot
TSP Temporal Sample Plot
Contents
Contents
ACKNOWLEDGMENTS ii
LIST OF ABBREVIATIONS AND ACRONYMS ii
List of Figures iv
List of Tables iv
EXECUTIVE SUMMARY 1
Introduction 1
Methodological framework 1
Data and information collection ... 1
Survey of mangrove sites ... 1
Findings 1 General status of mangroves ... 1
Carbon storage potentials ... 2
Mangrove wood consumption and impacts on mangrove forests ... 2
Institutional issues, governances of wetlands and potentials for a PES scheme ... 2
Conclusions 3 Recommendations 3 Short-term recommendations ... 3
Medium- and long-term recommendations ... 3
1. INTRODUCTION 4 1.1. Context 4 1.2. Objective of the assessment 4 1.2.1. General objective ... 4
1.2.2. Specific objectives ... 4
1.3. Structure of the report 5 2. METHODOLOGICAL FRAMEWORK 6 2.1. Site description 6 2.1.1. Location of the survey area ... 6
2.1.2. Biophysical environment... 6
2.1.3. Socio-economic environment and human activities ... 7
2.2. Data and information collection and analysis 7 2.2.1. Survey of mangrove sites ... 8
2.2.2. Assessing mangrove ecosystem services ... 8
3. FINDINGS 11
3.1.1. General status of mangroves 11
3.1.2. Carbon storage potentials ... 13
3.1.3. Mangrove wood consumption and impacts on mangrove forests ... 14
3.2. Institutional issues, governance of wetlands and potentials for a coastal and marine PES
scheme 16
3.2.1. Institutions and stakeholders for mangrove management ... 16
3.2.2. Importance and potentials of local tourism industry development ... 18
3.2.3. Prospects of oil and gas industry ... 21
4. CONCLUSIONS AND RECOMMENDATIONS 23
4.1. Conclusions 23
4.2. Recommendations 23
4.2.1. Short-term recommendations ... 23
4.2.2. Medium- and long-term recommendations ... 24
REFERENCES 25
ANNEXES 27
List of Figures
Figure 1 Schematic of mangrove temporal sample plots (a) for measurement of all stems dbh ≥ 1
cm (b) for seedlings & saplings ≤ 1cm and stiltroots with measurement of middle
diameter of stiltroot. 9
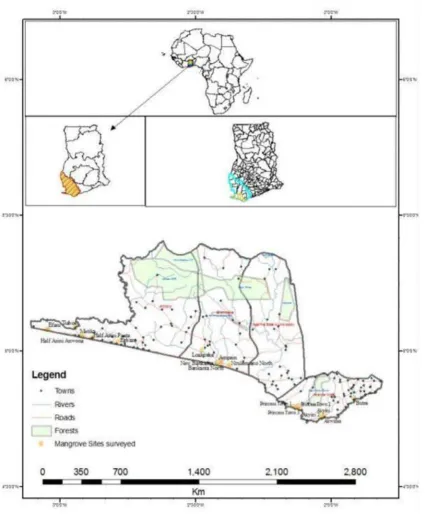
Figure 2 Map of Amanzuri wetlands showing distribution of surveyed mangrove sites 11
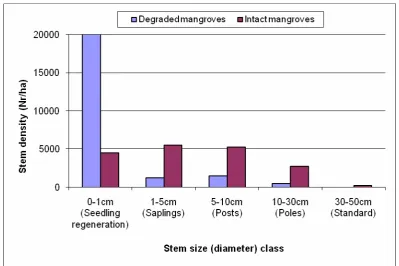
Figure 3 Stem diameter distribution in mangrove forests of Amanzuri wetlands, Ghana 14
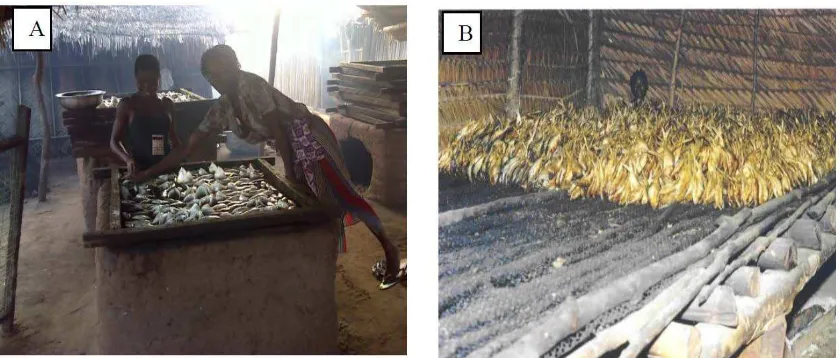
Figure 4 Fish smoke ovens in mangrove communities in (A) West Africa Efasou, Ghana and Central Africa (B) Mouanko , Cameroon (Photos: A: Nicolas Breslyn B: Gordon
Ajonina). 16
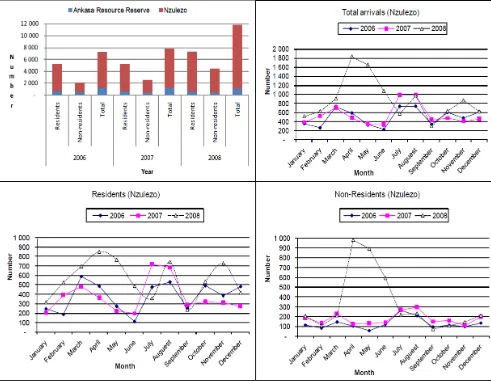
Figure 5Monthly and year distribution of tourist visits from sites around Amensuri wetlands,
Ghana 19
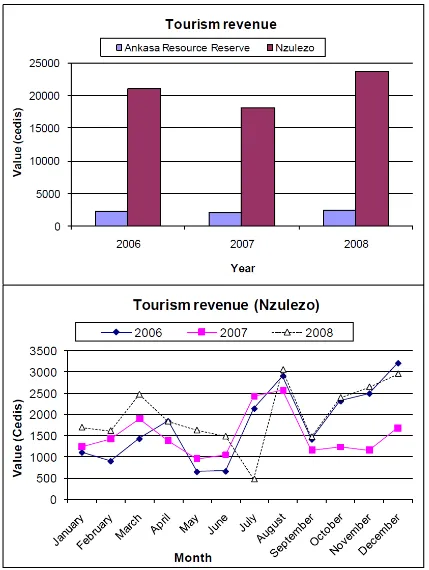
Figure 6 Monthly and year trends in tourism revenue from sites around Amensuri wetlands,
Ghana 20
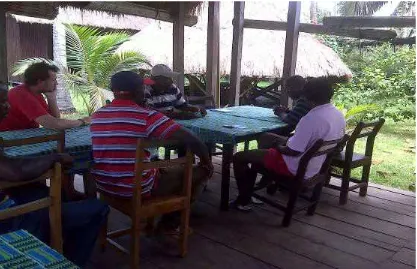
Figure 7 Interview with the proprietor (in red short) of eco-lodge at Beyin (Photo by Nicolas
Breslyn) 21
List of Tables
Table 1 General appraisal of mangrove status and condition in the Amanzuri wetlands (based on
18 mangrove sites), Ghana 12
Table 2 Stand structural characteristics and above ground carbon stocks of intact and degraded
Rhizophora dominated mangroves in the Amanzuri wetlands, Ghana 13
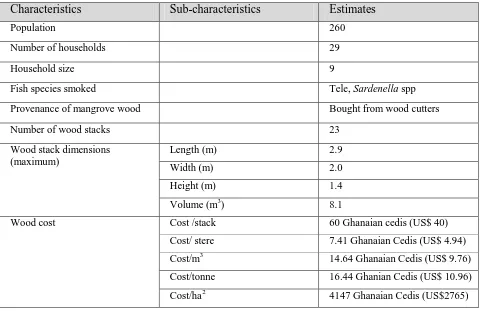
Table 3 Characteristics of mangrove wood use and per ha value of mangroves for fuel wood
within a typical fishing community (Efasou, Amanzuri wetlands, Ghana) 15
Table 4 Community fuel wood consumption and impacts on surrounding mangrove forests
within the Efasou fishing community (Amanzuri wetlands, Ghana) 15
Table 5 First level institutional and stakeholder analysis for mangrove management 17
EXECUTIVE SUMMARY
Introduction
A rapid assessment was carried out within the mangroves of Amanzule Wetlands in Ghana to assess the types and conditions of mangroves and associated ecosystem services (e.g., carbon sequestration, fish nursery, and coastal protection) in the field for use in feasibility assessment of the potential for payment for ecosystem services in the mangroves and wetlands in Amanzuri and surrounding areas.
Specific objectives of the rapid assessment were:
• To provide analysis of the types of mangroves and wetlands and their status and
distribution in the Amanzuri region;
• To gather information about the uses and governance of these wetlands
• Provide insights into the use of the information gathered in feasibility assessment
of the potential for payment for ecosystem services in the mangroves and wetlands in Amanzuri and surrounding areas.
Methodological framework
Data and information collection
Both primary and secondary data collection approaches were used for the study. A
combination of stakeholder’s discussions and on-ground surveys during field trips were used to gather the necessary information. A more participatory approach was adopted by interactive discussion of basic issues during various consultative meetings and interviews organized with local institutions: local authorities, private sector operators (especially tourism), public
authorities community groups including NGOs: NCRC and CRC to gather information about the governance of these wetlands and to discuss the project status especially preliminary assessment of the potential for developing a blue carbon project in the region, including discussions with NCRC and CRC about their planned larger-scale carbon mapping work.
Survey of mangrove sites
The over 18 mangrove sites visited during the field trip spanning over five days from 11 – 15 September 2011 were guided by information on existence of mangroves from many local informants. Data and information collected from each mangrove site enabled the sites to be mapped, assessed for mangrove ecosystem services especially potentials for carbon storage and sequestration services, mangrove wood use and impacts on the forest.
Findings
General status of mangroves
Carbon storage potentials
The total above ground carbon stored in intact mangroves in the area ranged from 65 – 422 tC/ha (mean of 185 tC/ha) with mangrove roots holding in some cases 78% in degraded
mangrove areas. It should be noted that below ground carbon storage accounts for over 50% and reaching 98% of total whole ecosystem storage in mangrove ecosystems from a recent
quantification of whole- ecosystem carbon storage in Indo-Pacific region.
Mangrove wood consumption and impacts on mangrove forests
The mangroves are currently valued for fuel wood use at 4146 Ghanaian cedis (US$2765) per ha within the Efasou community. Mangrove wood consumption for cooking and fish smoking
from the Efasou community is estimated at 16 and 97m3/household/yr respectively with a
respective per capita consumption of 1.8 and 10.8 m3/person/yr. Current deforestation rates for
cooking and fish smoking is put at 0.06 and 0.34 ha/household/year respectively with a respective per hectare harvest of 0.006 and 0.038 ha/person/year. Wood consumption for fish smoking were generally lower than for a Cameroonian fishing community owing to the use of more efficient fish smoking ovens
Institutional issues, governances of wetlands and potentials for a PES scheme The institutions and stakeholders in the management of mangrove forests in the Western Region of Ghana reflect a broad range of interests at national, regional and local community level. The role played by each of these stakeholders has a direct or indirect impact on the
resource. At the apex of the stakeholder spectrum is the national government whose policies and
programs for management of mangroves and associated wetlands are implemented through the Wildlife Division of the Forestry Commission and other related agencies such as the Lands Commission and the Department of Town and Country Planning. At the regional level we have Regional Coordinating Council. The local level is represented by a number of players or interest groups whose actions and inactions determine the outcome of all mangrove management efforts now and in the foreseeable future. These include among others, the District Assemblies with their substructures, civil society groups, producer groups and trade associations, traditional authorities, commercial organizations and local communities around the mangrove forests.
The following general observations can be made:
First level institutional and stakeholder’s analysis (Central government, department agencies, regional administration, academic research institutions, local government and donor agencies).
• Weak enforcement of existing legislation
• Good structures in place but severely limited by logistical capacity of government
departments
• Lack of communication and information sharing to intended users
• Poor altitude towards mangrove and wetlands which is not taken in any development
planning processes
• Donors funds that address short term solutions to long-term problems with poor level of
• private sector participation
Second level institutional and stakeholder’s analysis (District assemblies, traditional authorities, local communities, NGOs and other civil society groups).
• - Ignorance of roles of wetlands that are taken for granted
• - Land tenure conflicts
• - Long term financing leading to period of neglect in working with communities as less
than 40% of the mangrove sites has received any intervention (Table 1 & Annex 1)
Conclusions
• Types, status and distribution of mangroves and associated wetlands in the
Amanzuri region. More than 1 000 ha of mostly estuarine mangrove forests exist in
scattered pockets in Amanzuri area representing about 10% of national mangrove coverage with most of the mangroves not captured in the current vegetation map of the area. These mangroves are generally healthy supporting the livelihood and ecological securities of surrounding fishing or farming human population. There was a general perception of mangrove communities that these mangroves have decreased in area over the last 20 years with identified threats that include wood collection for fuel wood, charcoal, construction, etc, pollution from wastes disposal especially in around urban centers and mining activities and mouth closure due to sedimentation that impedes tidal flow that maintain mangrove ecological processes. The total above ground carbon stored in intact mangroves in the area is also important and can be comparable to similar mangrove systems. The mangrove is currently valued for fuel wood use at 4146
Ghanaian cedis (US$2765) per ha with a significant impact on mangrove forest
• Institutional issues and governance of wetlands in the area. The institutions and
stakeholders involved in the management of mangrove forests in the Western Region of Ghana reflect a broad range of interests at national, regional and local community level. The role played by each of these stakeholders has a direct or indirect impact on the
resource.
• Feasibility of a PES scheme can be seen from the view point of the institutional and
stakeholders in the region. The challenge is how to get the private sector involved in the deal especially the oil companies. Already private tourisms initiatives hold some promise as some have started some green investments.
Recommendations
Short-term recommendations
• Addressing stakeholders and instructional issues
- Development of stakeholders contact data base.
- Organization of an enlarged stakeholder’s forum.
- Cross institutional capacity building.
- Sharing of research finding
- Sensitization campaigns.
• Completion of Ghana carbon map and mangrove carbon monitoring
Medium- and long-term recommendations
• Addressing direct on site threats to mangrove ecosystem services
- Conservation. For sites with significant healthy mangroves
- Hydrological restoration. For sites with mouth closure due to sedimentation
through channel opening to allow normal tidal exchange with mangroves, areas
- Replanting. For badly degraded sites
- Waste removal. Particularly for urban and peri-urban polluted sites
• Policy review or reforms.
1. INTRODUCTION
1.1. Context
Mangroves cover about 140 km2 in Ghana being limited to a very narrow, non-continuous
coastal area around lagoons on the west of the country; and to the east, on the fringes of the lower reaches and delta of the Volta River (UNEP, 2007). They are most extensive to the west in the stretch between Cape Three Points and Côte d’Ivoire, especially, areas around Half Assini, Amanzure lagoon, Axim, Princes Town and Shama, among others including Takoradi area. To the east of the country, they are best developed at Apam, Muni lagoon, Winneba, Sakumo-1 lagoon, Bortiano, Korle lagoon, Teshie, Sakumo-2 lagoon, Ada, Sroegbe and Keta lagoon. Six species of mangroves typical of West-Central African mangroves are found in Ghana: Acrostichum aureum, Avicennia germinans, Conocarpus
erectus, Laguncularia racemosa, Rhizophora harrisonii, and Rhizophora racemosa. The open
lagoons tend to be dominated by Rhizophora racemosa, whilst closed lagoons with an elevated salinity contain Avicennia germinans, Conocarpus erectus, Laguncularia racemosa and Acrostichum aureum (UNEP, 2007).
Ghana’s mangrove ecosystems are tremendously valuable, providing ecosystem services like carbon sequestration, protection from storms, floods, and erosion, provision of timber and non- timber forest products, processing of waste and nutrient pollution, aquaculture and agriculture support, and habitat for aquatic and terrestrial species. In the lower Volta, the total estimated value for mangrove related harvesting (fish smoking, house roofing) (US $ 340 per hectare) and contribution to marine fisheries (US $ 165 per hectare) is over US $ 500 per hectare with country estimates of well over US$ 6,000,000 per year but not including all the other mangrove ecosystem services (e.g. erosion control, trapping of pollutants, provision of biomass for the detritivore food chain etc.) (Gordon et al, 2009).
Yet, as in many other parts of the world, short-term development needs are undermining long- term mangrove health and survival. Between 1980 and 2006, the mangrove area in
Ghana fell from 181 km2 to 137 km2 representing a loss of 24% (UNEP 2007; Ajonina et al,
2008).
Fortunately, economic mechanisms have the potential to tip the balance toward restoration, maintenance, and protection of mangrove forests. The need for proper valuation of mangrove ecosystem services underpins such mechanisms towards the establishment of any realistic payment for ecosystem services scheme in any given mangrove or wetland habitat.
1.2. Objective of the assessment
1.2.1. General objective
To assess the types and condition of mangroves and associated ecosystem services (e.g., carbon sequestration, fish nursery, and coastal protection) in the field for use in feasibility assessment of the potential for payment for ecosystem services in the mangroves and wetlands in Amanzuri and surrounding areas.
1.2.2. Specific objectives
• To provide analysis of the types of mangroves and wetlands and their status and distribution in the Amanzuri region; and
• To gather information about the uses and governance of these wetlands
• To provide insights into use of information gathered in feasibility assessment of the
potential for payment for ecosystem services in the mangroves and wetlands in Amanzuri and surrounding areas.
1.3. Structure of the report
The report is divided into five chapters:
• chapter one Introduction
• chapter two provides the methodological framework that includes general site
description and the methods of data and information collection and analyses.
• chapter three presents and discusses the findings of the assessment
2. METHODOLOGICAL FRAMEWORK
2.1. Site description Ghana
Ghana is located in West Africa on the Guinea Coast. At latitudes of 4-12°N, It shares borders with Togo on the East, Burkina Faso on the North, La Cote d’Ivoire on the West and the Gulf of Guinea to the South. Ghana covers an area of 238,539 square kilometers.
Extensive water bodies, including Lake Volta and Bosomtwi, occupy 3,275 square kilometers, while seasonal and perennial rivers occupy another 23,350 square kilometers. Ghana's population is estimated at 23.8 million (2009) and is assumed to be increasing at a rate between 2.8 and 3.0 percent per annum. The birth rate (1999) is estimated at 39 per thousand, death rate 10 per thousand and infant mortality rate is 66 per thousand life births. Ghana is classified as a developing country with a per capita income GDP of US$ 1098 (2009).
Agriculture and livestock constitute the mainstay of Ghana’s economy, accounting for 32% of GDP in 2009 and employs 55% of the economically active population. Agriculture is predominantly rainfed, hence making it a great concern with respect to potential climatic changes. Climate change and variability is already affecting Ghana’s water resources, and often attributed to global warming caused by increased greenhouse gas emissions for several decades. Their impacts on the country are evident in climate-induced changes to physical and biological systems which increasingly exert considerable stress on the country’s vulnerable sectors: Agriculture, Coastal Zones/Marine Ecosystems and Water Resources.
Whilst there is no concrete evidence of climate change occurring in Ghana, some climate variability through changing regimes of climatic factors are evident. These climatic
extremes, has led to periods of severe drought, crop production and livestock herds decline and the severe food shortage experienced in the country in the early 1980's was a clear testimony. The adverse impacts of climate change on the socioeconomic factors driving the sustainable livelihoods of the rural communities coupled with poverty also limit economic development.
2.1.1. Location of the survey area
The survey area lies (see Figure 2) within the Amanzuri Wetlands which is a community protected area in the Western Nzema Traditional Area of the Western Region. The catchment of the wetland lies within the Western Evergreen Forest zone of Ghana. It covers an area of approximately 100 sq. km. Amanzuri wetland (latitudes 4° 53' and 4° 46' North and longitude 2° 00' and 2° 05' west) is 360 km west of Accra. It is bordered to the east by Central Region, to the west by Cote D’Ivoire, to the north by Ashanti and Brong-Ahafo regions and to the south by the Gulf of Guinea. The mangrove areas also lie within six coastal districts of the Western Region: Jomoro District, Nzema East Municipality, Ahanta West District, Sekondi-Takoradi Metropolitan and the newly created Shama District and Ellembele District.
2.1.2. Biophysical environment
Geology and soils
The soil are predominantly Forest Oxysols and Forest Ochrosols-Oxysols intergrades (Brammer, 1962).
Hydrology and wetlands
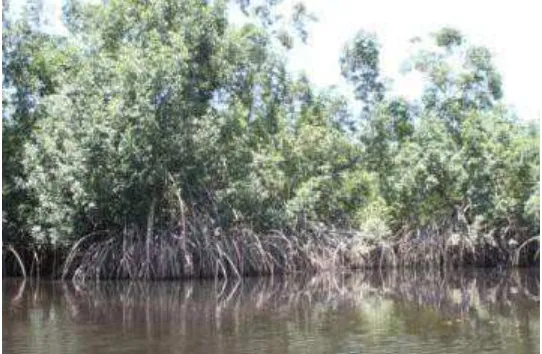
streams, one lake, and one outlet to the sea. It includes freshwater Amanzuri lagoon, the coastal Amanzuri lagoon and estuary, and the sandy beach between Amanzuri and Ankobra River and the area is subject to seasonal flooding. It is a relatively a pristine complex consisting of a freshwater lagoon, forest, grasslands and rivers. It has the most extensive remaining stand of intact swamp forest in Ghana.
Climate and vegetation
The region lies in the equatorial climate zone characterized by moderate temperatures. About 75 percent of the land area falls within Ghana’s high forest zone. It is characterized by high rainfall and relative humidity. It experiences a double-maxima pattern of rainfall and peaks in May-June and October-November each year. The average annual rainfall is 1,600mm with the relative humidity being 87.5%. A mean annual temperature of 26° C has been recorded. However, there is a short dry season (Dec-Mar) during which period a northwesterly directional wind is experienced with slight harmattan conditions.
Biodiversity values
The Amanzuri Wetlands is the only known peat swamp forest in Ghana, and nationally, the best example of swamp forest characterized with black humic water. Some 70% of the site is covered by swamp forest, making accessibility difficult hence contributing its unspoilt nature. Has a rich biodiversity. In terms of flora 33% of the 237 species of plants identified are
endemic to the wetland. Notable species include raffia palm and iron wood (Lophira alata).
Faunal reports (GWS, 2003) estimate 27 species of mammals, including black and white colobus , Mona, and spot-nosed monkeys; forest squirrels; and red river hog. Some 26 species of reptiles and amphibians, including the slender-snouted crocodile and the dwarf crocodile, green mambas and black forest cobra. There are 26 species of fish.
The wetland is relatively rich in indigenous avifauna and also hosts various migrant species. Over 105 species of bird were recorded in an inventory, 65 of which are of global and
national conservation interest. The area is classified as IBA (Birdlife International, 2007) and it meets the criteria for designation as a Wetland of International Importance.
Another important biodiversity characteristic of the site is the coastal areas constituting important turtle nesting sites. Species with possibility of being sighted include
(NCRC/Benyin Beach Resort, 2000): the Leatherback, Dermochelys coreace (common), Green turtle Chelonia mydas (common) Olive Ridley, Lepidochelys olivacea (most common) and Hawksbill, Eretmochelys imbricate (rare). Species such as Loggerhead Caretta caretta and Kemp’s Ridley Lepidochelys kempi are yet to be sighted in the area
Increasing development trends place them at further risk. A particular concern is that these sensitive lagoons, which are important as nursery grounds for many demersal fish species, as habitat for birds, mammals, reptiles and as turtle nesting beaches, are becoming increasingly vulnerable to degradation from development.
2.1.3. Socio-economic environment and human activities
Activities include fishing, local gin processing, and charcoal production, small scale farming of crops such as coconut, oil palm, cassava, cocoa, plantain and small scale trade.
2.2. Data and information collection and analysis
Both primary and secondary data collection approaches were used for the study. A
to gather the necessary information. A more participatory approach was adopted by interactive discussion of basic issues during various consultative meetings and interviews organized with local institutions: local authorities, private sector operators (especially tourism), public authorities community groups including NGOs: NCRC and CRC to gather information about the governance of these wetlands and to discuss the project status especially preliminary assessment of the potential for developing a blue carbon project in the region, including discussions with NCRC and CRC about their planned larger-scale carbon mapping work.
2.2.1. Survey of mangrove sites
The over 18 mangrove sites visited during the field trip spanning over five days from 11 – 15 September 2011 were guided by information on existence of mangroves from many local informants. Data and information collected from each mangrove site visited included:
• GPS fixes and estimation of mangrove area from maximum width and length for
mapping purposes using GIS softwares especially ARC Info & ArcView,
• mangrove type ( estuarine, lagoonal, etc) ,
• tidal exchange status
• the degraded and health status of the mangrove ,
• Main adjoining vegetation,
• Population, institutional and stakeholders issues around mangroves
• Community perception of trends of mangrove area change during the last 10-20 years
• Main activities within mangroves,
• Current uses and potential threats, and
• future management perspectives
2.2.2. Assessing mangrove ecosystem services
Carbon storage and sequestration services
The carbon storage and sequestration potentials of the mangroves were measured through the establishment of 0.01ha (10m x10m) temporal sample plots (TSPs) systematically laid at 10m interval along a random 30m transect compass direction from a fixed point. This is a simplified modification of 6 (10m x 10m) plots laid along 100m transect used in the Central African coastal region of Cameroon (Ajonina, 2008). A total of four TSPs were assessed in four mangrove sites and one plot in a degraded mangrove site. The diameter at breast height or 30cm above the stiltroot was measured for all trees within the plot with a diameter tape and stand height determined by means of a Suunto Clinometer. Roots and seedlings not
measured in the plots were counted in 5(1m2) plots placed systematically at 1m interval
Transect orientation and lay-out (Random compass direction)
Figure 1 Schematic of mangrove temporal sample plots (a) for measurement of all stems dbh ≥ 1 cm (b) for seedlings
& saplings ≤ 1cm and stiltroots with measurement of middle diameter of stiltroot.
The tree and stand data obtained were used to obtain estimates for above ground mangrove forest carbon densities from biomass assessment following various standard volume estimation procedures (Loetsch et al, 1973, Cailliez, 1980; Husch et al, 2003):
Basal area per hectare
BA = π/4Σ(fid²i)/A--- (1) Volume per hectare
Vs = BA.H.F--- (2)
Where BA = basal area per hectare (m²ha-1)
Vs = standing volume per hectare (m3ha-1)
di = diameter (in metres)
F = tree form factor (0.6) (from Ajonina and Usongo, 2011)
A = plot area in hectares
fi = number of trees in the ith DSR class
Carbon density was estimated as half biomass obtained from product of volume and
mangrove mean wood density values obtained from Fearnside (1997) of 0.890 t/m3
Mangrove wood use and impacts on mangrove forest
A detailed mangrove wood use survey was carried out in the Efasou fishing community area known for intensive use of mangroves for fish smoking. Mangrove wood stocks owned
by households1 in the area were estimated as well as estimates of turnover rates by
members of the household for cooking and fish smoking activities. The information and data from mangrove forest stock assessment were then used to assess the rate of mangrove wood utilisation as follows (Ajonina and Usongo, 2001; Ajonina et al, 2005):
Estimating the rate of deforestation
Per household
Dh =52Vh/t--- (3)
Total rate of deforestation (volume estimate)
Dt=nDh--- (4)
Total rate of deforestation (per hectare estimate)
Dr =Dt /Vs--- (5)
Where Dh = household deforestation rate (m3 household -1 yr-1)
Vh = mean household wood stock (m3)
t = turnover rate (in weeks)
n = total number of households
Dt = total rate of deforestation (m3yr-1) Dr = total rate of deforestation (ha yr-1)
Vs = mangrove stocking rate (m3ha-1)
Mangrove ecosystem services for fisheries and storm protection
Data was very limited to assess mangrove ecosystem services for fisheries and storm/erosion protection within the context and framework of methods provided by (Barbier et al 1997).
3. FINDINGS
3.1. Status and threats of mangrove ecosystem services
3.1.1. General status of mangroves
The current general status of the mangroves in the Amanzuri wetlands based on the 18 sites surveyed is presented in Table 1 and mangrove distribution map in Figure 2. Details of site specific status are presented at Annex 1.
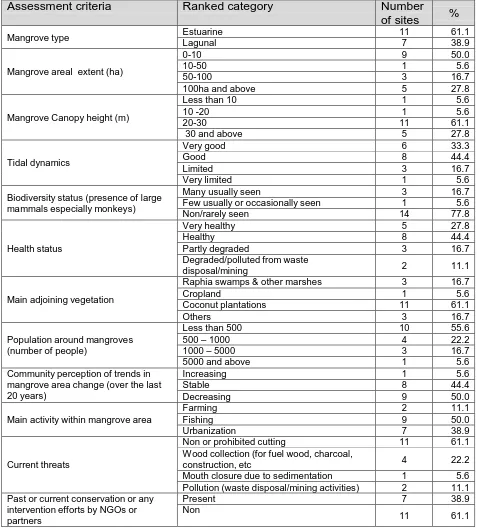
The survey showed that over 1 000 ha of mangrove forests exist in scattered pockets of less than 10 ha (in 56% of the sites) in Am anzuri area representing about 10% of national
mangrove coverage of 14 000 ha following UNEP 2007 sub-regional survey. Most of the mangroves do not appear in the current vegetation map of the area are estuarine mangrove type (61%), generally healthy (44%) reaching canopy height of 30m surrounded by coconut plantations (61%) supporting the livelihood and ecological securities of meeting a
surrounding fishing or farming human population of less than 500 people (56%). There was a general perception by mangrove communities in 50% of the sites surveyed that these mangroves have decreased in area over the last 20 years. Identified threats include wood collection for fuel wood, charcoal, construction, etc, pollution from wastes disposal especially in around urban centers and mining activities) and mouth closure due to sedimentation that impedes tidal flow that maintain mangrove ecological processes. However there have been no or prohibited cutting on mangroves in over 60% of the sites.
Table 1 General appraisal of mangrove status and condition in the Amanzuri wetlands (based on 18 mangrove sites), Ghana
Assessment criteria Ranked category Number
of sites %
Mangrove type Estuarine 11 61.1
Lagunal 7 38.9
Mangrove areal extent (ha)
0-10 9 50.0
10-50 1 5.6
50-100 3 16.7
100ha and above 5 27.8
Mangrove Canopy height (m)
Less than 10 1 5.6
Biodiversity status (presence of large mammals especially monkeys)
Many usually seen 3 16.7
Few usually or occasionally seen 1 5.6
Non/rarely seen 14 77.8
Health status
Very healthy 5 27.8
Healthy 8 44.4
Partly degraded 3 16.7
Degraded/polluted from waste
disposal/mining 2 11.1
Main adjoining vegetation
Raphia swamps & other marshes 3 16.7
Cropland 1 5.6
Coconut plantations 11 61.1
Others 3 16.7
Population around mangroves (number of people)
Less than 500 10 55.6
500 – 1000 4 22.2
1000 – 5000 3 16.7
5000 and above 1 5.6
Community perception of trends in mangrove area change (over the last 20 years)
Increasing 1 5.6
Stable 8 44.4
Decreasing 9 50.0
Main activity within mangrove area
Farming 2 11.1
Fishing 9 50.0
Urbanization 7 38.9
Current threats
Non or prohibited cutting 11 61.1
Wood collection (for fuel wood, charcoal,
construction, etc 4 22.2
Mouth closure due to sedimentation 1 5.6
Pollution (waste disposal/mining activities) 2 11.1
Past or current conservation or any intervention efforts by NGOs or partners
Present 7 38.9
Non
3.1.2. Carbon storage potentials
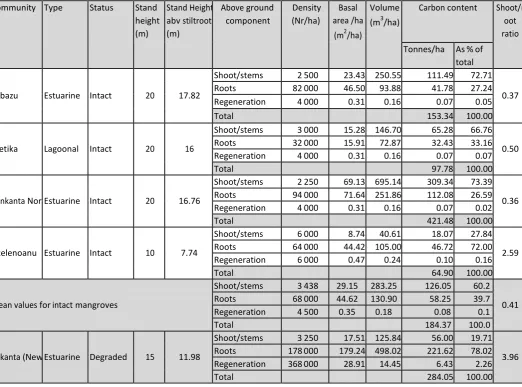
The total above ground carbon stored in intact mangroves in the area (see Table 2 and stem size class distribution in Figure 3) range from 65 – 422 tC/ha per ha with mean of 185 tC/ha with mangrove roots holding in some cases 78% in degraded mangrove areas. It should be noted that below ground carbon storage accounts for over 50% and reaching 98% of total whole ecosystem storage in mangrove ecosystems from a recent quantification of whole-ecosystem carbon storage by Donato et al (2011). They measured tree and dead wood
biomass, soil carbon content, and soil depth in 25 mangrove forests across a broad area of the Indo-Pacific region where mangrove area and diversity are greatest. These data indicate that mangroves are among the most carbon-rich forests in the tropics, containing on average 1,023Mg carbon per hectare. Organic-rich soils ranged from 0.5m to more than 3m in depth and accounted for 49–98% of carbon storage in these systems. When they further combined their data with other published information, they estimated that mangrove
deforestation generates emissions of 0.02–0.12 Pg carbon per year—as much as around 10% of emissions from deforestation globally, despite accounting for just 0.7% of tropical forest area.
Table 2 Stand structural characteristics and above ground carbon stocks of intact and degraded Rhizophora dominated mangroves in the Amanzuri wetlands, Ghana
Community Type Status Stand
height
Carbon content Shoot/r
oot
Nzelenoanu Estuarine Intact 10 7.74
Shoot/stems 6 000 8.74 40.61 18.07 27.84
2.59
Roots 64 000 44.42 105.00 46.72 72.00
Regeneration 6 000 0.47 0.24 0.10 0.16
Total 64.90 100.00
Mean values for intact mangroves
Shoot/stems 3 438 29.15 283.25 126.05 60.2
0.41
Roots 68 000 44.62 130.90 58.25 39.7
Regeneration 4 500 0.35 0.18 0.08 0.1
Total 184.37 100.0
Bakanta (New Estuarine Degraded 15 11.98
Shoot/stems 3 250 17.51 125.84 56.00 19.71
3.96
Roots 178 000 179.24 498.02 221.62 78.02
Regeneration 368 000 28.91 14.45 6.43 2.26
Figure 3 Stem diameter distribution in mangrove forests of Amanzuri wetlands, Ghana
3.1.3. Mangrove wood consumption and impacts on mangrove forests
The mangrove is currently valued for fuel wood use at 4146 Ghanaian cedis (US$2765) per ha within the Efasou community (Table 3) well above estimates of US $ 340 per hectare in the lower Volta (Gordon et al, 2009). Wood consumption is presented in Table 4 with comparison with estimates from a similar typical Cameroon mangrove fishing community. Mangrove wood consumption for cooking and fish smoking from the Efasou community
is estimated at 16 and 97m3/household/yr respectively with a respective per capita
consumption of 1.8 and 10.8 m3/person/yr. Current deforestation rate for cooking and fish
Table 3 Characteristics of mangrove wood use and per ha value of mangroves for fuel wood within a typical fishing community (Efasou, Amanzuri wetlands, Ghana)
Characteristics Sub-characteristics Estimates
Population 260
Number of households 29
Household size 9
Fish species smoked Tele, Sardenella spp
Provenance of mangrove wood Bought from wood cutters
Number of wood stacks 23
Wood stack dimensions (maximum)
Length (m) 2.9
Width (m) 2.0
Height (m) 1.4
Volume (m3) 8.1
Wood cost Cost /stack 60 Ghanaian cedis (US$ 40)
Cost/ stere 7.41 Ghanaian Cedis (US$ 4.94)
Cost/m3 14.64 Ghanaian Cedis (US$ 9.76)
Cost/tonne 16.44 Ghanian Cedis (US$ 10.96)
Cost/ha2 4147 Ghanaian Cedis (US$2765)
Table 4 Community fuel wood consumption and impacts on surrounding mangrove forests within the Efasou fishing community (Amanzuri wetlands, Ghana)
Region Activity Turnover rates
(m3
/yr)
Deforestation rates
(ha/yr) Source
Per
household Per
capita Per
household Per
capita West Africa
(Efasou mangrove community Ghana)
Cooking 15.83 1.76 0.06 0.006
This survey
Fish smoking 97.44 10.83 0.34 0.038
Central Africa (Douala-Edea mangrove villages: Mbiako, Yoyo I &
Cooking 19.74 2.50 0.004
Ajonina and Usongo, 2011
Fish smoking 105.58 13.39 0.024
Wood consumption for fish smoking were generally lower than for a Cameroonian fishing community owing to the use of more efficient fish smoking ovens (see Figure 4) whose perspectives can be explored (see Feka et al, 2009).
Figure 4 Fish smoke ovens in mangrove communities in (A) West Africa Efasou, Ghana and Central Africa (B) Mouanko , Cameroon (Photos: A: Nicolas Breslyn B: Gordon Ajonina).
3.2. Institutional issues, governance of wetlands and potentials for a coastal and marine PES scheme
3.2.1. Institutions and stakeholders for mangrove management
The institutions and stakeholders in the management of mangrove forests in the Western Region reflect a broad range of interests at national, regional and local community level.
The role played by each of these stakeholders has a direct or indirect impact on the resource.
At the apex of the stakeholder spectrum is the national government whose policies and programs for management of mangroves and associated wetlands are implemented through the Wildlife Division of the Forestry Commission and other related agencies such as the Lands Commission and the Department of Town and Country Planning. At the regional level we have Regional Coordinating Council. The local level is represented by a number of players or interest groups whose actions and inactions determine the outcome of all
mangrove management efforts now and in the foreseeable future. These include the District Assemblies with their substructures, civil society groups, producer groups and trade
associations, traditional authorities, commercial organizations and local communities around the mangrove forests. Stakeholder and institutional analysis from the policy to field levels are presented in Tables 5 and 6 while site specific issues are presented at Annex 2. In each tier, the major actors are identified with their roles and responsibilities; an assessment of current level of implementation is made with suggested strategies towards sustainable mangrove management.
The following general observations can be made:
• First level institutional and stakeholder analysis (Central government, department
agencies, regional administration, academic institutions, local government and donor agencies).
- Weak enforcement of existing legislation
- Good structures in place but severely limited by logistical capacity of government
departments
- Lack of communication and information sharing to intended users
- Poor altitude towards mangrove and wetlands which is not taken in any development
planning processes
- Donors funds that address short term solutions to long-term problems with poor level
Table 5 First level institutional and stakeholder analysis for mangrove management
Institution/ stakeholder
Roles/ responsibilities Assessment/remarks Strategies for improvement towards
sustainable mangrove management
Central Government
Policies, treaties, laws (forestry & wildlife policy 1994, Ramsar treaty 1971, wildlife Act…….)
Laws in place, but enforcement is weak
Laws should be revised, more research to enhance policies, more stakeholder participation encouraged
Departments/ agencies
Implementation, regulation, enforcement, compliance, monitoring and evaluation. Wildlife Division is present in the region but is largely focused on game reserves, e.g., Ankasa etc
Structures in place, but are not functioning well due to severe limitations in logistics
More training needed, more resources be provided by central government and donor partners in the near future. Mangrove conservation objectives needs to be emphasized and integrated with game reserve objectives as integral ecological framework
Regional administration
Complementary and supervisory
Does have capacity needed for mangrove management. In recent times efforts are being made by some NGOs to sensitize them.
Its role is important and needs to be involved at the policy and implementation levels.
Academic and research institutions
They are to provide research information on state of wetlands and conditions of mangroves
There have been research efforts by some academic researchers from University of Ghana, some NGOs like Wildlife Society and others. However, the research findings are difficult to come by.
There is the need to coordinate the process of sharing research findings, research efforts in order to avoid duplication of efforts.
Local Government
Regulation, enforcement and implementation
Relative to mangrove and wetland management the six coastal districts have not done much. The laws have not been enforced due to the poor attitude towards wetlands. The weak presence of the Wildlife Division in the region has also contributed to this poor state of affairs.
Local government structures need to be equipped with adequate knowledge on the importance of wetlands in addition to resources to be able to support the Division and other NGOs to protect, conserve the mangroves
Donor/Funding agencies
Provision of funds and technical advice
They have been providing funds for long time now. Eg. WB, EU countries and other bilateral donors. Some of these funds addressed the problems in the short to medium terms. In most instances, the projects stalled as funding dried up and this has created more problems for resource
management.
Project planning and funding should be oriented towards long term goals to ensure sustainability. Partners need to work together to achieve this. The Ghanaian government has a role to play by factoring this into annual budgets. It should not be the sole responsibility of outside donors. Commercial bodies whose actions impact the wetlands should also be brought on board, eg. hard and soft mineral producers. Possibilities of a carbon tax/green tax may be explored.
• Second level institutional and stakeholder’s analysis (District assemblies, traditional
authorities, local communities, NGOs and other civil society groups).
-Ignorance of roles of wetlands that are taken for granted
-Land tenure conflicts
-Long term financing leading to period of neglect in working with communities as less
than 40% of the mangrove sites has received any intervention (Table 1 & Annex 1).
Table 6 Second level local institutional and stakeholder analysis for mangrove management
Institution/ stakeholder
Roles/
responsibilities
Assessment/remarks Strategies for improvement
towards sustainable
mangrove
District assemblies
Regulation, permitting, enforcement (agencies like town and Country planning is supposed to regulate developments in the districts.)
Laws are not enforced due in part to ignorance about importance of wetlands. They also do not have resources to visit sites for inspection and regulation
They should be involved in the design and implementation of future projects concerning wetlands and also be given some logistics for the task.
Traditional authorities
They the custodians of the land and are supposed to regulate its usage through the granting of tenural rights etc
They have not been playing this role effectively. In most cases they lose control over the management of land in their areas. Most, if not all of them are totally ignorant about the importance of wetlands in their areas.
Their involvement through
sensitization is very important in this regard. This will help bring about local ownership of the proposed interventions.
Local communities
They in most cases depend directly on the resource and are to help manage it
Their direct activities in most cases have been impacting negatively on mangrove management in local communities. This has also been aggravated by ignorance, tenure right controversies and concerns of settler fisher folks. There is also the underlining issue of limited
livelihood opportunities and severe poverty. The down-turn in fishing and associated activities is forcing most of them to exploit aqua forests on commercial scale. Local
perceptions about mangrove forests are not healthy. They see them as ordinary trees which can grow again after harvesting.
Sensitization of local communities, redefining of tenural rights and resolution of concerns of settler fisher folks are very necessary in addressing mangrove management problems. Alternative livelihood schemes needs to be identified and promoted in local communities.
NGOs and other civil society groups
Inform and educate local communities on sustainable
management of mangroves
There has been a problem with long term finance. This has led to long periods of neglect in working with communities e.g. RC from Italy did a lot of work in the past but has reduced its presence in local communities due to limited funds. Wildlife Society is present in some local communities but their activities have been limited in their activities. Majority of them are concentrated mainly on the regional capitals. Capacities are also limited in the area scientific and technical appreciation of wetland ecology. Some do the right things wrongly.
All the groups working on mangroves need to be identified through the establishment of a data base initiated by either themselves or a state institution like the Wild Division of the Forestry
Commission. This should not be seen as a means to control their activities. Their capacities should also be built and maintained.
3.2.2. Importance and potentials of local tourism industry development
The dominant role of Ghana Wildlife Society (GWS)
The Ghana Wildlife Society (GWS) has been playing a critical conservation role in the area especially as she has introduced small-scale development projects that protect the
R
minimal impacts to the wetlands. To promote tourism, they have built walkways and provided boats to view plant and animal species in the reserve. As a result, the number of tourists has been on the increase since 2006 to more than 10 000 annually (Figure 4). Generating an annual revenue of near 24 000 Ghanaian cedis (US$ 16000).
Figure 5Monthly and year distribution of tourist visits from sites around Amanzule wetlands, Ghana
Conservation and Integrated Development Project during a presentation at a government conference.
Private tourism operators case of Eco-Lodge at Beyin
Figure 7 Interview with the proprietor (in red short) of eco-lodge at Beyin (Photo by Nicolas Breslyn)
- Sole proprietorship owned by a Ghanaian
- Effectively started in 2006 from 5 acres (2.03ha) of land leased from the chiefs
between the years 2003-2004.
- Infrastructure built from local materials include a restaurant, eight rooms for a
maximum of 25 people at a rate including breakfast of 85 Cedis (US$ 42.5) for two people, 70-135 Cedis (US$46.7-90.0) for 4 people.
- Nine people are employed (8 ladies & one man) with a senior secondary certificate to
meet up the catering, laundry and gardening/landscape tasks
- Most of his visitors (95%) are foreign nationals from Europe, America and Africa while
5% are Ghanaian nationals
- August and December (mostly holidays and Christmas) are peak business periods
with over 70% of occupancy corresponding to high profits margins hitting 65% taking into account the replacement (depreciation) rate of local materials of 8 – 15 years. Profit margin has been on the increase being at least 35% per month. Some 10% goes to the Beyin city council
- Environmental support investments include: building of sea turtle conservation trust
funds that started in 2007 from which a secondary school library is being built at Beyin that should benefit the more the school Wildlife Group.
- Problem and challenges mostly hinge on finding ways of strengthening weak
communication links with the local community, relations with the wildlife division and getting qualified local staff that mostly go into the cities.
3.2.3. Prospects of oil and gas industry
Building capacity for adapting to a rapidly changing coastal zone p. 17) concerning booming prospects of oil and gas and the impacts of offshore and onshore construction and operations on both the marine and terrestrial environments. The publication continues that today in the Western region, the multiple causes and consequences of ecosystem change are
overshadowed by the prospect of oil and gas development. How the exploitation of this new source of wealth, employment and development pressures is managed will determine whether the result will be a new and generous source of national income with employment and business opportunities that benefit both the Western Region or yet another example of curse or oil. How will the jobs and the wealth produced be distributed? Will local Ghanaian companies be formed to provide the services required by new industries? Will the local labor force be trained to fill new employment opportunities or will skilled labor be implored and earnings flow overseas? Who will benefit and who will lose? Will new schools, new hospitals and the other entire infrastructure demanded by a bigger population keep pace with a rush of development?
4. CONCLUSIONS AND RECOMMENDATIONS
4.1. Conclusions
The rapid assessment exercise though limited by time and certain information gaps the following conclusions can be drawn:
• Types, status and distribution of mangroves and associated wetlands in the Amanzuri
region
More than 1 000 ha of mostly estuarine mangrove forests exist in scattered pockets in Amanzuri area representing about 10% of national mangrove coverage with most of the mangroves not captured in the current vegetation map of the area. These mangroves are generally healthy supporting the livelihood and ecological securities of surrounding fishing or farming human population.
There was a general perception of mangrove communities that these mangroves have decreased in area over the last 20 years with identified threats that include wood collection for fuel wood, charcoal, construction, etc, pollution from wastes disposal especially in around urban centers and mining activities and mouth closure due to sedimentation that impedes tidal flow that maintain mangrove ecological processes.
The total above ground carbon stored in intact mangroves in the area is also important and can be comparable to similar mangrove systems.
The mangrove is currently valued for fuel wood use at 4146 Ghanaian cedis (US$2765) per ha with a significant impact on mangrove forest
• Institutional issues and governance of wetlands in the area
The institutions and stakeholders in the management of mangrove forests in the Western Region of Ghana reflect a broad range of interests at national, regional and local community level. The role played by each of these stakeholders has a direct or indirect
impact on the resource.
• Feasibility of a PES scheme
A PES scheme may be feasible when addressed within the context of the institutional and stakeholders in the region. The challenge is how to get the private sector involved in the deal especially the oil companies. Already private tourisms initiatives hold some promise as some have started some green investments.. Oil and gas companies need to be guided within a certain platform on mangrove ecosystem valuation information on what the society will lose if ecosystem services provided by the mangroves are lost and get to pay for them.
4.2. Recommendations
4.2.1. Short-term recommendations
• Addressing stakeholders and instructional issues
- Development of stakeholders contact data base. All the groups working on mangroves
need to be identified through the establishment of a data base initiated by either themselves or a state institution like the Wild Division of the Forestry Commission.
- Organization of an enlarged stakeholder’s forum. In order to resolve conflict
issues on mangrove and coastal resource management issues an enlarged forum of key stakeholders preferably convened by the government with NGOs playing a facilitating role is needed to identify and chart up a common vision and workable strategies for mangrove conservation within the general integrated coastal management issues. The ongoing organization of the proposed coastal forum by NRC could be a window
capacities of governmental organizations by providing them basic logistics.
- Sharing of research finding. Mechanisms should be developed to promote
communication and sharing of research results either through forums or any communication media.
- Sensitization campaigns. Need for adequate sensitization campaigns to strengthen
awareness on the importance threat and need to conserve wetlands.
• Completion of Ghana carbon map and mangrove carbon monitoring
There is need to complete the current Ghana carbon map with the mangrove component using appropriate methodologies especially those currently implemented within the Central African Mangrove forests with some establishment of long-term mangrove permanent sample plot system for measuring mangrove carbon sequestration and ecosystem dynamics system under various human extraction regimes.
4.2.2. Medium- and long-term recommendations
• Addressing direct on site threats to mangrove ecosystem services
There is need to address site specific threats through various actions:
• Conservation. For sites with significant healthy mangroves
• Hydrological restoration. For sites with mouth closure due to sedimentation through
channel opening to allow normal tidal exchange with mangroves, areas
• Replanting. For badly degraded sites
• Waste removal. Particularly for urban and peri-urban polluted sites
• Policy review or reforms. Need to revise existing law with more research to
enhance policies with encouragement in stakeholders’ communication
• Sustainable funding through private sector participation. Donor partners
REFERENCES
Ajonina, G.N. (2008). Inventory and modelling mangrove forest stand dynamics following different levels of wood exploitation pressures in the Douala-Edea Atlantic coast of Cameroon, Central Africa. Mitteilungen der Abteilungen für Forstliche Biometrie,
Albert-Ludwigs- Universität Freiburg.2008- 2. 215p.
Ajonina, G.N. and Usongo, L. (2001). Preliminary quantitative impact assessment of wood extraction on the mangroves of Douala-Edea Forest Reserve, Cameroon. Tropical
Biodiversity 7 (2-3): 137-149.
Ajonina, Gordon, Diamé, Abdoulaye and James Kairo (2008). Current status and
conservation of mangroves in Africa: An overview. WRM Bulletin 133, August 2008
http://wrmbulletin.wordpress.com/2008/08/25/current-status-and-conservation-ofmangroves-in- africa-an-overview/
Ajonina, P.U., Ajonina, G.N., Jin, E. Mekongo, F., Ayissi, I. and Usongo, L.(2005).Gender roles and economics of exploitation, processing and marketing of bivalves and impacts on forest resources in the Douala-Edaa Wildlife Reserve, Cameroon. International
Journal of Sustainable Development and World Ecology 12: 161- 172
Anon. 2010. Hen Mpoano. Our Coast, our future, Western Region of Ghana. Building capacity for adapting to a rapidly changing coastal zone. 64pp.
Barbier, E.B., Acreman M.C. and Knowler, D. (1997). Economic Valuation of Wetlands. A
guide for policy makers and planners. Ramsar Convention Bureau Gland, Switzerland.
143pp.
Birdlife International (2007). Birdlife’s online World Bird Database: the site for biodiversity conservation. Version 2.1. Cambridge, UK: Birdlife International. Available:
http://www.birdlife.org
Cailliez, F. (1980). Forest Volume Estimation and Yield Prediction. Vol. 1. Volume estimation. FAO Forestry paper no. 22 FAO Rome.
Donato, D.C., Kauffman,J.B. , Murdiyarso, D. Sofyan Kurnianto, S. Melanie Stidham, M. and Markku Kanninen, M. (2011). Mangroves among the most carbon-rich forests in the tropics. Nature Geoscience 4: DOI: 10.1038/NGEO1123.
Feamside, P.M. (1997). Wood density for estimating forest biomass in Brazilian, Amazonia. Forest Ecology and Management 90:59-87
Feka, N.Z., Chuyong, G.B. and Ajonina, G.N. (2009). Sustainable utilization of mangroves using improved fish smoking systems: A management perspective from the Douala-Edea Wildlife Reserve, Cameroon. Tropical Conservation Science 4:450-468
Gordon, C., Tweneboah, E., Mensah, A.M. and Ayivor, J.S. (2009). The Application of the Ecosystem Approach to Mangrove management: Lessons for Ghana. Nature &
GWS (2003). Amanzuri Wetlands Ecosystem Management Plan 2003: Ghana Wildlife Society
Husch, B., Beers, T.W. and Keuhaw Jr., J.A. (2003). Forest mensuration, 4th Edition. John Wiley & Sons. 443 pp
Loetsch, I. Zohier, F. and Haller, K. (1973). Forest Inventory Vol. 2. Second Edition BIV, Germany, 469pp
NCRC/Benyin Beach Resort (2000): Sea Turtle Conservation on the west coast of Ghana: A background report.
Annex 1. General status and conditions of mangroves in the Amensuri wetlands, Ghana
Site No
Name Community Main activity Mangrove type
Population Species composition Extent (ha)
Biodiversity Adjoining vegetation
Human use Community
perception of trends
Main threats Priority actions
1 Alegunsuri Alegusi Farming Estuarine 400 Rhizophora , Avicennia 0.1 25 very healthy Very good Used to be crocodiles
Coconut plantation Non Decreasing Non Conservation
2 Ndabelah Nzimitianu Fishing Estuarine 1000 Large swamp communities with some spotted Rhizophora & Avicennia stands
5.0 25 Partly degraded
Limited Coconut plantation Heavy wood collection for fish smoking
Decreasing W ood collection for firewood and building
Conservation & restoration
3 Efasou Efasou Fishing Estuarine 700 Rhizophora 2.6 25 Partly degraded
Limited Coconut plantation Heavy wood collection for fish smoking
Decreasing W ood collection for firewood, mouth closure
Hydrological restoration, replanting
4 Domuli Egbazu Farming/ fishing
Estuarine 1200 Rhizophora 75.0 20 Healthy Good Coconut plantation Low wood collection for cooking, construction, fishing
Increasing Non Conservation
5 Amaziri Chiko (Half Assini Anwona)
Urbanisation Estuarine 700 Rhizophora 0.5 20 Healthy Limited Coconut plantation Decreasing Mouth closure hydrological restoration
6 Awine-anloa Fante (Half Assini Fante)
Urbanisation Lagoonal 5000 Rhizophora 1.5 30 Polluted very limited Few monkeys occassionally seen
Coconut plantation W aste disposal, livestock rearing, wood collection for fish smoking
Decreasing Pollution W aste removal, hydrological restoration,
Decreasing Non Conservation
8 Amasuri North Aloakpeke Fishing/ farming
Lagoonal 350 Very few Rhizophora stands (less than 1 per ha), Large swamp mixed of Ironwood (Lophira alata with tree density of 50 per ha with diameter more than 1m)
200.0 25 Healthy Good Birds, fishes Large marshy plain W ood for charcoal, fishing especially Black Tiliapia
Decreasing Charcoal production Conservation
9 Amasuri Bakanta (New
Good Coconut plantation W ood for charcoal, cooking and construction
stable charcoal production, wood for cooking, wood for
Crab collection, fuelwood collection and wood for construction
Stable Non Conservation
13 Kikan Kikan City Urbanisation Lagoonal 1000 Rhizophora dominated 12.0 20 Healthy good swamps Decreasing Non Conservation
14 Ankoba Tiaboe Fishing Estuarine 500 8.0 20 Healthy Good Cococunut
plantations
Stable Non Conservation
15 Awhuele Princess
W ood harvest prohibited by traditional authorities
Stable Non Conservation
16 Yan Princess town/Anleo
Urbanisation Estuarine 400 Mixed mangrove species 2.0 15 Partly degraded
good Cococunut
plantations
wood harvest prohibited Decreasing Mining activities upstream Sustainable mining
17 Ezele Akyemin Urbanisation Lagoonal 350 Mixed mangrove species 150.0 25 Very healthy very good Cococunut plantations
wood harvest prohibited Stable Non Conservation
18 Butare Butare Urbanisation Lagoonal 650 Mixed mangrove species 7.5 30 Very healthy very good Settlement wood harvest prohibited Stable Non Conservation
13600 1046.2 25.4
Annex 2. Site specific stakeholders and institutional analysis for mangrove (aqua- forest) management in the western region
No Site Current
situation
Constraints/ threats
Past and present efforts
Limited fuel wood sources, ignorance, presence of energy facility (Osagyefo Barge), unclear land tenure regime and the issue of migrant communities. Sand bar at beach, limited livelihood
opportunities
RC of Italy worked there some 6 years ago on turtles but did not focus on with support from CRC-Ghana. Their capacity is very, very weak in all aspects of mangrove conservation.
Traditional authority is willing (Nana Whaji), manual clearing of sand at mouth of large tract of mangroves mangroves, the down turn in fishing industry, potential use of mangrove for charcoal,
construction of tourism facilities.
No known past efforts to protect mangroves. clearing at the mouth of Efunkpole lagoon dumping of waste.
No past attempts at conservation; no
Clearing of refuse dumps, public education, clearing of sand bar at beach, relocation of dumping sites, enforcement of regulations by DA, presence of Wildlife Division
Signs of exploitation at some potions for charcoal production. Proposed gas processing facility along the banks of Domunli river poses a potential threat.
GWS has been working in the two communities since 2010 with support from CRC-Ghana process must be participatory through the involvement of all stakeholders. domestic waste and harvesting for fuel wood
No past or present intervention
TA, local community
Sensitization, clearing of waste from lagoon. evidence of large commercial UCSOND a local
TA, Forestry Commissi on, Lands Commission, DA, Reg. Adm.
No Site Current situation
Constraints/ threats
Past and present efforts threat if not checked will completely wipe off the forest within a short period of time. Limited livelihood opportunities, ignorance about the forest, and absence of state forestry officials.
NGO to educate the people under its wetlands conservation program. This is on a limited scale
livelihoods
Sensitization Mangroves remain of river upstream by illegal miners (Tomentu)
RC worked on turtles six years ago but not on mangroves. Turtle hunting still goes on according to local people
Local people, TA, DA,
RC worked there on turtles CRC is supporting CF to educate local people on
mangrove conservation
TA, local people Sensitization Mangroves remain owners, fuel wood extraction options, illegal gold exploitation- reported presence of
manganese/bauxite
RC in the past and CF currently working in the area with support from CRC-Ghana