Volume III No.2/2013
Tobacco Economic of Indonesia: Poor Households’ Spending Pattern, Tax Regressivity and Economic Wide Impact of Tax Simplification
Rus’an Nasrudin Ledi Trialdi Djoni Hartono Abdillah Ahsan
March 2013
Department of Economics
Chief Editor: Suahasil Nazara
Editors: Djoni Hartono, Beta Y. Gitaharie, Femmy Roeslan, Riatu M. Qibthiyyah Setting: Rus’an Nasrudin
Copyright c2013, Department of Economics Department of Economics Building 2nd Floor Depok
West Java, Indonesia 16424 Telp. 021-78886252
Email: rusan.nasrudin@gmail.com
Contents 3
List of Tables 4
List of Figures 5
1 Introduction 1
1.1 Background . . . 1
1.2 Objectives of Study . . . 2
2 Literature Review 3 2.1 Spending Pattern of Smoking and Non-Smoking Family . . . 3
2.2 Tax Burden Regressivity . . . 3
2.3 Economic Impacts of Simplification of Cigarette Taxation . . . 4
3 Methodology 5 3.1 Household Comparison . . . 5
3.1.1 Performing T-test . . . 5
3.1.2 The Determinants of Indviduals Smoking Decision . . . 6
3.2 Regressivity Analysis . . . 6
3.2.1 Measuring Tax Burden Over Income Groups . . . 6
3.2.2 Change in Regressivity from Tax Inrease. . . 7
3.3 Economic Wide Impact Analysis of Simplification of Cigarette Taxation . . . 7
4 Result and Analysis 8 4.1 Household Comparison Analysis . . . 8
4.1.1 Descriptive Analysis & T-test Analysis. . . 8
4.1.2 The Determinants of Individuals Smoking Decision . . . 10
4.2 Regressivity Analysis . . . 12
4.2.1 IFLS Data . . . 12
4.2.2 Average Tax Burden of Cigarette Excise Tax over Income Group . . . 14
4.3 Economic Impact of Simplification of Cigarette Taxation . . . 17
5 Concluding Remarks 23
1 Scenarios in the CGE model. . . 9
2 Consumption Priority of Household Group with and without Smoker in Indonesia, 2010 (in percentage and value) . . . 9
3 Consumption Priority of Poor Household Group with and without Smoker in In-donesia, 2010 (in percentage and value) . . . 11
4 Impacts of Cigarette Spending on Households Spending Pattern in Indonesia, 2010 (in Percentage and Point Percentage). . . 11
5 Impacts of Cigarette Spending on Poor Households Spending Pattern in Indonesia, 2010 (in Percentage and Point Percentage). . . 12
6 Mean Comparison of Portion of Expenditures between Poor Households with and without Smoker Using T-Test . . . 13
7 The Distribution of Sample over Brand in Each Taxation Class(%) . . . 15
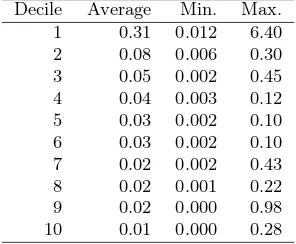
8 Cigarette Expenditure as Proportion of Earning per Month by Decile. . . 15
9 Summary of Excise Tax Regressivity Using IFLS (Average Measures). . . 16
10 The Impact of Each Scenario on Macro Indicators (%) . . . 19
11 The Impact of Each Scenario on Sectoral Output(%) . . . 19
1 Logistic Regression on Determinants of Individuals Decision to Smoke . . . 13
Regressivity and Economic Wide Impact of Cigarette Excise Tax
Simplification
✩Rus’an Nasrudina
, Ledi Trialdib
, Djoni Hartonoc
, Abdillah Ahsand a
Department of Economics, Faculty of Economics, University of Indonesia b
Department of Economics, Faculty of Economics, University of Indonesia c
Graduate Program in Economics, Faculty of Economics, University of Indonesia d
The Demographic Institute, Faculty of Economics, University of Indonesia
Abstract
Policy to reduce cigarette consumption is needed because of the harm to both smokers and the surrounding healthy. In narrow sense, the harm of cigarette consumption for poor households needs to be taken into account into policy consideration as it expected to sacrifies essential spending for the poor. In general, any policy related to any influental sector in the economy, including tobacco sector, needs an economic wide impact consideration. This study aims to justify the policy on three grounds: analysis on poor household with smoker in terms of their spending pattern, an assessment of the cigarette excise tax burden’s regressivity and and economic wide impact analysis of a cigarette excise tax simplification. This study find that there is tendency of lower spending on essential good (health and food) of poor household with smoker than without smoker. Secondly, indeed, the tax burden of Indonesia’s excise tax is regressive so that it put burden more to the poor than the richer. Lastly, a cigarette tax increase will reduce national output with considerably small impact but moderately increase government revenue to boost the economy through infrastructure spending as the optimum opt.
JEL Classifications: I18, D58
Keywords: Cigarette, Consumption Pattern, Excise Tax, Regressivity, Computable General Equilibrium
1. Introduction
1.1. Background
There are always at least two rationales be-hind the idea of cigarette taxation increase: to increase government revenue and to reduce
✩This paper is part of SEATCA Initiative on
To-bacco Tax (SITT) Indonesia funded by Bill and Melinda Gates Foundation.
Email address: rusan.nasrudin@gmail.com
(Rus’an Nasrudin)
nomic condition of the households.
In order to increase government revenue and to reduce consumption of cigarette at the same time, information about price elasticity of de-mand for cigarette is very important. There have been many studies investigating it, but the results are quite similar. Demand for cigarette has been found to be price inelas-tic. For Indonesia, studies from Bird (1999), Marks (2003), and Djutaharta et al. (2005), for instance, revealed that the price elasticity of demand for cigarette in Indonesia was rang-ing from -0.29 to -0.67, meanrang-ing that 10 per-cent increase in cigarette price would reduce its consumption by 2.9 to 6.7 percent. With the inelastic nature of the demand, economic the-ory suggests that the tax increase in cigarette will increase revenue generated by government, since the increase in price from higher taxa-tion will outsrip the reductaxa-tion in consumptaxa-tion. However, with the same nature of elasticity, it also implies that consumption can only be sig-nificantly affected if the tax is also increased significantly.
Significant tax increase may be increasingly important particularly in concern of the poor households who consume cigarette at present. When the higher tax can only cut back their consumption but not able to make them quit smoking, two different costs might arise. The first cost may result from the higher tax burden born by the poor from consuming cigarette. It is related to the regresssivity nature of the excise tax. Indeed, the regressivity nature may still need to be checked although many economists already tend to agree with the con-clusion due to the similarity of the excise tax with any other types of consumption tax. How-ever, the more important observation needed is to identify the regressivity of the tax after its rate is increased, rather than when the rate is as it is now. As will be discussed further in another subsection below, increasing the tax rate may further increase the burden of the poor, thus called regressive, or otherwise, it
may reduce the burden. When the former hap-pens, failure in making the poor quit smok-ing through higher tax would cost them even higher.
The second cost may arise from the shift in the poors priority of spending because of the cigarette consumption as mentioned earlier. When the higher tax cannot induce the poor to quit smoking, they will probably maintain their spending behavior. Therefore, in the future, if the shift from some essential spendings is re-ally evident in the poor households spending pattern, the behavior may sustain their poor social and economic condition as well as their smoking behavior.
At last, although significant tax increase might be needed, particulary to salvage the poor, its wider impact to the economy also needs to be elaborated. The tax increase may harm, not only the poor who smokes, but also the farmers, the labors, and the producers of tobacco and may be the economy as a whole due to the potential reduction in demand of the products. Higher revenue generated from the taxation increase may also not happen as expected, may be because of the complexity of the excise tax structure and other tax admin-istration problems.
Despite the fact that many careful consid-erations are required before implementing the policy, from the law perspective, room to in-crease tax rate of tobacco product in Indonesia still opens. The current rate is still below the threshold allowed by the law, which is up to 55 per cent of retail price. In 2009, for to-bacco product, on average total excise rate is 42,7 percent and total tax rate is 51,1 percent. The figures are nearly twice those in India and Russia but lower than in Egypt (Ministry of Finance, 2012).
1.2. Objectives of Study
specifically, the study is trying to answer the following research questions:
1. Is there any significant difference between poor households with and without smokers in terms of their spending on such essen-tial expenditures as education and health? With the current spending pattern, does it affect the persistence of smoking behavior in the poor households in the future? 2. Are the current cigarette taxes (i.e.
ex-cise tax and value-added tax) regressive? When the excise tax is increased, how does it affect the demand for cigarette and the regressivity of the taxation?
3. What are the impacts of the increase in excise tax for cigarette on the economy re-garding government revenue, employment, and household income?
2. Literature Review
2.1. Spending Pattern of Smoking and Non-Smoking Family
Ahsan and Tobing (2008, p.28) revealed the spending structure of the poorest household with smokers from 2003 to 2005. Compared to other expenditures, spending for cigarettes in this group of household was around 12 percent of their total spending. Similar information can also be obtained in Barbara S. et al. (2008, p.9), but for data in 2005 and with smaller number of expenditure category. Moreover, the study of Ahsan and Tobing (2008) also esti-mated the impact of household smoking sta-tus to their essential expenditures, namely ex-penditure of sources of protein, exex-penditure for education, and expenditure for health. The es-timation was using log-linear regression with smoking status of the household represented by a dummy variable. The results show that smoking family tends to spend less for educa-tion and health compared to non-smoking fam-ily, but they spend more for expenditure of sources of protein.
Similar to the study of Ahsan and Tobing above, Terblanche (2012) attempted to find sig-nificant difference in spending behavior from smoking and non-smoking families in South Africa. She used a rather simple method us-ing a parametric T-test. The results seem to replicate condition in Indonesia, in that smok-ing family again tends to spend less for edu-cation and health compared to non-smoking family. However, further estimation was also conducted in the study to find determinants that affect people’s decision to smoke in South Africa. From the estimation, Terblance found that less spending on education by the smok-ing family would imply to lower level of edu-cation attained by the family’s next generation and thus prolong the smoking behavior of the family in the future. The estimation from the previous studies above has not yet observed the possible different pattern between smok-ing and non-smoksmok-ing family among the poor-est group. Ahsan and Tobing (2008) only ob-served that households with different income level might have different patern of spending, while Terblanche (2012) did not touch this matter at all.
2.2. Tax Burden Regressivity
One particular tax system is considered re-gressive if the tax payments increase less pro-portionately with income (Stiglitz 2000, p.159). It suggests that lower income people will have to bear more tax burden in their income rel-ative to those who have higher income, thus they are unfairly treated by the tax system.
are disproportionately consumed more by the poor. Removing the regressivity of the excise tax is hardly done, particularly when govern-ment only targets excise tax and ignores the other kinds of consumption tax. Some advo-cates of high cigarette taxes, while acknowledg-ing their regressivity, however, suggestacknowledg-ing that increasing cigarette taxation may result in pro-gressive tax. It means, after the tax increase, poorer people will bear a lower tax burden rel-ative to their income.
Borren and Sutton (1992) and Townsend (1987) evaluated the overall increase in cigarette taxation in the United Kingdom. In so doing, their works put strong emphasis on estimating the cigarette demand for different social class based on a log-linear single equation model. Since the increase in cigarette taxation would affect number of cigarette consumption through the price channel, the estimated de-mand function would provide the necessary in-formation about the price-elasticity of demand. While Borren and Sutton (1992) with the ex-tended data set did not find evidence of increas-ing price-elasticity by social class (from the highest to the lowest class), the former work of Townsend (1987) found the opposite. As a consequence, the two studies came up with different suggestion. Borren and Sutton sug-gested that increasing the levy on cigarettes was a regressive policy, whereas Townsend sug-gested the opposite due to her observation that the lower social classes were more sensitive to price changes.
Warner (2000), Evans and Farrelly (1998), and Townsend again with Roderick and Cooper (1994), as summarized in Remler (2004), have maintained the proposition of Townsend (1987) that indeed, the poor are more price responsive and thus a tax increase may not be regressive. Remler (2004) himself, supported the idea and literally evaluated the effects of higher cigarette taxes on three types of smokers (i.e. smokers who quit, who does not quit, and who cut back) utilizing three alternative methods of assessing
tax burden, namely the accounting measure, the traditional welfare-based measure, and the time-inconsistent welfare based measure.
As has been summarized by Barber S. et al. (2008), some studies have also been conducted to estimate the demand function of cigarette in Indonesia. For instance, Bird (1999), with an error correction model using annual aggregate data from 1970 to 1994; De Beyer and Yurekly (2000), with a log linear model using time se-ries data from 1980 to 1995; Djutaharta et al. (2005), with the similar log linear model but using annual data from 1970 to 2001 and also monthly data from 1996 to 2001; and Marks (2003), with a series of model that take into ac-count population growth, income growth, and substitution between cigarette products using aggregate data from 1999 to 2002. From those studies, the price elasticities of demand for cigarette in Indonesia were ranging from -0.29 to -0.67.
Nevertheless, the price elasticity numbers from all studies above are obtained for aggre-gate numbers. The estimation of price elastic-ity of demand for different social class in In-donesia could not be observed up until a study conducted by Ahsan and Tobing (2008). In their study, social class was divided into income quintiles; with quintile I to quintile V repre-sented the lowest to the highest income group. The price elasticities resulted from their condi-tional cigarette demand estimation varied from -0.06 (quintile II) to -0.41 (quintile IV). The re-sult seems to suggest that there was no clear indication of the increasing price sensitivity for the poorer income people in Indonesia.
2.3. Economic Impacts of Simplification of Cigarette Taxation
Some previous studies have tried to mea-sure the impact of particular variable in re-sponse to tobacco tax changes. Walbeek (2010) presented a model that predicts changes in cigarette consumption and excise revenue in response to excise tax changes, and demon-strated that, if the industry has market power, the consequences from increases in specific taxes are easier to control than those from in-creases in ad valorem taxes. Djutaharta et al. (2005) focused on the impacts of tax rate in-crease on government revenue income and price elasticities using stochastic model. The study found that an increase in the tax level of 10, 50 and 100 percent would increase total tax revenue by 9, 43 and 82 percent respectively. Ahsan and Wiyono (2007) combined the result of elasticities from Djutaharta et. al (2005) and I-O based model to estimate the impact of 100 percent tax increase on the output, em-ployment and income.
Unfortunately, there is limited attempt from the studies above to measure and explain the wide impact of simplification of tobacco prod-uct strprod-ucture to the economy. This study is aimed to fill the void by providing alternative approach using a computable general equilib-rium approach that decompose the standard sectors of the24-social accounting matrix data to meet the structure of current excise tax of tobacco product layers in Indonesia in order to meet the objective.
3. Methodology
3.1. Household Comparison
3.1.1. Performing T-test
The main question raised in this section is whether there is statistically significance of the difference in socio-economic expendi-tures between two types of poor households in the economy: households with and with-out smokers. Therefore, we design a T-test hypothesis testing for expenditure of ith com-ponent of household expenditure, where i ∈
{education,health}, as:
H0:µN Si =µSi (1)
H1:µN Si 6=µSi (2)
Where µi is the average spending of poor
households for particular commodity i.
Both descriptive and t-test analysis in this study utilize data from National Socio-Economic Survey (Susenas) 2010. Sample of the Susenas data is households that spread over all provinces in Indonesia.
Since the study mainly concerns on spending behavior of poor households, the first thing to do is to identify the poor households from the sample. The identification is made by employ-ing distric and city poverty line 2010 of the National Bureau of Statistics (BPS) Indone-sia. However, slight adjustment is needed be-fore we can use the BPS poverty line since the BPS uses it to identify poor individuals rather than poor households. In so doing, monthly per capita expenditure of each household is es-timated, and then the result is compared with the individual poverty line. When the monthly per capita expenditure of one particular house-hold is below the poverty line of its correspond-ing district or city, thus the household is cate-gorized as poor.
The identification of poor households us-ing the method above is expected to be more accurate and representative than using the World Bank poverty standard, the BPS na-tional or provincial poverty line (instead of dis-trict/city), or the simple family decile method (by monthly average expenditure) which sets the first two or three quantiles as poor house-holds. The main advantage of using the dis-trict/city poverty line is its ability to capture more variety of standards of living in each dis-trict/city in Indonesia.
five million poor households or 23.2 million poor individuals represented by Susenas sam-ple. With estimated number of poor people in Indonesia in 2010, according to BPS, was 31.9 million or 13.3 percent of total Indonesia popu-lation, the poor individual samples in Susenas represent more than 70 percent of poor peo-ple or almost 10 percent of total population in Indonesia.
After obtaining poor household samples, the next step is to separate households with and without smoker. It can be identified from monthly expenditure of cigarette data in the Susenas. When the figure is non-zero (zero), the respective household has (has no) smoker. From this classification, poor house-hold samples are now distributed, though not equally, with around 56 per cent (or represent-ing 2.8 million poor households) classified as poor households with smoker and the remain-ing 44 per cent (or representremain-ing 2.2 million poor households) as poor households with no smoker.
Finally, to perform both descriptive and t-test analysis on poor households spending be-havior, monthly spending of such poor house-holds with and with no smoker on education, health, and other expenditures in Susenas are utilized. From total 32 groups of monthly ex-penditure of households in Susenas, this study has regrouped the expenditure into 11 groups only to simplify the analysis. The description of the eleven expenditure categories can be ob-served in Appendix 1.
3.1.2. The Determinants of Indviduals Smok-ing Decision
The subsequent analysis is to ask, if it is sig-nificance of the difference, should poor house-hold with smoker tend to have new family member to become a smoker too. To answer this question we regress adiscrete choice model
of:
P(S)j = α+θ1educindj+θ2agej
+θ3sexj+θ4marstatj
+θ5workj+θ6loc+θ7earn(3)
P(S)j is the decision being smoker (S=1) or is
not as smoker (S=0) and each of respective in-dependence variable represent the socio-socio-economic profile of the individual. For this re-gression we will employ IFLS data.
3.2. Regressivity Analysis
3.2.1. Measuring Tax Burden Over Income Groups
There are three definitions of tax burden in the literature: accounting, welfare-based will-ingness to pay and welfare-based time incon-sistent. This study uses the the accounting definition of the tax burden and implements the formula to Indonesian Family Life Survey (IFLS) 2007 data. The IFLS data provides data set that supports for calculating the excise tax paid by individuals. It asks and records in-dividual’s quantity, total expenditure and type of cigarette consumed. For ith-quantile of
in-come group and n individuals in each quintile, we define average tax rate (ATR) or the tax burden for each quintile as:
AT Ri=
Tj is the amount of the excise tax paid by
indi-vidual j andYj is her income. In IFLS data we
use individual earnings as proxy if income. Tj
is composite tax and consists of unit tax and ad-valorem tax. Assuming that individual con-sumes only single cigarette type, we therefore define Tj as:
Tj =sQj+aEj (5)
s is the specific tax rate of cigarette per stick, a is the ad-valorem tax rate of cigarette andQj
and Ej are sticks consumed and total
3.2.2. Change in Regressivity from Tax Inrease More importantly, the analysis of regressiv-ity should be followed by observing tax increase and its impact on the structure of the tax bur-den among income groups. In order to perform the analysis we need to estimate the consump-tion response from price change and real in-come change due to increase of tax. The esti-mation of own-price and income elasticities will be performed using single equation model used by Lee et al. (2004) on the cigarette consump-tion in Taiwan:
lnqit=α0+β1lnpit+β2lnincit+uit (6)
Where q is weekly average number of stick consumed, p is real1
imputed price (total ex-penditure/sticks consumed) in a week and inc is average weekly income. Subscript i = 1, ..,1855 and t= 1997,2000,2007 are indexes for individual respondents and wave(year) of the IFLS respectively. We implement the estimation to IFLS2(1997), IFLS3(2000) and IFLS4(2007) data. Thus, we expect the that
β1 <0 andβ2 >0 assuming that cigarette is a normal good.
3.3. Economic Wide Impact Analysis of Sim-plification of Cigarette Taxation
Computable General Equilibrium (CGE) model is employed to analyze the wide-impact of simplification of cigarette taxation on gov-ernment revenue, employment and tobacco sec-tor. A CGE model is a system of non-linear simultaneous equations that represents the be-havior of all economic agents and market clear-ing condition of goods and services in the econ-omy. Those equations can be grouped into five main blocks, hence:
1. Production block: Equations in this block represent the behavior of producers and the structure of production activities.
1
We use corresponding Consumer Price Indices (CPI) to deflate the imputed price for each year.
2. Consumption block: Equations in this block represent the consumption behavior of households and other institutions. 3. Export-import block: Equations in this
block represent the decision to export or import goods and services.
4. Investment block: Equations in this block represent the decision to conduct invest-ment and the demand of goods and ser-vices that will be utilized in the formation of new capital.
5. Market-clearing block: Equations in this block represent market-clearing condition in the labor market, commodity market and balance of payment.
We used Indonesian Social Accounting Ma-trix (SAM) as the main database for our CGE model. SAM is a double entry of traditional economic accounting, shaped partition matrix2
that records all economic transactions between agents, particularly among the sectors in the production block, institutions blocks (includ-ing households, firms and government), and in the sectors of production factors (Pyatt and Round, 1979; Sadoulet and de Janvry, 1995; Hartono and Resosudarmo, 1998). SAM is a good database for CGE model because of two reasons. First, SAM summarizes all economic transactions in the economy for a single pe-riod of time. Thus, SAM provides a compre-hensive overview of countrys or regions econ-omy. Second, SAM records the socio-economic structures of an economy. Therefore, SAM is also able to picture income distribution and poverty.
In this study, we modified Indonesian SAM that is published by Central Bureau Statistics of Indonesia in 2008. There are two main differ-ences between published Indonesian SAM and our modified Indonesian SAM. First, we disag-gregated classification of sectors by introduc-ing four tobacco sub-sectors, namely machine
2
made cigarette (SKM), medium-large hand-rolled kreteks (SKTMB), small hand-hand-rolled kreteks (SKTK), and other tobacco products. Second, we aggregated groups of household from 8 (eight) classifications into one classifica-tion. We did not use the original eight classifi-cations of household since we did not have in-formation about the expenditure of each house-hold group on tobacco products.
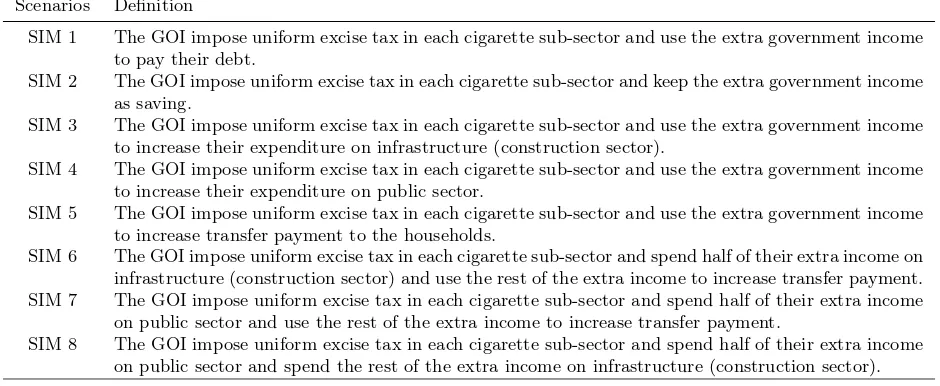
We conducted 8 (eight) scenarios in order to capture policy options that can be imple-mented by the Government of Indonesia (GOI). In those scenarios, we assume that the Govern-ment of Indonesia impleGovern-ments uniform excise tax in each cigarette sub-sector3
. Currently, the excise tax rates on cigarette product vary based on the type of product/sector, total pro-duction, and the range of retail price. Conse-quently, government income will increase, and the GOI has some options to use the extra in-come. The GOI can use the money to pay their debt or keep it as saving. Furthermore, the GOI can also increase their expenditure on infrastructure, public sector, or even increase transfer payment to the households. Other possibilities are the combination between sce-narios. For instance, the GOI can spend half of their extra income on public sector and use the rest of the extra income to increase transfer payment. Table 1 shows eight scenarios that are used in this study.
4. Result and Analysis
4.1. Household Comparison Analysis
4.1.1. Descriptive Analysis & T-test Analysis Smoking behavior is hard to cease due to the addictive substance in cigarettes. From the 2010 Demographic Institute FEUI (LD-FEUI)
3
Technically, we set the excise tax rate at the high-est rate in each cigarette sub-sector. The excise tax rate for machine made cigarette (SKM), medium-large rolled kreteks (SKTMB), and and small hand-rolled kreteks (SKTK) are Rp. 365 per piece, Rp. 255 per piece, and Rp. 100 per piece respectively.
survey to individual smokers in Central Java and East Java, smokers buy, on average, 12 sticks of cigarette (or for most cigarette prod-ucts it is equivalent to one pack of cigarette) every day. The survey also reveals that more than 60 per cent of the total samples buy 12 and even more sticks of cigarette per day. The behavior seems to be not different whether the smoker is poor. From the same survey, it shows that while the poor smokers buy 10 sticks of cigarette per day, on average, the non-poor smokers buy at least 12 sticks per day. The inelastic nature of the price elasticity of de-mand for cigarette (as has been summarized from many studies by Barber S., et al. in 2008) further indicates that as long as the increased price is still affordable, smokers will continue smoking. The smokers may also still substi-tute the cheaper cigarette product for the more expensive one, even if it results in more risk for their health. Another negative impact from smoking behavior may arise when it affects con-sumption pattern of a household. The smoking household may sacrifice their spending on more essential expenditures such as basic foods, ed-ucation, and health to preserve their smoking behavior.
Table 1: Scenarios in the CGE model Scenarios Definition
SIM 1 The GOI impose uniform excise tax in each cigarette sub-sector and use the extra government income to pay their debt.
SIM 2 The GOI impose uniform excise tax in each cigarette sub-sector and keep the extra government income as saving.
SIM 3 The GOI impose uniform excise tax in each cigarette sub-sector and use the extra government income to increase their expenditure on infrastructure (construction sector).
SIM 4 The GOI impose uniform excise tax in each cigarette sub-sector and use the extra government income to increase their expenditure on public sector.
SIM 5 The GOI impose uniform excise tax in each cigarette sub-sector and use the extra government income to increase transfer payment to the households.
SIM 6 The GOI impose uniform excise tax in each cigarette sub-sector and spend half of their extra income on infrastructure (construction sector) and use the rest of the extra income to increase transfer payment. SIM 7 The GOI impose uniform excise tax in each cigarette sub-sector and spend half of their extra income
on public sector and use the rest of the extra income to increase transfer payment.
SIM 8 The GOI impose uniform excise tax in each cigarette sub-sector and spend half of their extra income on public sector and spend the rest of the extra income on infrastructure (construction sector).
Table 2: Consumption Priority of Household Group with and without Smoker in Indonesia, 2010 (in percentage and value)
Expenditure Group of smoking households Group of non smoking households
Rp % Rp %
1 Housing 410,416 32,46 487,678 35,56
2 Other non food 193,479 15,3 211,343 15,37
3 Education 142,607 11,29 198,198 14,41
4 Transportation 120,532 9,53 124,403 9,03
5 Other food and drink 82664 6,53 84,669 6,15
6 Clothing 72,649 5,75 70,385 5,1
7 Health 66542 5,27 83183 6,06
8 Basic food 50,207 3,97 40,306 2,93
9 Meat, fish, egg, milk 46621 3,68 44,621 3,25
10 Cigarette 44,525 3,52 0
-11 Vegetable and fruit 33,763 2,67 31,942 2,32
Total food excl, cigarette 213,254 16,87 201,537 14,66 Total non food 1,006,224 79,61 1,175,190 85,34
Consumption priority of poor households can be observed from Table 3. As the table reveals, poor households, either with or with-out smoker, put less priority on education and health spending. While they put basic food as their almost highest priority, the amount spent for education and health is just compa-rable to their cigarette spending. Moreover, cigarette spending in poor households is ap-parently higher than spending for sources of protein and vegetable and fruit. Compared to the poor household group without smoker, poor household group with smoker also spend for clothing higher than for education, and for sources of protein higher than for vegetable and fruit.
Despite the fact that consumption priority between groups of households (with and with-out smoker), entirely or just the poor ones, is relatively similar, smoking behavior may re-ally sacrifice some households essential expen-ditures. In order to find such impact, we may again use the portion of each expenditure cate-gory to total expenditure. However, since now we are concerned on the individual behavior of households, the percentage number of each expenditure category is obtained by averaging the monthly expenditure proportion of all in-dividual households.
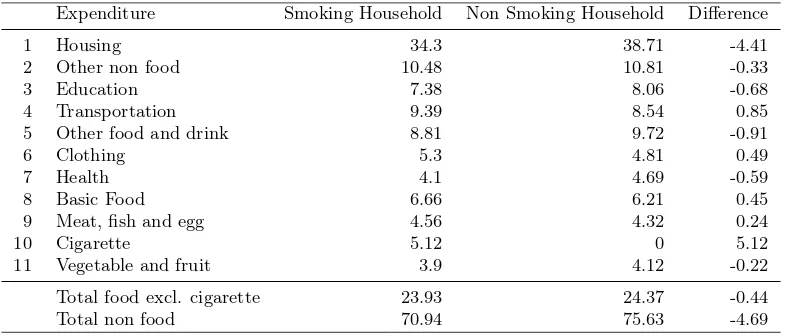
From Table4, the general pattern in Indone-sia shows that smoking behavior tends to sacri-fice households spending on such non-food ex-penditures as housing, other non food, educa-tion, and health. Portions of such expenditures in smoking households, on average, are rela-tively lower than those in non-smoking house-holds.
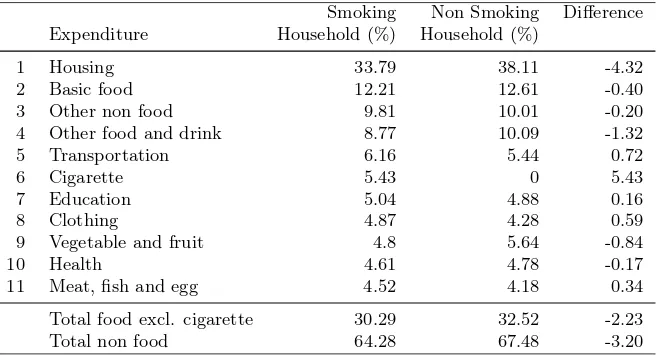
The impact is even bigger for poor house-holds. As can be seen in Table 5, poor smok-ing households in general spend less than poor non-smoking households in both food (with-out cigarette) and non-food expenditure cat-egories. Spending for cigarette not only sacri-fices spending on housing, other non food, and health, but also on basic food, other food and
drink, and vegetable and fruit.
The finding above is further confirmed by the resulting two samples T-test. By compar-ing the portion mean of each expenditure cate-gory in smoking and non-smoking households, the result (presented in Table 6) shows that only portion of education spending that is sta-tistically insignificant. Therefore, even though from the figure before the average portion of education spending by poor smoking house-holds is bigger, statistically it has no difference. 4.1.2. The Determinants of Individuals
Smok-ing Decision
Although smoking behavior statistically has no significant impact on education spending for poor households, attention still needs to be paid. As has been shown in Table 3, poor households allocation for education is relatively low and even comparable with the amount spent for buying cigarette. With small alloca-tion for educaalloca-tion, children in poor households with smoker are more likely to attain lower edu-cation level. The condition may result in an in-creased probability of them smoking when they grow up.
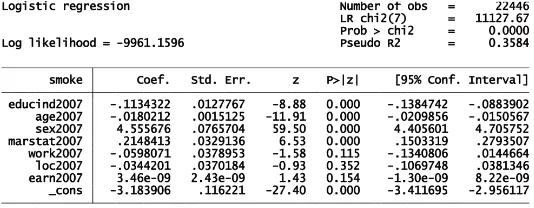
The negative correlation between education level attainment and smoking probability of individual has been tested by Ahsan and To-bing (2008) and Terblance (2012). Using lo-gistic regression method, this study also tries to find the correlation. The IEFLS data 2007 has been used in the regression. As dependent variable we used smoke variable, the dummy showing the individuals decision to smoke or not, with 1 and 0 indicate decision to smoke and not smoke respectively. As the indepen-dent variables, we chose education level at-tainment (educind2007), age (age2007), gen-der (sex2007), marriage status (marstat2007), working status (work2007), resident location (loc2007), and individual earning per month (earn2007).
Table 3: Consumption Priority of Poor Household Group with and without Smoker in Indonesia, 2010 (in percentage and value)
Expenditure Group of smoking households Group of non smoking households
Rp % Rp %
1 Housing 155,860 32.78 143,126 36.54
2 Basic food 51,251 10.8 43,075 11
3 Other non food 48,843 10.28 40,111 10.24
4 Other food and drink 37,589 7.9 34,302 8.75
5 Transportation 34,053 7.15 26,718 6.82
6 Clothing 29,009 6.09 23,659 6.04
7 Education 28,077 5.9 23,959 6.12
8 Health 26,518 5.57 21,584 5.51
9 Cigarette 23,479 4.93 -
-10 Meat, fish, egg, milk 20,982 4.41 16,085 4.1 11 Vegetable and fruit 20,326 4.27 19,086 4.87
Total food excl. cigarette 130,148 27.34 112,549 28.75
Total non food 322,359 67.72 279,156 71.25
Source: Susenas 2010, processed
Table 4: Impacts of Cigarette Spending on Households Spending Pattern in Indonesia, 2010 (in Percentage and Point Percentage)
Expenditure Smoking Household Non Smoking Household Difference
1 Housing 34.3 38.71 -4.41
2 Other non food 10.48 10.81 -0.33
3 Education 7.38 8.06 -0.68
4 Transportation 9.39 8.54 0.85
5 Other food and drink 8.81 9.72 -0.91
6 Clothing 5.3 4.81 0.49
7 Health 4.1 4.69 -0.59
8 Basic Food 6.66 6.21 0.45
9 Meat, fish and egg 4.56 4.32 0.24
10 Cigarette 5.12 0 5.12
11 Vegetable and fruit 3.9 4.12 -0.22
Total food excl. cigarette 23.93 24.37 -0.44
Total non food 70.94 75.63 -4.69
Table 5: Impacts of Cigarette Spending on Poor Households Spending Pattern in Indonesia, 2010 (in Percentage and Point Percentage)
Smoking Non Smoking Difference Expenditure Household (%) Household (%)
1 Housing 33.79 38.11 -4.32
2 Basic food 12.21 12.61 -0.40
3 Other non food 9.81 10.01 -0.20
4 Other food and drink 8.77 10.09 -1.32
5 Transportation 6.16 5.44 0.72
6 Cigarette 5.43 0 5.43
7 Education 5.04 4.88 0.16
8 Clothing 4.87 4.28 0.59
9 Vegetable and fruit 4.8 5.64 -0.84
10 Health 4.61 4.78 -0.17
11 Meat, fish and egg 4.52 4.18 0.34
Total food excl. cigarette 30.29 32.52 -2.23
Total non food 64.28 67.48 -3.20
Source: Susenas 2010, processed
in affecting individuals decision to smoke or not. With the signs of coefficient found, we can interpret that probability of individual for smoking is higher with lower education attain-ment and lower age and if the individual is male and has or had married. The other variables in the model, which are working status (working or not working), resident location (rural or ur-ban), and individual earning, statistically have no significant effect on individuals smoking de-cision. The odd ratio number of 0.89 (cer-tainly less than 1) found for education variable in the same table, further indicates that indi-vidual who attains a certain level of education will have less probability to smoke, that is 0.89 times, than individual whose education attain-ment is one level lower.
Therefore, the logistic regression test con-ducted in this study also confirms the nega-tive correlation between education level attain-ment and individuals decision to smoke as has been found by Ahsan and Tobing (2008) and Terblance (2012). As a result, a vicious cycle from the smoking behavior in poor households is most likely to continue unless certain action is made to encourage the current smokers in those poor households to quit smoking.
4.2. Regressivity Analysis
This section attempts to answer the first question of this study, whether the current ex-cise tax on cigarette regresive or not. The first part of this section will describe the distribu-tion of cigarette taxadistribu-tion with respect to brand, class of excise tax and income group. Then it followed by analysis of the result computing the regressivity of tax burden over income group using IFLS data.
4.2.1. IFLS Data
The Indonesia Family Life Survey is a con-tinuing longitudinal socioeconomic and health survey. It is based on a sample of households representing about 83% of the Indonesian pop-ulation living in 13 of the nation’s 26 provinces in 1993. The survey collects data on individual respondents, their families, their households, the communities in which they live, and the health and education facilities they use. In this study, we use IFLS4 or the wave of the year 2007 because of the avaibility of key vari-ables for computing tax burden.4
In particular,
4
Table 6: Mean Comparison of Portion of Expenditures between Poor Households with and without Smoker Using T-Test
Expenditure T-test Sign
1 Basic food significant -2 Meat, fish and egg significant + 3 Vegetable and fruit significant -4 Other food and drink significant
-5 Housing significant
-6 Health significant
-7 Education not significant 0 8 Transportation significant + 9 Clothing significant + 10 Other non food significant
-Total food excl. cigarette significant -Total nn food significant
-Source: Susenas 2010, processed. (+) means smoking HHs allocate spending more than non-smoking HHs. (-) means smoking HHs allocate spending less than non-smoking HHs.
Figure 1: Logistic Regression on Determinants of Individuals Decision to Smoke
the section ”3B-Smoking” of the data publica-tion has quespublica-tions on smoking behaviour that includes amount spent, number of stick, and type of cigarette smoked. This is only found in wave 2007 and not in earlier wave, so that it provides possibility to extract the Indonesia’s cigarette tax burden and furthermore to ana-lyze its regressivity in IFLS4.
The sample size extracted for the analysis consists of 4095 individuals that have non-zero spending on tobacco product. The ages are varying between 15-83 years old. Among these individuals, 74% are the head of the household and the remaining are family members.
To compute the tax burden in the IFLS, we
University of Gadjah Mada and Survey METRE.
Figure 2: Odds Ratio of Logistic Regression on Determinants of Individuals Decision to Smoke
10 brands and then distributed into 4 class of excise tax: SKM I, SKM II, SPM I and SKT I5
. Table7 describes the pair and its shares based on number of respondents for each class of tax tariff. It is clear that SKM1 and SKT1 have more various brand than the two other classes. Gudang Garam Surya and Djarum 76 Kretek are the brands with highest proportion of con-sumers in SKM1 and in SKT1 respectively.
In general, consumption tax that is measured by ATR concept, is regressive as the consump-tion is also regressive. This is because the rich tend to save and invest more of their income than the poor or the poor spend more of their income on consumption. This presumption is confirmed using IFLS4 on the share of con-sumption among deciles. Table 8 shows that the poorest idividuals in the first decile con-sume thirty times than individuals in the tenth decile.
4.2.2. Average Tax Burden of Cigarette Excise Tax over Income Group
To compute the tax burden for each indi-vidual in the sample, we implement equation
5
SKM stands for Sigaret Kretek Mesin, it is ma-chine produced non-filter cigarette. SPM stands for Sigaret Putih Mesin, it is machine produced with fil-ter cigarette. SKT stands forSigaret Kretek Tangan, it is hand made and non-filter cigarette. The producers scale are classified into groups, where I refers to pro-duction more than 2 billion sticks per year, II refers to production more than 500 million sticks and less than or equal to 2 billion sticks per year, III refers to production less than 500 million sticks per year.
1 to IFLS4 data. First we compute the im-puted price (expenditure/sticks) of cigarette consumed by each decile to show wheter the price effect makes the regressivity pattern. The second column of Table 5 shows the result. It is shown that indeed the second decile has the lowest price rather than the first decile as expected. However, there is no clear pat-tern of increasing of imputed price over deciles as in general case. On the other hand, the sticks clearly justifies the increasing pattern over deciles, where the first decile consumes only half than the tenth decile in average.
In 2007 there are two types of tax levied to cigarette, the specific tax and the ad-valorem tax. We compute the specific tax as the rate times the number stick consumed and the ad-valorem tax as the rate times the total expen-diture in a month. The estimated value are presented in sixth and seventh column of Table
9. It is increasing over deciles and arguably it is caused by increasing pattern of consumption level (sticks) rather than price. This can be shown as the comparisons between the first and tenth decile in terms of specific, ad-valorem and total tax expenditure show exactly the same figure as the sticks, the first decile consumes only half than the tenth decile in average. The Tax Burden
Ta-Table 7: The Distribution of Sample over Brand in Each Taxation Class(%)
No Brand SKM1 SKM2 SPM1 SKT1
1 Gudang Garam Merah - - - 17
Total 100 100 100 100
Note: The % is computed by share of individual to total number of respondents (4,095 individuals).
Table 8: Cigarette Expenditure as Proportion of Earning per Month by Decile
Decile Average Min. Max. 1 0.31 0.012 6.40 10 0.01 0.000 0.28
ble9 shows the static figure of computation of ATR based on equation (1). It is conclusive to record that the tax stucture is regressive. The ATR for lowest income group is 25 times higher than the highest income group and the pat-tern are precisely declining from the lowest to highest income groups. The static figure tells us that the existing (2007) cigarette tax bur-den puts more burbur-den for lowest income than higher incomes.
The previous analysis tells us that at level, the tax burden is increasing over income group. However, if we measure it using ATR concept, in which we put the weight of relative income, the tendency of increasing pattern is no longer maintained, indeed the tax burden is regres-sive. This situation can be interpreted as fol-lows, the richer have higher level of cigarette
consumptions. However, the proportion of the total expenditure of cigarette consumption rel-ative to their income is smaller than the poorer income group.
Secondly, the research question being ad-dressed in this paper is the dynamic effect of any tax increase based on equation (3). Specif-ically we want to know the values ofβ1for each income group. To obtain the result we estimate equation 3 using PLS based on Chow-test. The last two column of Table 9 shows the econo-metric result. It explains the effect of any fu-ture increase of tax to the regressivity. Borren and Sutton (1992) and Towsend (1987) suggest that if we do not find decreasing price elasticity (from lower to higher income group), any fur-ther increase of tax is a regressive policy. The 11th column of Table 9 shows no tendency of decreasing price elasticy, thus we might draw the same conclusion, any tax cigarette tax in-crease in Indonesia is a regressive policy.
In addition, if we look at the price and in-come elasticities obtained from the estimation of equation (3), both shows inelastic demand of price and income. The most sensitive group with respect to change in consumption is the middle income groups (i.e. 5th, 6th, and 9th
deciles). Whereas, the poorest (1st decile) and
the richest (10th decile) only have sensitivity
Nas
ru
d
in
et
al
./T
ob
ac
co
E
con
om
ic
of
In
d
on
es
ia:
..
.
Table 9: Summary of Excise Tax Regressivity Using IFLS (Average Measures)
Deciles Price Sticks Expenditure of cigarette Monthly income Specific tax Ad-valorem tax Tax Expenditure Tax Burden Price Income (Rp) (Rp/month) (Rp) (Rp) (Rp) (Rp) (% of income) elasticity elasticity
be responded heavily by the middle income groups.
4.3. Economic Impact of Simplification of Cigarette Taxation
As we previously mentioned in the introduc-tion, the main objective of the study is to eval-uate certain aspects of cigarette taxation in Indonesia. The first aspect that we observed is the cigarette tax regressivity. We already showed that the cigarette excise tax in Indone-sia is regressive in Section 4.1. It means that the policy to increase the cigarette tax may re-sult higher cost on poor households relative to rich households. Moreover, the addictiveness of nicotine may force poor households to re-duce their spending on non-cigarette products. Thus, the policy to increase the cigarette tax can harm the poor instead of helping them. However, in macro and economy wide impact perspective, we might collect some opposite im-pacts (gain) of tax increase policy.
In this section we present a CGE model’s cal-culation to capture the economy-wide impacts of a tax increase (a simplification) to take into account overal impacts in addition to distribu-tive consideration in the regressivity analysis and poor household spending comparison anal-ysis.
As we mentioned in the previous s, we em-ploy CGE model in order to estimate the im-pact of the simplification of cigarette taxa-tion. Our CGE model is based on Indonesian SAM which provides a comprehensive overview of Indonesian economy and records Indonesian socio-economic structures. Thus, the linkages across economic agent, production factors and sectors have been taken into account in the cal-culation. In this study, we emphasize our anal-ysis on three macroeconomic indicators, sec-toral output and secsec-toral employment. All scenarios represent the policy option that can be implemented by the government in order to utilize extra income from simplification of cigarette taxation. Therefore, all scenarios are comparable one to another.
In general, simplification of cigarette taxa-tion has a negative impact on nataxa-tional out-put. However, the impact is relatively small in magnitude. Simplification of cigarette taxa-tion (which is followed by eight alternatives in order to utilize the extra income) is expected to lower national output by minus 0.034 percent to minus 0.045 percent. SIM 1 has the largest negative impact on national output as much as minus 0.045 percent. If the GOI use the extra income to pay their debt to other coun-try, the government will lose an opportunity to optimize the utilization of the extra income in the domestic economy. However, we did not take into account the impact of debt payment on temporal structure of Indonesian national budget. Indeed, debt payment in period t will reduce the burden of Indonesian national bud-get in period t+1. In this case, the GOI will have more flexibility to restructure their na-tional budget in period t+1. In the first sce-nario (SIM 1), we only assumed that the GOI receive higher government income. Then, the GOI transfer the extra income abroad as debt payment. Therefore, SIM 1 is similar with the idea of ”doing nothing” policy. The GOI can also keep the extra income as saving (SIM 2). This scenario will result negative impact on na-tional output approximately minus 0.038 per-cent.
ex-tra income on infrastructure and use the rest of the extra income to increase transfer pay-ment (SIM 6) is relatively better than other two mixed scenarios.
Even though the simplification of cigarette taxation has a negative impact on national out-put, government consumption is expected to increase as the government receives more in-come. SIM 3 results the largest positive impact on government consumption, whereas SIM 1 has the smallest positive impact. Government consumption is expected to increase by 4.2 per-cent if the GOI implement uniform excise tax in each cigarette sub-sector and spend the ex-tra income on infrastructure. SIM 4 also has a relatively large positive impact on government consumption as much as 4.0 percent. Increas-ing the transfer payment (SIM 5) is estimated to lower positive impact on government con-sumption relative to SIM 3 and SIM 4. How-ever, the magnitude is still substantially larger than the policy option to keep the extra in-come as saving or to send it abroad. Among the mixed scenarios, SIM 8 has relatively larger positive impact on government consumption. The impact is even the second largest impact on government consumption after SIM 3.
Table 10 also suggests that simplification of cigarette taxation is expected to drop house-hold income. Without transfer payment pol-icy, the negative impact on household income is larger than -0.13 percent. For instance, SIM 3 (which is preferable in the previous analy-sis) results 0.14 percent drop in household in-come. Furthermore, if the GOI implement uni-form cigarette excise tax and transfer the ex-tra income abroad as debt payment, household income decrease up to 0.2 percent lower than the baseline. It is the largest negative impact relative to other seven scenarios. In contrast, SIM 5 almost has no impact on household in-come. The impact of SIM 5 is extremely small in magnitude as much as -0.006 percent.
To sum up, all scenarios have negative im-pacts both on national output and household
income. Meanwhile, government consumption is expected to increase in all scenarios. SIM 1 is less preferable than other seven scenarios because it has the largest negative impact on both national output and household income. The first scenario also has the smallest posi-tive impact on government consumption. SIM 3 seems to be superior in terms of its impact on national output and government consumption. However, SIM 3 has a relatively large negative impact on household income. In order to lower the impact on household income, the GOI can implement mixed policy between infrastructure spending and transfer payment through SIM 6. SIM 6 has 0.0006 percent larger negative im-pact on national output, 0.89 percent smaller positive impact on government consumption, and 0.063 percent smaller negative impact on household income relative to SIM 3. Moreover, if the GOI focus more on the impact on house-hold income, SIM 5 can be chosen. It has the smallest negative (even almost zero) impact on household income, and its negative impact on national output is 0.0012 percent larger than relative to SIM 3.
The combination between lower household income and the higher price of cigarette prod-ucts due to the simplification of cigarette tax-ation may hurt the poor households. Unfortu-nately, the model is not able to show the impact on household income across group of house-holds due to data limitation. Nevertheless, the CGE results show that the impact of the sim-plification of cigarette taxation on household income is small in magnitude. Furthermore, the negative impacts is expected to be much lower if the GOI use the extra income to finance higher government expenditure (even though the positive impact of higher government ex-penditure will not fully compensate the neg-ative impact). Thus, we can argue that the impact of the simplification of cigarette taxa-tion on poor households is indeed negative but not severe.
Table 10: The Impact of Each Scenario on Macro Indicators (%) Scenario National Output Government Consumption Household Income
SIM 1 -0.04 0.66 -0.20
SIM 2 -0.04 0.71 -0.18
SIM 3 -0.03 4.21 -0.14
SIM 4 -0.04 4.03 -0.12
SIM 5 -0.04 2.41 -0.01
SIM 6 -0.04 3.31 -0.07
SIM 7 -0.04 3.22 -0.06
SIM 8 -0.04 4.12 -0.13
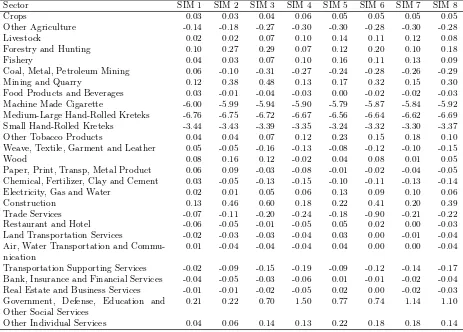
Table 11: The Impact of Each Scenario on Sectoral Output(%)
Sector SIM 1 SIM 2 SIM 3 SIM 4 SIM 5 SIM 6 SIM 7 SIM 8
Crops 0.03 0.03 0.04 0.06 0.05 0.05 0.05 0.05
Other Agriculture -0.14 -0.18 -0.27 -0.30 -0.30 -0.28 -0.30 -0.28
Livestock 0.02 0.02 0.07 0.10 0.14 0.11 0.12 0.08
Forestry and Hunting 0.10 0.27 0.29 0.07 0.12 0.20 0.10 0.18
Fishery 0.04 0.03 0.07 0.10 0.16 0.11 0.13 0.09
Coal, Metal, Petroleum Mining 0.06 -0.10 -0.31 -0.27 -0.24 -0.28 -0.26 -0.29 Mining and Quarry 0.12 0.38 0.48 0.13 0.17 0.32 0.15 0.30 Food Products and Beverages 0.03 -0.01 -0.04 -0.03 0.00 -0.02 -0.02 -0.03 Machine Made Cigarette -6.00 -5.99 -5.94 -5.90 -5.79 -5.87 -5.84 -5.92 Medium-Large Hand-Rolled Kreteks -6.76 -6.75 -6.72 -6.67 -6.56 -6.64 -6.62 -6.69 Small Hand-Rolled Kreteks -3.44 -3.43 -3.39 -3.35 -3.24 -3.32 -3.30 -3.37 Other Tobacco Products 0.04 0.04 0.07 0.12 0.23 0.15 0.18 0.10 Weave, Textile, Garment and Leather 0.05 -0.05 -0.16 -0.13 -0.08 -0.12 -0.10 -0.15
Wood 0.08 0.16 0.12 -0.02 0.04 0.08 0.01 0.05
Paper, Print, Transp, Metal Product 0.06 0.09 -0.03 -0.08 -0.01 -0.02 -0.04 -0.05 Chemical, Fertilizer, Clay and Cement 0.03 -0.05 -0.13 -0.15 -0.10 -0.11 -0.13 -0.14 Electricity, Gas and Water 0.02 0.01 0.05 0.06 0.13 0.09 0.10 0.06 Construction 0.13 0.46 0.60 0.18 0.22 0.41 0.20 0.39 Trade Services -0.07 -0.11 -0.20 -0.24 -0.18 -0.90 -0.21 -0.22 Restaurant and Hotel -0.06 -0.05 -0.01 -0.05 0.05 0.02 0.00 -0.03 Land Transportation Services -0.02 -0.03 -0.03 -0.04 0.03 0.00 -0.01 -0.04 Air, Water Transportation and
Commu-nication
0.01 -0.04 -0.04 -0.04 0.04 0.00 0.00 -0.04
Transportation Supporting Services -0.02 -0.09 -0.15 -0.19 -0.09 -0.12 -0.14 -0.17 Bank, Insurance and Financial Services -0.04 -0.05 -0.03 -0.06 0.01 -0.01 -0.02 -0.04 Real Estate and Business Services -0.01 -0.01 -0.02 -0.05 0.02 0.00 -0.02 -0.03 Government, Defense, Education and
Other Social Services
0.21 0.22 0.70 1.50 0.77 0.74 1.14 1.10
from CGE model is the impact on sectoral out-put. It is one of the advantages of CGE model in which we can show the economic wide im-pact. The results show not only the impact on tobacco sector but also other sectors by consid-ering the linkages between sectors. Generally, Medium-Large Hand-Rolled Kreteks sector ex-periences the largest negative impact in all sce-narios relative to other cigarette sub-sectors. It is also the largest negative impact among all sectors that are observed. Output of Medium-Large Hand-Rolled Kreteks sector is expected to decrease in the range of -6.56 percent to -6.76 percent. The second largest negative impact is experienced by Machine Made Cigarette sec-tor. This sector output decrease in all scenar-ios by between -5.79 percent and -6.0 percent. Small Hand-Rolled Kreteks sector experiences the smallest negative impact among the three cigarette sub-sectors. However, it is substan-tially large in magnitude if we compare with other non-cigarette sectors. The simplification of cigarette tax is expected to decrease the out-put of Small Hand-Rolled Kreteks sector by be-tween -3.24 percent and -3.44 percent.
Mining and quarry sector, most agricul-ture sectors (except ”other agriculagricul-ture” tor), construction sector, public services sec-tor, and other individual services sector are ex-pected to receive positive impact in all scenar-ios. Similarly, other tobacco product sector is expected to experience positive impact in al-most all scenarios with the percentage change between 0.04-0.23 percent. In contrast, six other sectors (other agriculture sector, electric-ity, gas and water sector, trade services sector, bank, insurance and financial services sector, real estate and business services sector, and transportation supporting sector) experience negative impact in all scenarios. Three manu-facturing sectors (food products and beverages sector; weave, textile, garment and leather sec-tor; and chemical, fertilizer, clay and cement sector) and coal, metal, petroleum mining sec-tor are expected to receive negative impact in
almost all scenarios other than SIM 1.
Table 11 shows the detailed estimated im-pact of simplification of cigarette tax on sec-toral output. SIM 1 is expected to increase all agriculture sectors (except other agriculture sector) and mining sectors. Manufacturing sec-tors (other than cigarette sub-secsec-tors) will also benefit from the policy under the first scenario. Services sectors are mostly experiencing dis-advantage due to the SIM 1 implementation. If the GOI choose to keep the extra income as saving (SIM 2), all sectors that are pre-viously experiencing negative impacts (under SIM 1) are expected to experience even worse negative impact. Five sectors (coal, metal and petroleum mining sector; food products and beverages sector; weave, textile, garment and leather sector; chemical, fertilizer, clay and cement sector; air, water transportation and communication sector) are expected to expe-rience negative impacts. Those five sectors previously gain positive impacts under SIM 1. Interestingly, other sectors that are not men-tioned above experience positive impacts even larger than under SIM 1.
more attractive (in terms of wage). Since we assume that the total number of labor in the economy is fixed, some less attractive sectors will have fewer labors. Consequently, those less attractive sectors will experience negative growth on their output. The second argument is the linkage between a sector and cigarette sub-sectors. Other agriculture sector experi-ences a negative impact in all scenarios because this sector has a strong linkage (especially for-ward linkage) with cigarette sub-sector. The most important inputs for cigarette sub-sector are tobacco and clove. Both products are pro-duced by other agriculture sector.
SIM 4 has relatively similar results to SIM 3. The impacts of both scenarios across sector have a completely identical pattern. Indeed, government, defense, education, and other so-cial services sector receive the highest positive impact as much as 1.50 percent. SIM 5 also has an almost similar impact to SIM 4 except for wood products sector, restaurant and ho-tel sector, and land transportation services sec-tor. In terms of the percentage change, the im-pacts are quite moderate across sectors. How-ever, three cigarette sub-sectors experience the smallest negative impact under SIM 5 relative to other scenarios. Moreover, other tobacco sector also experiences the largest positive im-pact. SIM 6 has an almost similar impact with SIM 3. The main differences are only on land transportation services sector, real estate and business services sector, and restaurant and ho-tel sector. Those three sectors are almost un-affected under SIM 6 since the impacts are re-ally small in magnitude. The last two scenarios (SIM 7 and SIM 8) have a completely similar impact in terms of its pattern across sectors and also the percentage changes.
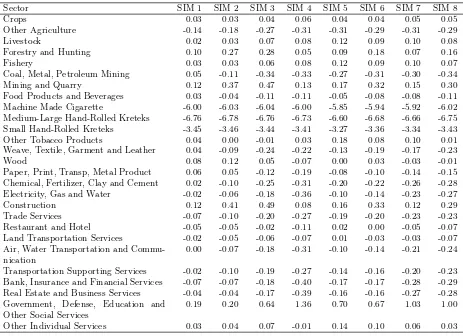
Table12shows the estimated impact of sim-plification of cigarette tax on sectoral employ-ment. In general, the impacts of simplifica-tion of cigarette tax on sectoral employment are almost similar both in pattern and magni-tude with the impacts on sectoral output. We
identify that only one sector (electricity, gas and water sector) that experience a completely different impact and five sectors that experi-ence minor differexperi-ences. The simplification of cigarette tax is expected to increase the total output of electricity, gas and water sector and decrease its employment. Why the outputs of the sector still increase even though its employ-ment decrease? In order to find the answer, we should consider the character of the sector and the magnitude of the impacts. Electricity, gas and water sector is one of the capital intensive sectors in the economy. The proportion of sec-tors expenditure on capital to total primary in-put is 87 percent. Moreover, the impact of the scenario on the sectors employment is only less than 0.27 percent. Thus, electricity, gas and water sector still experience an increase in out-put. The same argument can also be applied to explain why other tobacco products sector ex-periences negative impact on its employment but positive impact on its output under SIM 3. Four other sectors that experience the same pattern are air, water transportation and com-munication sector (under SIM 5, SIM 6, and SIM 7); bank, insurance and financial services sector (under SIM 5); real estate and business services sector (under SIM 5 and SIM 6); and other individual sector (under SIM 4).
Table 12: The Impact of Each Scenario on Sectoral Employment(%)
Sector SIM 1 SIM 2 SIM 3 SIM 4 SIM 5 SIM 6 SIM 7 SIM 8
Crops 0.03 0.03 0.04 0.06 0.04 0.04 0.05 0.05
Other Agriculture -0.14 -0.18 -0.27 -0.31 -0.31 -0.29 -0.31 -0.29
Livestock 0.02 0.03 0.07 0.08 0.12 0.09 0.10 0.08
Forestry and Hunting 0.10 0.27 0.28 0.05 0.09 0.18 0.07 0.16
Fishery 0.03 0.03 0.06 0.08 0.12 0.09 0.10 0.07
Coal, Metal, Petroleum Mining 0.05 -0.11 -0.34 -0.33 -0.27 -0.31 -0.30 -0.34 Mining and Quarry 0.12 0.37 0.47 0.13 0.17 0.32 0.15 0.30 Food Products and Beverages 0.03 -0.04 -0.11 -0.11 -0.05 -0.08 -0.08 -0.11 Machine Made Cigarette -6.00 -6.03 -6.04 -6.00 -5.85 -5.94 -5.92 -6.02 Medium-Large Hand-Rolled Kreteks -6.76 -6.78 -6.76 -6.73 -6.60 -6.68 -6.66 -6.75 Small Hand-Rolled Kreteks -3.45 -3.46 -3.44 -3.41 -3.27 -3.36 -3.34 -3.43 Other Tobacco Products 0.04 0.00 -0.01 0.03 0.18 0.08 0.10 0.01 Weave, Textile, Garment and Leather 0.04 -0.09 -0.24 -0.22 -0.13 -0.19 -0.17 -0.23
Wood 0.08 0.12 0.05 -0.07 0.00 0.03 -0.03 -0.01
Paper, Print, Transp, Metal Product 0.06 0.05 -0.12 -0.19 -0.08 -0.10 -0.14 -0.15 Chemical, Fertilizer, Clay and Cement 0.02 -0.10 -0.25 -0.31 -0.20 -0.22 -0.26 -0.28 Electricity, Gas and Water -0.02 -0.06 -0.18 -0.36 -0.10 -0.14 -0.23 -0.27 Construction 0.12 0.41 0.49 0.08 0.16 0.33 0.12 0.29 Trade Services -0.07 -0.10 -0.20 -0.27 -0.19 -0.20 -0.23 -0.23 Restaurant and Hotel -0.05 -0.05 -0.02 -0.11 0.02 0.00 -0.05 -0.07 Land Transportation Services -0.02 -0.05 -0.06 -0.07 0.01 -0.03 -0.03 -0.07 Air, Water Transportation and
Commu-nication
0.00 -0.07 -0.18 -0.31 -0.10 -0.14 -0.21 -0.24
Transportation Supporting Services -0.02 -0.10 -0.19 -0.27 -0.14 -0.16 -0.20 -0.23 Bank, Insurance and Financial Services -0.07 -0.07 -0.18 -0.40 -0.17 -0.17 -0.28 -0.29 Real Estate and Business Services -0.04 -0.04 -0.17 -0.39 -0.16 -0.16 -0.27 -0.28 Government, Defense, Education and
Other Social Services
0.19 0.20 0.64 1.36 0.70 0.67 1.03 1.00
applicable for electricity, gas and water sector. In the upstream sector of the tobacco sectors, employment in restaurant and hotel sector is expected to decrease by between -0.02 to -0.36 percent.
5. Concluding Remarks
This paper has three main objectives related to cigarette excise taxation in Indonesia. The first is to test the difference of poor household’s spending with and without smoker. The sec-ond objective is to test the validity of regressive tax burden of cigarette excise taxation. The first objective is related to second objective in terms of consequences of increasing cigarette tax to poor households in terms of essential spendings. If the tax burden is regressive, it means that any tax increase will put more bur-den to the poorer and considering the nature of addictive substance of cigarette, the poorer will tend to sacrifies essential spendings such as health and education. However, tobacco prod-uct is more likely depend on many sectors as well as other sectors depend on cigarette sector. Therefore, the third objective is to capture all macro effect of an increase of cigarette excise tax and it include total output, employment, government consumption and sectoral impacts. We complete the analysis using a CGE model based on decomposed Indonesian’s SAM sec-tors using cigarette secsec-tors.
Regarding the first queries, this paper finds the statistically significant of the difference (lower) between household with and without smokers on their essential spending includ-ing basic food and health, but not educa-tion. This finding magnifies the negative im-pacts of cigarette tax increase policy. Tax in-crease is not only puts more burden to them, but also harms their essential spendings. The second queries find that the current Indone-sian cigarette excise tax is regressive and any increase of cigarette tax is a regressive pol-icy. The welfare consequences for poor smok-ers is clear, any increase in taxation will put
more burden on poorer people rather than the richer. Lastly, the computable general equi-librium models the scenarios of cigarette ex-cise tax increase shows a not severe decrease of national output, sectoral output and house-hold income and employment. In addition, it gives government higher consumption depend-ing the way additional revenue from tax in-crease is allocated. The alloacation of infras-tructure sector has the highest impacts on gov-ernment spending.
To sump up, the findings of this paper sug-gest two important policy recommendations. In order to implement excise tax increase pol-icy, the government needs to address seriously the distibutive policy such that the poorer in-come group obtain enough compensation to maintain their essential spending that harmed by the policy. This action, also in same re-sult can be obatined by making a specific and targetted (i.e. incentives policy) to make the poorer with smokers to quit. Secondly, on the macro ground, measured by government con-sumption and household income, it is better for the government to spend additional rev-enue from cigarette tax increase on infrastuc-ture (construction sector).
6. References
[1] Ahsan, A., Wiyono, N., and Setyonaluri, D. Il-licit Cigarettes in Indonesia. Demographic Insti-tute FEUI & Duke-SEATCA; 2010
[2] Ahsan, A. and Tobing, M.H.L. Study of the Im-pact of Tobacco Consumption Among the Poor in Indonesia. Demographic Institute FEUI; 2008 [3] Ahsan , A. and Wiyono, N. An Analysis of the
Impact of Higher Cigarette Prices on Employment in Indonesia. SEATCA; December 2007
[4] Barbara S. et al. Tobacco Economics in Indone-sia. Paris: International Union Against Tubercolo-sis and Lung Decease; 2008
[5] Borren, P. and Sutton, M. Are Increases in Cigarette Taxation Pregressive? Health Eco-nomics, Vol. 1; 1992, pp. 245-253
[6] Chernick, H. and Reschovsky, A. Yes! Consump-tion Taxes Are Regressive. Challenge, Vol. 43, No.5; September/October 2000, pp. 60-91 [7] Djutaharta, T. et al. Aggregate Analysis of the
Consumption and Government Revenue: the Case of Indonesia. Health, Nutrition and Population (HNP): Economics of Tobacco Control Paper, No. 25; January 2005
[8] Hartono, D., Resosudarmo, B.P., Eksistensi ma-triks pengganda dan dekomposisi mama-triks peng-ganda Pyatt dan Round dari sistem neraca sosial ekonomi. Ekonomi dan Keuangan Indonesia 46 (4), 473496, 1998
[9] Lee, Jie-Min, et al. The effect of cigarette price in-crease on the cigarette consumption in Taiwan: ev-idence from the National Health Interview Surveys on cigarette consumption, BMC Public Health, 4(61); 2004
[10] Pyatt, G. and Round, J., Accounting and fixed price multipliers in a social accounting matrix framework. Economic Journal 89: 850873, 1979 [11] Remler, D.K. Poor Smokers, Poor Quitters, and
Cigarette Tax Regressivity. American Journal of Public Health, Vol.94, No.2; February 2004, pp. 225-229
[12] Sadoulet, E., de Janvry, A., Quantitative Devel-opment Policy Analysis. Johns Hopkins University Press, Baltimore, 1995
[13] Stiglitz, J. Economics of the Public Sector. 3rd ed. New York, NY: W.W. Norton & Co; 2000 [14] Tamaoka, M. The Regressivity of a Value Added
Tax: Tax Credit Method and Subtraction Method a Japanese Case. Fiscal Studies, Vol. 15, No.2; May 1994
[15] Terblanche, T. The Opportunity Cost of Tobacco in South Africa. University of Cape Town: Unpub-lished; 2012