with Schizophrenia: Relationship to Psychosis,
Neuroleptics, and Cerebellar Neural Circuitry
Peg C. Nopoulos, John W. Ceilley, Elizabeth A. Gailis, and Nancy C. Andreasen
Background: The midbrain contains the perikarya of all
the dopamine neurons in the human brain. Although other
neurochemicals may well be involved, dopamine
dysregu-lation is central in the pathophysiology of psychosis.
Despite this, few imaging studies have evaluated the
morphology of the midbrain.
Methods: Using high-resolution magnetic resonance
im-aging, morphology of three posterior fossa and brain stem
structures were measured: midbrain, pons, and medulla.
The patient sample consisted of 50 men with
schizophre-nia, matched by gender and age to 50 healthy control
subjects.
Results: Patients had significantly smaller midbrain
mea-sures compared with control subjects. There were no
differences between groups in measures of pons or
me-dulla. Furthermore, midbrain size was significantly and
inversely correlated with positive symptoms and
cumula-tive neuroleptic exposure, but not with negacumula-tive or
disor-ganized symptoms. After controlling for the effect of
cumulative neuroleptic exposure, the relationship between
midbrain morphology and positive symptoms remained
significant.
Conclusions: Midbrain morphology of patients with
schizophrenia is abnormal, being smaller in patients
compared with control subjects. Although this appears to
be specifically related to psychotic symptoms, there is also
a robust medication effect, with greater exposure to
neuroleptics being associated with greater morphologic
abnormality. We discuss the role of dopaminergic
dys-regulation and possible neural circuit involvement. Biol
Psychiatry 2001;49:13–19 © 2001 Society of Biological
Psychiatry
Key Words: Schizophrenia, midbrain, mesencephalon,
brain stem, magnetic resonance imaging, neuroleptics
Introduction
T
he mesencephalon or midbrain represents the smallest
and least differentiated segment of the infratentorial
brain stem. The midbrain contains the source nuclei for the
three dopaminergic systems in the human brain: the
nigrostriatal pathway, the mesolimbic pathway, and the
mesocortical pathway. Although the “dopamine
hypothe-sis” of pathophysiology in schizophrenia continues to be
modulated and expanded, there appears to be no doubt that
dopamine dysregulation plays a key role in the pathology
of psychosis. Despite this fact, there is a paucity of studies
that have evaluated the morphology of the midbrain, either
histologically or grossly in neuroimaging studies.
In regard to histopathology, the only study to date
evaluating the mesencephalon was done by Bogerts et al
(1983). On a sample of nine controls and six age-matched
brains of patients with schizophrenia who lived and died
before the advent of neuroleptics, the dopaminergic
neu-rons of the nigrostriatal and mesolimbic system were
evaluated. These researchers reported a significant
de-crease in the volume of the nigrostriatal area due to mean
volume reduction of glial nuclei. In the mesolimbic
system, the mean volume of the nerve cells was
diminished.
Neuroimaging studies evaluating the midbrain are
equally sparse. A study by Aylward et al (1994) measured
midsagittal areas of posterior fossa structures (including
midbrain) in patients with schizophrenia and healthy
control subjects. Although the midbrain was smaller in
patients, this did not reach statistical significance;
how-ever, in a case report, a 40-year-old woman was
docu-mented to have developed a syndrome consistent with the
diagnosis of schizophrenia, which was associated with a
midbrain tegmental lesion (Minabe et al 1990).
The development of the midbrain is intimately involved
with the development of the cerebellum, especially the
vermis (Hallonet and Le Douarin 1993; Hallonet et al
1990; Urbanek et al 1997; Yachnis and Rorke 1999). The
vermis of the cerebellum has been documented to be
morphologically abnormal in patients with schizophrenia
From the Mental Health Clinical Research Center, University of Iowa College of Medicine, Iowa City.
Address reprint requests to Peg Nopoulos, M.D., University of Iowa College of Medicine, Psychiatry Research, 1-180 Medical Education Building, 500 New-ton Road, Iowa City IA 52242.
Received June 6, 2000; revised August 14, 2000; accepted August 15, 2000.
© 2001 Society of Biological Psychiatry 0006-3223/01/$20.00
(Lippman et al 1982; Rossi et al 1993; Sandyk et al 1991;
Tran et al 1998; Weinberger et al 1979, 1980), including a
recent report from our group (Nopoulos et al 1999).
Although several studies have indicated that the vermis
has projections to the limbic system via the midbrain
(Snider 1975; Snider and Maiti 1976; Snider et al 1976),
no recent studies have explored the functional or structural
implications of this possible neural circuit.
Our study was designed to evaluate the morphology of
the mesencephalon using high-resolution magnetic
reso-nance imaging (MRI) in a large sample of male patients
with schizophrenia, who were matched by age and gender
to a sample of healthy control subjects. Three brain stem
structures were measured (midbrain, pons, and medulla)
with the hypothesis that abnormal morphology would be
specific to the midbrain region. In addition, given the long
history of the relationship between dopamine
dysregula-tion and psychosis, we explored the reladysregula-tionship between
midbrain morphology and three distinct “domains” of
symptoms—positive, negative, and disorganized—the
hy-pothesis being that midbrain morphology would correlate
specifically with positive or psychotic symptoms. Finally,
the morphologic relationship between the midbrain and
the cerebellar vermis was evaluated.
Methods and Materials
Subjects
The patient group consisted of 50 men, consecutive participants in the University of Iowa Mental Health Clinical Research Center (MH-CRC) protocols. Typically, these patients were either neuroleptic naive or undergo a 3-week medication wash to participate in neuroimaging studies. Each patient was diagnosed as having schizophrenia using DSM-III-R criteria and based on data obtained using the Comprehensive Assessment of Symp-toms and History (CASH) (Andreasen et al 1992b). SympSymp-toms were rated as the worst in the past month using the Scale for the Assessment of Negative Symptoms (SANS; Andreasen 1983) and Scale for the Assessment of Positive Symptoms (SAPS; Andreasen 1984) within the CASH. Summary scores for three dimensions of symptoms (positive, negative, and disorganized) were calculated using sums of global scores from the SANS/ SAPS. The positive symptom dimension was the sum of global scores for hallucinations and delusions. The negative symptom dimension score was the sum of global scores for alogia, affective flattening, avolition–apathy, and anhedonia–asociality. The disorganized symptom dimension was comprised of the morphology of the global scores of positive formal thought dis-order, disorganized or bizarre behavior, and inappropriate affect. Cognitive functioning of patients was determined by admin-istration of a battery of neuropsychologic tests, which include assessment of general intellectual functioning as determined by the WAIS-R: Full Scale IQ and the subscales of the Performance IQ and Verbal IQ. Many of the patients that were hospitalized at the time of their assessment were in the midst of a psychotic
episode. To obtain a maximally valid assessment of cognitive ability, testing was done when patients were stable enough to cooperate with testing.
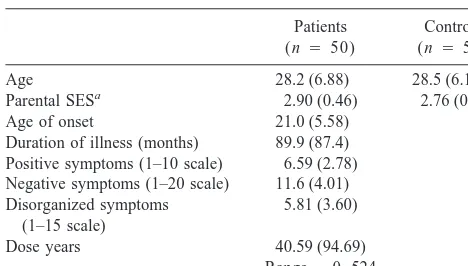
At the time of assessment, 11 of the 50 individuals were first-episode patients (defined on the basis of first psychiatric hospitalization). Average age of onset (defined in the CASH as age at which significant symptoms emerged) was 21 years, and average duration of illness was 89.9 months or 7.49 years. The “Dose Year” formula (Miller et al 1995) was used to measure neuroleptic exposure, which was calculated as cumulative dose at the time of scan. This requires conversion of neuroleptic medi-cation (typical and atypical) to chlorpromazine equivalents (Davis 1974). The older equivalents recently have been extrap-olated to atypical neuroleptics (Herz 1997). Exposure is calcu-lated over time, weighted for dose.
With regard to type of neuroleptics, the MRI scans used in this analysis were obtained from 1991 to 1994. Thus, few patients had exposure to atypical neuroleptics. We categorized patients into four groups regarding medication exposure: 1) neuroleptic naive, 2) almost neuroleptic naive, 3) typical antipsychotic exposure only, and 4) typical and atypical antipsychotic expo-sure. None of the patients had exposure to only atypical medi-cations. Of the 50 patients, five had never received neuroleptics or were “neuroleptic naive.” In addition, nine patients had minimal exposure to neuroleptics (dose-year of 0.10 or less, equivalent of less than 2 weeks on 5 mg of haloperidol per day). All of the patients in this category (“almost neuroleptic naive”) had typical neuroleptic exposure only. The largest group was comprised of those with more than minimal exposure to neuro-leptics, but exclusively typical (n532). Only four patients had exposure to atypical medication. Two of these were on clozapine, and two were taking risperidone at the time of the scan; however, in all four of these cases, patients had been taking typical neuroleptics before being placed on clozapine or risperidone. In only one of the four cases was the amount of time spent on an atypical greater than had been spent on typical antipsychotics.
The control group consisted of 50 healthy men, matched by age and gender to the patient group. These subjects were volunteers recruited from the community through newspaper advertising. Each control subject was evaluated using an abbre-viated version of the CASH. Volunteers were excluded if there was any history of psychiatric illness, including substance abuse, or a family history of schizophrenia. Patients and controls were excluded if they had a lifetime history of serious head trauma, neurologic illness, or serious medical or surgical illness.
After complete description of the study to the subjects, written informed consent was obtained. Demographics of the two study groups are shown in Table 1.
Our study group comprises a subset of the sample used in our recently published report on cerebellar vermis morphology (No-poulos et al 1999). Therefore, there are both brain stem and cerebellar vermis measures available for the entire study group.
Acquisition and Analysis of MR
256 3 192) using the coronal plane, yielding 124 contiguous slices, 1.5 mm thick.
Processing of the images after acquisition was done using a locally developed family of software programs called BRAINS (acronym for Brain Research: Analysis of Images, Networks, and Systems). Details of the image analysis are published elsewhere (Andreasen et al 1992a, 1993, 1994).
BRAIN VOLUME MEASURES. A three-dimensional data set was created, and the images were realigned and resampled at a slice thickness of 1.0 mm. At this point, a general measure of intracranial volume was obtained by totaling brain tissue and cerebrospinal fluid volumes. Regional measurements were then ascertained by transformation into Talairach Atlas space (Ta-lairach and Tournoux 1988) in which all of the boxes were assigned to specific brain regions: frontal, temporal, parietal, and occipital lobes. In addition, we adapted the method to include boxes that defined the cerebellum as well. We have developed automated measures of subregions (lobes), which were validated by comparison to manual tracings (the gold standard) and found to be an accurate measure compared with this gold standard (Andreasen et al 1994).
MEASUREMENT OF BRAIN STEM STRUCTURES. As part of the initial analysis of all brains, scans were aligned along the axis of a line connecting the anterior commissure (AC) with the posterior commissure (PC). In addition, scans were aligned with respect to the interhemispheric fissure. Area measurements were obtained using a midsagittal slice. This cut was determined as the one in which the cerebral aqueduct was most clearly visualized. Tracing of the brain stem structures was, in part, adapted from guidelines used by Aylward et al (Aylward et al 1994). The superior border of the midbrain was the floor of the cerebral aqueduct. The inferior border of the midbrain was determined by placing the cursor in the anterior landmark (pontine notch) and extending a line to the posterior wall of the brain stem that was parallel to the AC–PC line. This differed slightly from the Aylward method, in which the line was drawn to approximate a line perpendicular to the axis of the brain stem. We found the method of using the AC–PC line to be more reliable. The superior and inferior colliculi were not included in the midbrain
tracing. The lower boundary of the midbrain demarcated the upper limit of the pons. The lower limit of the pons was determined by a line drawn parallel to the AC–PC line extending from the inferior pontine notch to the posterior wall of the brain stem. This also demarcated the superior limit of the medulla. The lower border of the medulla was determined as a line drawn parallel to the AC–PC line along the lower limit of the foramen magnum. Reliability was established on a separate sample of 28 brains by two independent raters (J.C. and E.G.). Intraclass correlations were as follows: midbrain 0.957, pons 0.963, and medulla 0.786.
MEASUREMENT OF CEREBELLAR VERMIS. This method is reported in detail elsewhere (Nopoulos et al 1999). Like the brain stem measures, the cerebellar vermis was measured as an area. A midsagittal cut was defined by the slice in which the aqueduct of Sylvius was visualized most clearly. Manual traces were then made of the cerebellar vermis and its three regions. The measure of total vermis area was the sum of all three regional areas.
Statistical Analysis
Initial analysis consisted of a t test comparing the mean area measures of each brain stem region. Next, analysis of covariance (ANCOVA) was used to control for variations in brain size. No covariate is ideal. Because the cerebellum and brain stem are intimately related in development, total cerebellum volume was used as a covariate; however, we also ran the analysis several different times using other covariates including intracranial volume, total brain volume, and cerebral volume.
To evaluate relationships between brain stem region of interest size and clinical correlates, correlations were calculated. When the measures were normally distributed, Pearson’s correlations were done; when any of the measures in the analysis were not normally distributed, nonparametric Spearman’s correlations were used.
Results
Table 2 shows the results of the t tests and ANCOVA
(using total cerebellar volume as a covariate) on brain
stem measures. The t test analysis showed that the mean
area of the midbrain in patients was significantly smaller
Table 1. Patient and Control Subject DemographicsPatients (n 5 50)
Controls (n 5 50)
Age 28.2 (6.88) 28.5 (6.10) Parental SESa 2.90 (0.46) 2.76 (0.51)
Age of onset 21.0 (5.58) Duration of illness (months) 89.9 (87.4) Positive symptoms (1–10 scale) 6.59 (2.78) Negative symptoms (1–20 scale) 11.6 (4.01) Disorganized symptoms
(1–15 scale)
5.81 (3.60)
Dose years 40.59 (94.69) Range50 –524
Values are means (SDs). SES, socioeconomic status.
aBased on a modified Hollingshead scale 1–5 with the higher the number, the
higher the social class.
Table 2. Results of t Tests and Analysis of Covariance Evaluating Size of Brain Stem Regions (cm2
) between Patients and Control Subjects
Patients
Control subjects
t p Fa p
Mean (SD)
Mean (SD)
Midbrain 2.38 0.31) 2.52 (0.27) 2.94 .003 6.93 .009 Pons 5.58 (0.56) 5.69 (0.67) 1.15 .252 0.71 .402 Medulla 4.17 (0.41) 4.23 (0.37) 0.67 .506 0.75 .388
than that of control subjects (t
5
2.94, p
5
.003). There
was no significant difference between groups in measures
of the medulla or pons. In the ANCOVA analysis, there
was a main effect of diagnosis on the area of the midbrain
(F
5
6.93, p
5
.009). There was no effect of diagnosis on
size of pons or medulla. When the analysis was run using
the other covariates (intracranial volume, total brain
vol-ume, and cerebral volume), the results remained the same
with patients having significantly smaller midbrain
mea-sures, though no difference from controls in size of pons or
medulla.
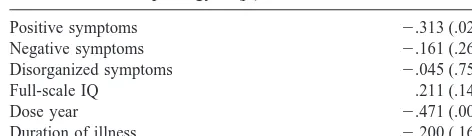
Spearman’s correlations were calculated to assess the
relationship between midbrain morphology and the
fol-lowing clinical measures: positive symptoms, negative
symptoms, disorganized symptoms, Full Scale IQ,
dose-years of neuroleptics and duration of illness. The results
are shown in Table 3. There was a significant inverse
relationship between size of midbrain and positive or
psychotic symptoms (r
5 2
.313, p
5
.028), indicating
that the greater the severity of psychotic symptoms, the
smaller the size of the midbrain. There were no significant
correlations between the other two symptom domains
(negative and disorganized) and midbrain morphology.
Furthermore, there was no correlation between midbrain
size and Full Scale IQ.
There was a relatively robust inverse relationship
be-tween dose-years of neuroleptics and midbrain size,
indi-cating that the greater the neuroleptic exposure, the
smaller the midbrain area. There was no direct relationship
between duration of illness and midbrain size; however,
duration of illness is correlated with dose-years as
neuro-leptic exposure is calculated as dose over time. Therefore,
the correlation between midbrain and dose-years was
recalculated partialing out the effect of duration of illness.
The correlation remained highly significant (r
5 2
.442,
p
5
.0001). In a similar fashion, positive symptoms may
be related to dose-years because those patients with
prominent positive symptoms may receive higher doses of
medication. The relationship between midbrain size and
positive symptoms after controlling for dose-years of
neuroleptics remained significant (r
5 2
.282, p
5
.051).
Likewise, the correlation between midbrain size and
dose-years remained significant after controlling for severity of
positive symptoms (r
5 2
.428, p
5
.002).
To evaluate the morphologic relationship between the
cerebellar vermis area and midbrain area, Pearson’s
cor-relations were calculated. The size of the midbrain was
significantly correlated to the size of the cerebellar vermis
in patients (r
5
.34, p
5
.01); however, there was no
relationship between the size of the cerebellar vermis and
that of the midbrain in the control subjects (r
5
.14, p
5
.30).
Discussion
We found that the morphology of the midbrain is
abnor-mal in the brains of patients with schizophrenia.
Specifi-cally, the size or area of the midbrain was found to be
smaller than that of control subjects. These findings would
corroborate those of Bogerts and colleagues (Bogerts et al
1983), who found morphometric abnormalities in the
midbrain of patients with schizophrenia at a microscopic
level. On the other hand, the only other study to evaluate
midbrain morphology with neuroimaging methods found
no significant difference in the size of the midbrain
compared to controls. Although the study by Aylward
(Aylward et al 1994) did find the patients to have smaller
midbrain areas, the finding was not statistically
signifi-cant. Our study used somewhat similar methods, yet our
sample of patients was larger (50 compared with 36) and
more homogenous (all men compared with 69% men).
Abnormal brain morphology in patients with
schizophre-nia has been found to be more robust in male patients in
general (Nopoulos et al 1997). Therefore, a larger sample
that was limited to men only may have provided the power
necessary to detect significant differences between groups.
Relationship to Neuroleptic Exposure
Analysis of the clinical correlates of midbrain morphology
indicated a robust relationship with cumulative neuroleptic
exposure with larger doses of medication over time being
associated with smaller midbrain area. This was not an
expected finding. Nonetheless, this is not the first study to
document changes in brain morphology related to
medi-cations. Our group and others have documented that
subcortical structures such as the caudate and lenticular
nucleus increase in size after exposure to typical
neuro-leptics and decrease over time after exposure to atypical
neuroleptics (Chakos et al 1994; Corson et al 1999;
Elkashef et al 1994; Frazier et al 1996; Keshavan et al
1994). The current findings suggest an opposite effect
from what is seen for the basal ganglia. That is, of the 45
patients who had been exposed to medication, 91% (n
5
41) had exposure to typical neuroleptic only, and the
correlation was inverse—the greater the drug exposure,
the smaller the midbrain. Because only four patients had
Table 3. Spearman Correlations between Clinical Measuresand Midbrain Morphology r (p)
exposure to atypical neuroleptics, this sample is too small
to address the issue of differential effects of typical versus
atypical neuroleptics.
Because the majority of this sample had been exposed
to medication, the question remains as to whether or the
abnormal morphology reported here reflects a primary
structural defect in the midbrain or purely a medication
effect. Do patients with schizophrenia who are neuroleptic
naive have abnormal midbrain morphology? The majority
of the current patient sample had been exposed to
medi-cations; however, in an attempt to address this question,
we collapsed the neuroleptic naive group with the
“al-most” neuroleptic naive group (very minimal neuroleptic
exposure) to comprise a sample of 14 subjects. A three
(group)
3
1 (midbrain) ANCOVA was performed using
total cerebellar volume as covariate. Adjusted means of
midbrain area were as follows: neuroleptic naive group
(n
5
14)
5
2.58; medicated group (n
5
36)
5
2.29;
control subjects (n
5
50)
5
2.52. Post hoc t tests on these
adjusted means showed that the neuroleptic naive group
had significantly larger midbrain areas compared with the
medicated group (t
5
3.46, p
5
.000) but did not differ
from control subjects. Though only a small sample, this
suggests that in neuroleptic-naive patients, morphology of
the midbrain may not be significantly smaller compared
with control subjects.
What is the possible mechanism for the relationship
between typical neuroleptics and smaller midbrain size?
One possibility is that chronic neuroleptic treatment
causes a tonic state of inactivation in midbrain dopamine
cell activity. This is referred to as “depolarization
block-ade” (Bunney et al 1991). This phenomenon is a
time-dependent process with slow transition of dopamine
neu-rons into this state and appears to correlate with the
therapeutic actions of typical neuroleptics such as
halo-peridol (Grace et al 1997). Chronic inactivation of these
cells may possibly cause reduction in neuronal or neuropil
volume. Moreover, several studies have suggested that the
induction of depolarization blockage is mediated through
the antipsychotic’s ability to block dopamine receptors in
the striatum (Chiodo and Berger 1986; Chiodo and
Bun-ney 1983; White and Wang 1983). This would suggest that
typical neuroleptics might be more likely to induce this
state than typical antipsychotics, which have less robust
dopamine blockade in the striatum. In turn, this would
predict that atypical neuroleptics might not have the same
effects on the morphology of the midbrain as typical
neuroleptics have.
Relationship to Psychotic Symptomatology
Even after controlling for the effects of neuroleptic
treat-ment, there remains a significant relationship between the
morphology of the midbrain and psychotic symptoms: the
more abnormal the morphology, the greater the severity of
psychotic symptoms. The relationship between psychotic
symptoms and dopamine is well established; however, the
details of how dopamine dysregulation occurs, what brain
regions are primarily involved, and with what other
neurochemical system(s) it interacts with is the subject of
much research and discussion. Most recently, Carlsson
and colleagues (Carlsson et al 1999) have put forth a
glutamatergic deficiency model of schizophrenia in which
they describe the balance of the gluatmate– dopamine
systems to be altered such that weakened glutamatergic
tone results in relative excess of dopamine. The substrate
is postulated to be feedback loops between the basal
ganglia, thalamus, and cortex that are modulated by the
midbrain dopaminergic pathways.
Similar Concept, Different Substrate: The
Cerebellar Connection
Morphologic Evidence of a Neural Circuit
Involving the Midbrain and Cerebellum
Our study found the size of the midbrain to be
signifi-cantly correlated to the size of the cerebellar vermis in
patients (r
5
.34, p
5
.01); however, there was no
relationship between the size of the cerebellar vermis and
that of the midbrain in the control subjects (r
5
.14, p
5
.30). In the previous study of cerebellar vermis, patients
were found to have a positive correlation between the size
of the vermis and the size of the temporal lobe, with both
of these regions being abnormally small compared with
control subjects. Yet there was no correlation between
vermis area and any cortical region in healthy control
subjects. The suggestion that a significant correlation
between two brain regions would indicate the existence of
a circuit is an indirect and very crude measure; however,
it is possible that if a particular brain circuit was abnormal,
the “nodes” on the circuit would be similarly affected and
therefore their size correlated.
Limitations
The MRI methods used for our study are actually quite
crude, using an area measurement from one midsagittal
slice as a proxy for volume measurement. In addition, the
entire midbrain region was assessed, but more specific
subregions would be of interest, such as substantia nigra or
the red nucleus with its extensive connections to deep
cerebellar nuclei and cerebral cortex. The fact that our
study had significant results and fairly robust correlations
suggests that the “signal” of abnormal morphology here is
strong enough to withstand crude measurement techniques
and calls for the need for further imaging studies with
more sophisticated methodologies, which we are currently
pursuing in our laboratory.
Summary
Male patients with schizophrenia have abnormally small
midbrain regions compared with control subjects. This
abnormality in the size of the midbrain appears to be
independently related to both severity of psychotic
symp-toms and to exposure to neuroleptics. The greater the
severity of psychosis, the smaller the midbrain, and the
greater the exposure to neuroleptics, the smaller the
midbrain. Whether the size difference between patients
and control subjects is due to drug plasticity alone needs to
be further addressed in studies that evaluate
neuroleptic-naive patients. The midbrain may play an important role in
a putative neural circuit involving the cerebellum and
limbic cortical regions. Abnormal functioning of this
circuit may be important in the pathophysiology of
psychosis.
This research was supported in part by National Institute of Mental Health Grants Nos. MH31593, MH40856, and MHCRC 43271; The Nellie Ball Trust Fund, Iowa State Bank and Trust Company, Trustee; and a Research Scientist Award, MH00625.
References
Anand B, Malhotra C, Singh B, Dua A (1959): Cerebellar projections to limbic system. J Neurophysiol 22:451– 457. Andreasen NC (1983): The Scale for the Assessment of Negative
Symptoms (SANS). Iowa City: University of Iowa.
Andreasen NC (1984): The Scale for the Assessment of Positive
Symptoms (SAPS). Iowa City: University of Iowa.
Andreasen NC, Cizadlo T, Harris G, et al (1993): Voxel processing techniques for the antemortem study of neuroanat-omy and neuropathology using magnetic resonance imaging.
J Neuropsychiatry Clin Neurosci 5:121–130.
Andreasen NC, Cohen G, Harris G, et al (1992a): Image processing for the study of brain structure and function: Problems and programs. J Neuropsychiatry Clin Neurosci 4:125–133.
Andreasen NC, Flaum M, Arndt S (1992b): The Comprehensive Assessment of Symptoms and History (CASH): An instru-ment for assessing psychopathology and diagnosis. Arch Gen
Psychiatry 49:615– 623.
Andreasen NC, Rajaprabhakaran R, Cizadlo T, et al (1994): Automated atlas-based dissection of the human brain from MR images. In: SMR Second Meeting Proceedings. Berkeley, CA: International Society for Magnetic Resonance in Medi-cine.
Aylward E, Reiss A, Barta P, et al (1994): Magnetic resonance imaging measurement of posterior fossa structures in schizo-phrenia. Am J Psychiatry 151:1448 –1452.
Bogerts B, Falkai P, Haupts M, et al (1990): Post-mortem volume measurements of limbic system and basal ganglia structures in chronic shcizophrenics. Schizophr Res 3:295– 301.
Bogerts B, Hantsch J, Herzer M (1983): A morphometric study of the dopamine-containing cell groups in the mesencephalon of normals, Parkinson patients, and schizophrenics. Biol
Psychiatry 18:951–969.
Bogerts B, Meertz E, Schonfeldt-Bausch R (1985): Basal ganglia and limbic system pathology in schizophrenia. Arch Gen
Psychiatry 42:784 –791.
Bunney BS, Chiodo LA, Grace A (1991): Midbrain dopamine system electrophysiological functioning: A review and new hypothesis. Synapse 9:79 –94.
Carlsson A, Hansson LO, Waters N, Carlsson ML (1999): A glutamatergic deficency model of schizophrenia. Br J
Psy-chiatry 174:2– 6.
Chakos MH, Lieberman JA, Bilder RM, et al (1994): Increase in caudate nuclei volumes of first-episode schizophrenic pa-tients taking antipsychotic drugs. Am J Psychiatry 151:1430. Chiodo LA, Berger TW (1986): Interactions between dopamine and amino acid-induced excitation and inhibition in the striatum. Brain Res 375:198 –203.
activity of A9 and A10 midbrain dopaminergic neurons.
Neuroscience 3:1607–1619.
Corson PW, Nopoulos P, Miller D, Arndt S, Andreasen NC (1999): Change in basal ganglia volume over 2 years in patients with schizophrenia: Typical versus atypical neuro-leptics. Am J Psychiatry 156:1200 –1204.
Davis JM (1974): Dose equivalence of the antipsychotic drugs.
J Psychiatr Res 11:65– 69.
Dempesy C, Albert T, Schlein A (1984): Changed turnover of monoamines in limbic nuclei in response to stimulation and lesion of the anterior vermal cortex of the cerebellum: Studies in cat and rat. Int J Neurol 18:94 –104.
Dempesy C, Tootle D, Fontana C, Fitzjarrell A, Garey R, Heath R (1983): Stimulation of the paleocerebellar cortex of the cat: Increased rate of synthesis and release of catecholamines at limbic sites. Biol Psychiatry 18:127–132.
Elkashef AM, Buchanan RW, Gellad F, Munson RC, Breier A (1994): Basal ganglia pathology in schizophrenia and Tardive dyskinesia: An MRI quantitative study. Am J Psychiatry 151:752–755.
Frazier JA, Giedd JN, Kaysen D, et al (1996): Childhood-onset schizophrenia: Brain MRI rescan after 2 years of clozapine maintenance treatment. Am J Psychiatry 153:564 –566. Grace AA, Bunney B, Moore H, Todd CL (1997): Dopamine-cell
depolarization block as a model for the therapeutic actions of antipsychotic drugs. Trends Neurosci 20:31–37.
Hallonet M, Le Douarin N (1993): Tracing neuroepithelial cells of the mesencephalic and metencephalic alar plates during cerebellar ontogeny in quail-chick Chimaeras. Eur J Neurosci 5:1145–1155.
Hallonet M, Teillet M, Le Douarin N (1990): A new approach to the development of the cerebellum provided by the quail-chick marker system. Development 108:19 –31.
Heath R, Dempesy C, Fontana C, Myers W (1978): Cerebellar stimulation: Effects on septal region, hippocampus, and amygdala of cats and rats. Biol Psychiatry 13:501–529. Heath R, Harper J (1974): Ascending projections of the
cerebel-lar fastigial nucleus to the hippocampus, amygdala, and other temporal lobe sites: Evoked potential and histological studies in monkeys and cats. Exp Neurol 45:268 –287.
Herz M (1997): Practice guidlines for the treatment of patients with schizophrenia. Am J Psychiatry 154:10.
Keshavan M, Bagwell W, Haas G, Sweeney J, Schooler N, Pettegrew J (1994): Changes in caudate volume with neuro-leptic treatment. Lancet 344:1434.
Lippman S, Manoochehr M, Baldwin H, Drasin G, Rice J, Alrajeh S (1982): Cerebellar vermis dimensions on comput-erized tomographic scans of schizophrenic and bipolar pa-tients. Am J Psychiatry 139:667– 668.
Miller D, Flaum M, Nopoulos P, Arndt S, Andreasen NC (1995): The concept of dose years: A reliable method for calculating lifetime psychotroptic drug exposure. Schizophr Res 15:159. Minabe Y, Kadono Y, Kurachi M (1990): A schizophrenic syndrome associated with a midbrain tegmental lesion. Biol
Psychiatry 27:661– 663.
Nopoulos P, Ceilley J, Gailis E, Andreasen N (1999): An MRI study of cerebellar vermis morphology in patients with schizophrenia: Evidence in support of the “cognitive dysme-tria”. Concept Biol Psychiatry 46:703–711.
Nopoulos PC, Flaum M, Andreasen NC (1997): Sex differences in brain morphology in schizophrenia. Am J Psychiatry 154:1648 –1654.
Rossi A, Stratta P, Mancini F, de Cataldo S, Casacchia M (1993): Cerebellar vermal size in schizophrenia: A male effect. Biol
Psychiatry 33:354 –357.
Sandyk R, Kay SR, Merriam AE (1991): Atrophy of the cerebellar vermis: Relevance to the symptoms of schizophre-nia. Int J Neurosci 57:205–212.
Snider R (1975): A cerebellar-ceruleus pathway. Brain Res 88:59 – 63.
Snider R, Maiti A (1975): Septal afterdischarges and their modification by the cerebellum. Exp Neurol 49:529 –539. Snider R, Maiti A (1976): Cerebellar contributions to the Papez
circuit. J Neurosci Res 2:133–146.
Snider R, Maiti A, Snider S (1976): Cerebellar pathways to ventral midbrain and nigra. Exp Neurol 53:714 –728. Snider S, Snider R (1977): Alterations in forebrain
catechol-amine metabolism produced by cerebellar lesions in the rat.
J Neural Transm 40:115–128.
Talairach J, Tournoux P (1988): Co-Planar Stereotaxic Atlas of
the Human Brain. New York: Thieme.
Tran KD, Smutzer GS, Doty RL, Arnold SE (1998): Reduced purkinje cell size in cerebellar vermis of elderly patients with schizophrenia. Am J Psychiatry 155:1288 –1290.
Urbanek P, Fetka I, Meisler MH, Busslinger M (1997): Cooper-ation of Pax2 and Pax5 in midbrain and cerebellum develop-ment. Proc Natl Acad Sci U S A 94:5703–5708.
Weinberger D, Kleinmann J, Luchins D, Bigelow L, Wyatt R (1980): Cerebellar pathology in schizophrenia: A controlled postmortem study. Am J Psychiatry 137:359 –361.
Weinberger D, Torrey E, Wyatt R (1979): Cerebellar atrophy in chronic schizophrenia. Lancet 1:718 –719.
White FJ, Wang RY (1983): Differential effects of classical and atypical antipsychotic drugs on A9 and A10 dopamine neu-rons. Science 221:1054 –1057.
Yachnis AT, Rorke LB (1999): Cerebellar and brain stem development: An overview in relation to Joubert Syndrome.