www.elsevier.nlrlocateraqua-online
Predicting impacts and recovery of marine-farm
sites in Stewart Island, New Zealand, from the
Findlay–Watling model
D.J. Morrisey
), M.M. Gibbs, S.E. Pickmere, R.G. Cole
National Institute of Water and Atmospheric Research, PO Box 11-115, Hamilton, New Zealand
Received 26 May 1999; received in revised form 6 October 1999; accepted 7 November 1999
Abstract
Data collected at marine farm sites on Stewart Island, New Zealand, were used to test the model for prediction of benthic impact of salmon net-pens proposed by Findlay and Watling
wFindlay, R.H., Watling, L., 1997. Prediction of benthic impact for salmon net-pens based on the
x
balance of benthic oxygen supply and demand. Mar. Ecol.: Prog. Ser., 155, 147–157. . The model
Ž
uses the ratio of oxygen supply to the benthos based on Fickian diffusion and current velocities
. Ž .
above the seabed to oxygen demand based on rate of input of organic carbon to the benthos as a predictor of benthic response to input of organic matter from farms. Estimates of the rate of input of carbon and supply of oxygen to the seabed below an operating salmon farm in this study provided predictions of the severity of impact that compared reasonably well with the observed anoxic nature of the sediment and presence of patches of Beggiatoa-like growths. At a site where farming of salmon has recently ceased, the model predicted rates of mineralisation of organic
y2 y1Ž
carbon in the sediments of 279–908 mmol m d depending on the method of summarising
.
data on current velocity . This was in reasonable agreement with the rates derived from the
Ž
observed decrease in the depth of the layer of waste over the period of a year 476–1206 mmol
y2 y1.
m d and with rates derived from measurements of fluxes of several chemical species from
Ž y2 y1.
the sediments 146–525 mmol m d . These results suggest that the model has utility beyond the locality for which it was originally developed and that it may also be useful for predicting
Ž
rates of recovery of farm sites. Accumulation of zinc and copper derived from food and
.
antifoulants in sediments below farms may significantly affect recolonisation of sediments by benthic organisms.q2000 Elsevier Science B.V. All rights reserved.
Keywords: Aquaculture; Benthos; Model; Recovery; Zinc; Pollution
)Corresponding author. Tel.:q64-7-856-7026; fax:q64-7-856-0151.
Ž .
E-mail address: [email protected] D.J. Morrisey .
0044-8486r00r$ - see front matterq2000 Elsevier Science B.V. All rights reserved. Ž .
1. Introduction
Culture of finfish in cages and of shellfish on longlines in coastal waters has a number of effects on the underlying seabed. Among the most widely documented are the impacts of organic waste from the farms on the character of the sediment and
Ž
consequent effects on communities of benthic organisms see Brown et al., 1987; Gowen and Bradbury, 1987; Nature Conservancy Council, U.K., 1989; Washington State Department of Fisheries, 1990; British Columbia Environmental Assessment
.
Office, 1997 for reviews . In the most severely impacted areas, these changes may cause substantial reductions in the diversity and abundance of benthic organisms. Numerous models have been developed to predict the dispersal and deposition of waste on the
Ž .
seabed e.g., Hargrave 1994; Hevia et al. 1996; Panchang et al. 1997 . Predicting the effects of the waste on benthic communities, other than in general terms, has proved less tractable due to, among other things, the spatial and temporal variability in the assimilative capacity of the sediments and in the distribution and response of benthic
Ž .
organisms Findlay et al. 1995 .
Ž .
Findlay and Watling 1997 proposed a simple model of benthic impact based on the balance of benthic oxygen supply and demand. The anoxic conditions that develop within the sediment when demand exceeds supply, the subsequent loss of benthic macrofauna, and the occurrence of mats of sulphide-oxidising bacteria, such as Beggia-toa species, were taken as criteria for unacceptable impact. The forcing functions of this
Ž model were simplified into the variables of current velocity above the seabed which
.
determines rate of oxygen supply and rate of input of organic carbon; both of which are relatively easy to measure. This simplification was based on correlations between benthic metabolic rates and rates of carbon flux to the sediment, derived from field studies at sites with different hydrodynamic conditions. It was also assumed that rate of supply of oxygen is determined by Fickian diffusion in response to current velocity, temperature, and concentration of oxygen in the overlying water.
There is limited published information on rates of recovery of sites impacted by Ž
organic waste from marine farms Mattsson and Linden, 1983; Edwards, 1988; Nature
´
Conservancy Council, U.K., 1989; Johannessen et al., 1994; British ColumbiaEnviron-.
supply, and therefore, by measuring the latter, we should be able to predict the rate of decrease in the amount of waste. This predicted rate of recovery was compared with a rate derived from in situ measurements of fluxes of dissolved oxygen, nitrogen, and hydrogen sulphide from the sediments below the farm. As an adjunct to the study of recovery of farmed sites, we also measured concentrations of heavy metals in sediments because they may affect recolonisation by benthic organisms.
Ž .
Findlay and Watling 1997 apparently collected current velocity data over a period of 2 years and suggested that the minimum 2-h average velocity was an appropriate summary value for incorporation into their model. They chose this summary statistic because current velocity varies with tidal stage and published information suggested that 2-h exposures to reduced oxygen and increased hydrogen sulphide concentrations may
Ž
cause permanent damage to the gills of sensitive infauna Findlay and Watling 1997, p. .
152 . In our study, we explicitly do not test the appropriateness of the minimum 2-h average velocity relative to other summaries of long-term data, for two reasons. First, testing has already been done during the original development of the model. Second, for the model to be useful in practical application, it must be capable of producing reliable predictions using the limited amount of information on near-bed current velocities that is generally available from monitoring programmes. Long-term collection of such informa-tion is a specialist task, and therefore, the informainforma-tion available for model calibrainforma-tion is likely to be collected over relatively short periods. We used minimum 2-h velocities derived from current meters deployed for periods of 24–145 h. For purposes of comparison, however, we also derived rates of oxygen supply from minimum velocities observed during our study.
2. Materials and methods
2.1. Study sites
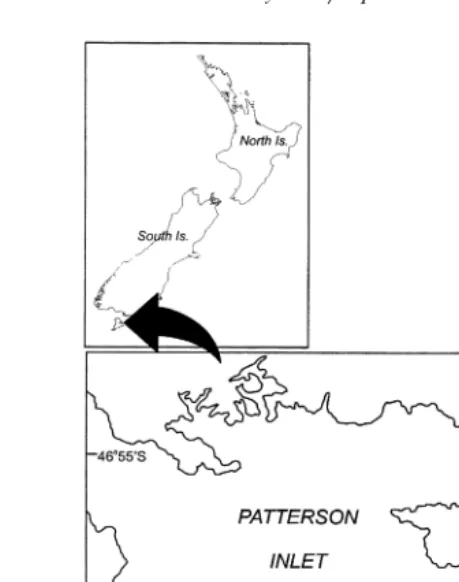
Ž .
The study sites were located in Big Glory Bay, Stewart Island, New Zealand Fig. 1 ,
Ž .
where cage-farming of chinook salmon Oncorhynchus tshawytscha has occurred since Ž
the mid-1980s. The contribution of salmon farms including accumulations of organic .
waste on the seabed to the nitrogen budget of the bay, and the implications for
Ž .
eutrophication, have been modeled by Pridmore and Rutherford 1992 . Having peaked in the late 1980s, salmon farming has subsequently declined and only two farms are currently operating.
Ž Studies were carried out in January 1997, March 1997, and March 1998 mid- to
.
late-summer at the following sites: a salmon farm that had not been stocked since
Ž . Ž .
December 1996 Site 1, Fig. 1 ; an operating salmon farm Site 2, Fig. 1 ; and adjacent
Ž .
control sites general locations indicated by ‘3’ in Fig. 1 . The salmon farms consisted of
Ž . Ž
linear arrays of four or more the number varies through time square cages 45 m on .
Ž .
Fig. 1. Map showing location of study sites. Site 1sdisused salmon farm net-pens , Site 2soperating
Ž .
salmon farm and Site 3sset of three control sites distributed around Site 1 see text for details .
the only one of several disused farm-sites in the bay that could be relocated with adequate precision. Water depth at all sites was about 26 m and the natural sediment was
Ž .
muddy sand percentage of mud content varied from 33–70%: NIWA, unpubl. data . Water temperature at the seabed during summer was 128C.
Ž .
Below each of salmon farms Sites 1 and 2 was an accumulation of organic waste, the surface of which was black and covered with patches of Beggiatoa-like growths Ži.e., yellow–white mats lying over the surface of the waste material . Macrofauna was.
Ž .
severely depleted low abundances of only 1–2 species: NIWA, unpubl. data . Out-gassing from the sediment was observed consistently during the present study. Accumu-lated waste and outgassing were also observed during an earlier study in 1987–1988 ŽNIWA, unpubl. data ..
2.2. Sampling
Current velocities and directions 1 m above the seabed were measured in January
Ž .
1997 and March 1998 for periods between 24 and 145 h Table 1 , using a recording
Ž .
Table 1
Ž . Ž .
Current velocities mean, minimum, maximum and minimum 2-h averaged at Site 1 disused salmon farm
y1
Ž .
Site Date Deployment Velocity cm s
Ž .
period h Mean Min. Max. Min. 2-h
average
Site 1 January 1997 24 2.8 0.2 7.0 1.1
March 1998 145.5 7.6 0.4 15.0 2.0
and Sites 1 and 2 in 1998. Due to instrument failure, data for Site 2 were lost. Since all study-sites were within 1.5–2 km of each other and in very similar hydrodynamic
Ž .
environments depth, bed topography, sediment type, exposure , current velocities from Site 1 were assumed to apply to other sites. Evidence to support this assumption is given below.
Carbon input to the seabed was measured using sediment traps, each consisting of a set of three individual traps on the same mooring line, positioned 1-m above the seabed.
Ž . Ž .
Individual traps measured 65 ID =800 mm aspect ratio 12.3 . Three sets of traps were deployed at Site 2 in 1997, and at Site 2 and control sites in 1998. Periods of
Ž . Ž
deployment were ca. 48 h Table 2 . Trapped material was filtered pre-weighed, .
pre-combusted, 25-mm diameter Whatman GFrC before determining the total weight Ž
of material and carbon and nitrogen content Perkin-Elmer 2400 CHN elemental .
analyzer .
Ž .
The depth of the layer of waste on the seabed at the two salmon farms Sites 1 and 2 was measured by pushing a ruler down through the layer until it contacted the much firmer, underlying sediment. Because of the large difference in texture between the waste and the underlying sediment, the depth of the former could be measured reliably. Changes in depth through time were measured at Site 1 by pushing plastic stakes into the sediment to a known depth and re-measuring them after one year. Stakes were
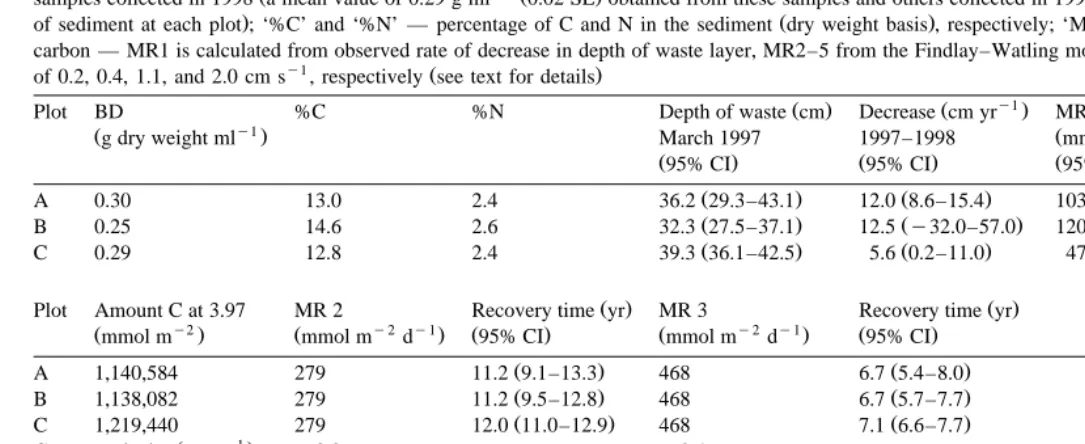
Table 2
Ž .
Data from sediment traps deployed 1 m above the seabed at the operating salmon farm Site 2 in 1997 and 1998 and the control sites in 1998. Data for each of the three trap-sets deployed at each site are means of n
Ž . Ž .
replicate traps SE and are presented as rates of deposition of total material dry weight , carbon, and nitrogen. Contents of one trap-set at Site 2 in 1997 were lost
Ž .
Operating farm 1 3 48 57.0 8.88 967.1 345.06 137.3 50.65
ŽSite 2 March 1997. 2 3Ž . 48 54.7 1.50Ž . 673.6 52.39Ž . 72.3 3.55Ž .
Ž . Ž . Ž . Ž .
Operating farm 1 3 48 62.9 1.82 695.4 67.70 81.0 5.93
Ž . deployed in groups of five in a circle of 3-m radius at each of three plots A, B and C ca. 50 m apart. Samples of surface sediment were collected at each of these plots in March 1998 and at one plot in March 1997. These samples were analysed for bulk
Ž .
density, volatile organic matter content combustion at 4008C for 18 h , particulate Ž
nitrogen, and total organic carbon Perkin-Elmer 2400 CHN elemental analyzer, after .
fuming with HCl to remove carbonates . Concentrations of Cu and Zn in these samples
Ž .
were measured by flame AAS Perkin-Elmer 3110 after extraction with 2 M HCl ŽWilliamson et al. 1995 ..
Ž . Ž
Benthic fluxes of dissolved oxygen DO , N NH and NO4 2rNO , the latter referred3
. Ž 2y.
to as NO hereafter , and sulphide Sx were determined at Sites 1 and 2, as well as at
Ž .
control sites using the chambers described by Burns et al. 1996 . In summary, these
Ž .
consisted of unstirred, opaque sampling depth was below the euphotic zone , plastic
Ž 2.
basins volume — 8 l, area of sediment enclosed 0.07 m sampled from the surface via a 3-mm ID semi-rigid nylon tube. There were two chambers at each of the three plots at each site. At each sampling, an appropriate volume of the initial water drawn through the tube was discarded to avoid sampling residual water in the tube. Volume-compensa-tion water entered through a small hole in the chamber wall as each sample was
Ž withdrawn. DO was measured immediately using a calibrated BOD bottle probe YSI
.
Model 5730 . Separate samples of water were taken for nutrient and sulphide analyses and the latter were fixed with zinc acetate. Concentrations of DO, nutrients, and S2y in compensation water were obtained from water collected just above the sediment with a van Dorn sampler. After being gently lowered to the seabed, each chamber was left for 0.5–1 h to allow any sediment disturbed during deployment to settle. Chambers were sampled at several intervals up to 24 h after deployment. Estimates of fluxes were obtained from time-plots of concentrations of the various chemical species in the chambers. Concentrations of nutrients were measured by Alpkem continuous flow air segmented autoanalyser. Concentrations of sulphide were determined
spectrophotometri-Ž .
cally using the method of Rees et al. 1971 . DO concentrations in the water-column
Ž .
were measured in situ by DO meter YSI Model 58 fitted with long cable and stirrer .
3. Results and discussion
3.1. CurrentÕelocities
Ž In January 1997, the minimum 2 h-average velocity 1-m above the seabed the
. y1
summary statistic used by Findlay and Watling, 1997 was 1.1 cm s at Site 1, but
y1 Ž .
values as low as 0.2 cm s were often recorded over shorter time-intervals Table 1 . In March 1998, minimum 2-h average velocity was 2.0 cm sy1 at Site 1 and minimum
y1 Ž
values recorded over shorter intervals were ca. 0.4 cm s . An earlier study NIWA,
. y1
The model was not adapted for the difference in water-temperature between Findlay
Ž .
and Watling’s study and the present study 158C vs. 128C for the following reason. Ž .
Maximum rates of benthic oxygen supply J for the model are derived from Fick’s first law:
JsD C
Ž
`yC0.
rZdŽ
Findlay and Watling’s Eq. 1, p. 151.
where D is the molecular diffusion constant of oxygen at ambient temperature, C and`
C0 are the concentrations of oxygen in the bulk water and at the sediment–water interface, respectively, and Z is the thickness of the diffusive boundary layer. Follow-d
Ž
ing Findlay and Watling, we used concentrations of oxygen confirmed by in situ .
measurements at saturation and zero for C` and C , respectively. Consequently, all0
terms on the right hand side of the equation are multiplicative. The ratio of saturation concentration of oxygen at 128C to that at 158C is 1.07, and the ratio of D at 128C to
Ž that at 158C varies between 0.88 and 0.99 depending on the method of derivation Wilke
.
and Chang, 1955; Wise and Houghton, 1966; Broecker and Peng, 1974 . Therefore, the product of 1.07 and these values for the ratio of D varies about 1. Since the maximum change in J due to temperature is only 6%, we chose to ignore this and note that the model’s prediction of maximum rate of oxygen supply is probably robust to differences in ambient temperature within this range.
3.2. Rates of input of carbon at an operating fish farm
Ž .
Rates of input of carbon to the sediments below the operating farm Site 2 , measured by the sediment traps deployed 1 m above the seabed, ranged from 463–967 mmol C
y2 y1 Ž .
m d Table 2 and ranges were similar for both years. Rates at the control sites in 1998 ranged from 46 to 53 mmol C my2 dy1. Traps at Site 2 were placed in a 5-m gap
Ž .
between cages rather than directly underneath them and, at the time of deployment, the cage on one side of each set of traps was stocked with an adult fish and that on the other side was empty. In 1998, trap-set 2 at Site 2 was positioned nearer to the empty cage
Ž
than the stocked cage and received less sediment than trap-sets 1 or 3 by factors of 2.7 .
and 1.6, respectively , indicating the degree of within-farm variation in input of waste to
Ž .
the seabed. Pridmore and Rutherford 1992 reported rates of sedimentation 5–10 times larger than ours at the same farm, but their sediment traps were placed 1 m below the bottom of the cages and feeding techniques on the farm have become more efficient since the time of their study. Our rates of input of carbon lie within the ranges reported
Ž .
in many other studies reviewed by Hargrave 1994 . If the depth below the cages is 15
y1 Ž
m, average rate of sinking of food pellets is 12 cm s Gowen and Bradbury, 1987;
. y1 Ž .
Findlay and Watling, 1994 and average current velocity is 2.8 cm s Table 1 , waste food will be dispersed 3.5 m beyond the cages and fecal material, being less dense, is
Ž .
likely to travel further Findlay and Watling, 1994 . The data from the sediment traps therefore probably provided a reasonable estimate of rates of input of waste to the seabed in our study area.
Ž .
We used the mean values from the traps at the operating farm Site 2 for each year Ž820 and 638 mmol C my2 dy1 for 1997 and 1998, respectively and the maximum.
Ž y2 y1.
Ž y1. Ž
input. These were combined with minimum 2-h average velocity 1.1 cm s and in a
. Ž y1.
separate calculation unaveraged minimum velocity 0.2 cm s to estimate rates of benthic oxygen supply and demand from Findlay and Watling’s regression equations Žtheir Eqs. 3 and 4 , p. 155 :Ž . Ž . .
where Õ is current velocity cm s ,
O demand mmol m2
Ž
y2dy1.
s1.07xy32.6Ž y2 y1.
where x is carbon flux to the seabed mmol m d . Ž .
If the ratio rate of O supply2 rrate of O demand I is ca. 1, the Findlay–Watling2
model predicts that sediments will be ‘‘moderately impacted’’, however, if I is -1, Ž
sediments will be severely impacted i.e., azoic and Beggiatoa-type mats will be .
present . When I is much less than 1, waste material will accumulate on the seabed. Values of I for Site 2 in the present study were 0.90, 1.18, and 0.76 for a current velocity of 1.1 cm sy1 and rates of carbon input of 820, 638, and 967 mmol my2 dy1,
respectively, suggesting that a severe impact would be expected, but not an
accumula-Ž y1.
tion of waste. When the minimum observed current velocity 0.2 cm s was used, for purposes of comparison, the equivalent values of I were 0.32, 0.41, and 0.27. In contrast to values derived using the minimum 2-h average velocity, these values suggest severe impact and that, at the higher end of the observed range of carbon input, the accumulation of waste is likely. This conclusion was supported by measurements of the depth of accumulated material on the bed below this farm. The depth ranged from 0 to 31.5 cm, the surface sediment was uniformly black and numerous patches of Beggiatoa-like growths were present. These observations of spatially variable
accumula-Ž .
tion of waste over scales of metres within plots and 10s of metres between plots corresponded with the measured amounts and variability of input of carbon recorded by the sediment traps. Our estimates of I indicate the sensitivity of the model to the value
Ž .
of current velocity used. Findlay and Watling 1997 pointed out that this sensitivity is greatest at slower velocities.
3.3. RecoÕery of a disused salmon-farm site
Ž .
Mean depth of waste material on the seabed in March 1997 Table 3 varied from 32 Ž
to 39 cm among the three plots at Site 1 differences among plots were significant: .
Kruskal–Wallis test statistics6.196, P-0.05 . The mean decrease in depth of the waste layer between 1997 and 1998 was 12.0, 12.5, and 5.6 cm at Plots A, B, and C,
Ž .
respectively Table 3 . Some of the stakes had been lost, probably due to entanglement in surface-marker lines. There was considerable variation in the change in depth at Plot
Ž . Ž .
C ranges among the five stakes 0–10 cm relative to Plot A ranges 10–15 cm . Dividing the mean depth at each plot in March 1997 by the rate of decrease in depth gives recovery periods from the cessation of stocking of the cages of 3.3, 3.1, and 7.5
Ž .
years for Plots A, B, and C, respectively Table 3 .
The total amount of carbon in the waste layer present at each plot at Site 1 in March
Ž y2.
()
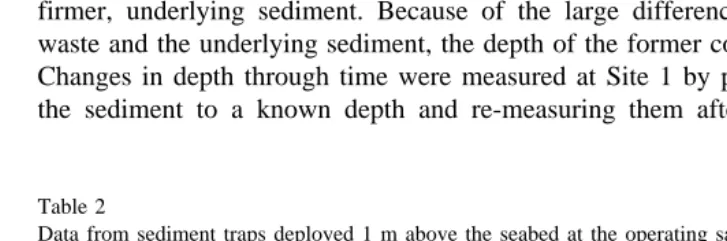
Values of sediment-related variables, depth of accumulated waste, and change in depth of waste between March 1997 and March 1998 at three plots A–C at the
Ž . Ž .
disused salmon farm Site 1 . Estimated periods of recovery mineralisation of accumulated waste of the three plots are also given. ‘BD’ — bulk density measured in
Ž y1Ž .
samples collected in 1998 a mean value of 0.29 g ml 0.02 SE obtained from these samples and others collected in 1997 was used to estimate changes in amount
. Ž .
of sediment at each plot ; ‘%C’ and ‘%N’ — percentage of C and N in the sediment dry weight basis , respectively; ‘MR’ — estimated rate of mineralisation of carbon — MR1 is calculated from observed rate of decrease in depth of waste layer, MR2–5 from the Findlay–Watling model assuming minimum current velocities
y1 Ž .
of 0.2, 0.4, 1.1, and 2.0 cm s , respectively see text for details
y1
Ž . Ž .
Plot BD %C %N Depth of waste cm Decrease cm yr MR 1 Recovery
y1 y2 y1
Žg dry weight ml . March 1997 1997–1998 Žmmol m d . time yrŽ .
Ž95% CI. Ž95% CI. Ž95% CI. Ž95% CI.
Ž . Ž . Ž . Ž .
A 0.30 13.0 2.4 36.2 29.3–43.1 12.0 8.6–15.4 1035 739–1332 3.3 1.8–4.7
Ž . Ž . Ž . Ž .
B 0.25 14.6 2.6 32.3 27.5–37.1 12.5 y32.0–57.0 1206 y3084–5496 3.1 y10.3–16.5
Ž . Ž . Ž . Ž .
C 0.29 12.8 2.4 39.3 36.1–42.5 5.6 0.2–11.0 476 12–939 7.5 0.9–14.1
Ž . Ž .
Plot Amount C at 3.97 MR 2 Recovery time yr MR 3 Recovery time yr
y2 y2 y1 y2 y1
Žmmol m . Žmmol m d . Ž95% CI. Žmmol m d . Ž95% CI.
Ž . Ž .
A 1,140,584 279 11.2 9.1–13.3 468 6.7 5.4–8.0
Ž . Ž .
B 1,138,082 279 11.2 9.5–12.8 468 6.7 5.7–7.7
Ž . Ž .
C 1,219,440 279 12.0 11.0–12.9 468 7.1 6.6–7.7
y1
Ž .
Current velocity cm s 0.2 0.4
Ž . Ž .
Plot Amount C at 3.97 MR 4 Recovery time yr MR 5 Recovery time yr
y2 y2 y1 y2 y1
Žmmol m . Žmmol m d . Ž95% CI. Žmmol m d . Ž95% CI.
Ž . Ž .
A 1,140,584 745 4.2 3.4–5.0 908 3.4 2.8–4.1
Ž . Ž .
B 1,138,082 745 4.2 3.6–4.8 908 3.4 2.9–3.9
Ž . Ž .
C 1,219,440 745 4.5 4.1–4.8 908 3.7 3.4–4.0
y1
Ž .
Ž .
the bulk density and carbon content of the material Table 3 . Given the low current
Ž y1.
velocities at this site maximum recorded velocity during the study was 15 cm s , Ž
resuspension and dispersal of the sediment is unlikely Amos et al. 1992, Maa et al. .
1993 . We therefore assumed that the reduction in depth of waste was due to decomposi-tion, although resuspension andror compaction may also have occurred, causing overestimation of the rate of decomposition. Using the minimum current velocities
Ž .
discussed above and Findlay and Watling’s Eqs. 2–4 , we estimated the maximum rate
Ž .
of mineralisation of carbon in the sediment at each plot assuming Is1 . Dividing the
Ž .
total mass of carbon present in the waste at each plot Table 3 by the maximum predicted rate of mineralisation provided a second estimate of the time for recovery of the sediment. Recovery times for the three plots based on minimum 2-h average
Ž .
velocities ranged from 3.4 to 4.5 years Table 3 . Times based on minimum observed velocities ranged from 6.7 to 12.0 years.
Recovery times estimated from the model using minimum 2-h average velocities corresponded reasonably well with those calculated from observed rates of decrease in the depth of the layer of waste. As with estimates of impact, predictions were sensitive to estimates of time-averaged current velocity, but minimum 2-h average velocities appeared to give better predictions than unaveraged minima.
Rates of mineralisation of waste derived from the rate of decrease in depth of waste
y2 y1 Ž y2 y1.
at Site 1, 5.7–14.5 g C m d 476–1206 mmol C m d , are comparable to values based on minimum 2-h averaged current velocity of 1.1 cm sy1derived using the
Ž y2 y1 y2 y1.
Findlay–Watling model 8.9 g C m d or 745 mmol C m d . They are also comparable to values reported in other studies. Rates of mineralisation of waste in the
y2 y1Ž y2 y1.
sediments at Site 1 were estimated at 5–6 g C m d 417–500 mmol C m d in
Ž . Ž .
a study in the mid-1980s NIWA unpubl. data . Angel et al. 1995 estimated rates of
y2 y1 Ž y2 y1.
mineralisation of 1.8–5.0 g C m d 150–417 mmol C m d below a farm in the Red Sea.
3.4. Chemical fluxes from sediments
Fluxes of all the chemical species measured showed large variation between replicate chambers at the same plot, among replicate plots at the same site and, in the case of
Ž .
measurements at the disused farm Site 1 in 1998, between replicate times of sampling
Ž .
3 days apart at the same position Table 4 . Fluxes were similar between years and
Ž .
between the two farm-sites Sites 1 and 2 , apart from one plot at the operating farm ŽSite 2 that showed much larger fluxes than other plots. Fluxes at the farm-sites were. very much larger than at controls. These data indicate that there is large variability in sediment processes across the impacted sites and confirm the impacts relative to the non-impacted controls.
Fluxes of NH –N and NO –N were combined and multiplied by a conversion factor4 x
Ž .
to provide estimates of rates of mineralisation of C. The conversion factor 4.286 was derived from the equation C H NO5 7 2q5O2™5CO2q2H O2 qNH , in which 5 mol3
Ž .
of C are mineralised for each mole of ammoniacal-N produced Fritz et al., 1979 . Fluxes of NH –N and NO –N were combined, based on the assumption that fluxes of4 x
Ž
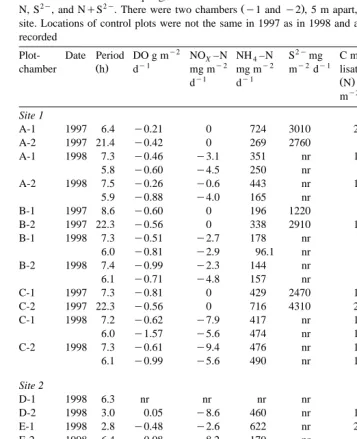
Table 4
Ž .
Rates of benthic chemical fluxes at the disused and operating salmon farms Sites 1 and 2, respectively and
Ž
the control sites. At Site 1 in 1998, measurements were repeated, 3 days apart, at each plot chambers were
.
lifted between times of sampling . Estimates of rates of mineralisation of C are also shown, based on fluxes of
2y 2y Ž .
N, S , and NqS . There were two chambers y1 andy2 , 5 m apart, at each of the three plots at each site. Locations of control plots were not the same in 1997 as in 1998 and are labeled differently. ‘nr’ — not recorded
y2 2y
Plot- Date Period DO g m NO –N NH –NX 4 S mg C C C
minera-y1 y2 y2 y2 y1
Ž .
chamber h d mg m mg m m d lisation lisation lisation
. 2y
burn, 1996 . Fluxes of S were converted to rates of mineralisation of C using a
Ž . Ž . 2y
conversion factor 0.75 derived from the equation 2 n CH O2 qnSO4 ™2nCO2q 2 nH O2 qnS2y, in which 2 mol of C are mineralised for each mole of S2y produced ŽDahlback and Gunnarsson 1981 .
¨
.Although the use of unstirred benthic chambers will potentially underestimate the
Ž .
nutrient fluxes across the sediment–water interface Glud et al. 1995 , their use at these study sites was considered realistic because the minimum 2-h averaged current velocity was about 1 cm sy1. Effects of flow in stirred benthic chambers appear to be more
pronounced at velocities above 2 cm sy1, where an increase in rate of flux of 25% may
Ž .
occur Glud et al. 1995 . Consequently, our non-stirred chamber may be underestimating the rate of mineralisation of carbon, but probably not by more than 25%.
Estimates of rates of mineralisation of C from benthic chambers at the disused farm ŽSite 1 were obtained by adding the rates based on N flux and those based on S. 2y flux
because these two processes are mutually exclusive, and therefore, additive. They ranged
y2 y1 Ž . Ž .
from 146 to 525 mmol m d mean 333, 95% CI 191–474 Table 4 . These were comparable with, but generally smaller than, rates derived from measured decreases in
Ž the depth of the layer of waste at the farm and from the Findlay–Watling model Table
. 2y
3 . Estimates were based on fluxes measured in 1997, since data on fluxes of S were not available for 1998. Rates of mineralisation of C based on fluxes of N in 1997 and
Ž y2 y1
1998 were not significantly different mean rate in 1997 — 159.30 mmol m d , .
95% CI 74.50–244.11; mean rate in 1998 — 110.09, 95% CI 75.21–144.97 , and since fluxes of nitrogen species and sulphide were approximately 1:1 over the range of release
Ž .
rates measured Table 4 , this suggests that rates were likely to be similar at both times
Ž .
of sampling. Earlier studies at this site NIWA, unpubl. data estimated rates of mineralisation of C to be 417–500 mmol my2 dy1, 83–167 mmol my2 dy1 of which
was derived from efflux of methane, while 188 mmol my2 dy1 was by release of S2y
and 158 mmol my2 dy1 was by sediment oxygen demand. These values lie within the
Ž y2 y1.
range 146–525 mmol m d obtained with the benthic chambers in the present
Ž .
study Table 4 . Methane production was not measured in the present study. Adding an
Ž .
equivalent proportional contribution 19–32% by methanogenesis from the earlier study to the estimated of rates of mineralisation based on nutrient fluxes in this study gives values of 170–700 mmol C my2 dy1.
3.5. Potential effects of heaÕy metal contaminants on recoÕery of farm sites
Mineralisation of accumulated waste is the first stage in the process of recovery, facilitating recolonisation by benthic organisms. It implies that the impact of marine farms on the benthic environment is a reversible process. Recolonisation may be impaired, however, by the presence in the sediments of persistent contaminants, such as
Ž .
heavy metals. Studies of sediments below farms in Scotland Edwards, 1998 and
Ž .
Canada British Columbia Environmental Assessment Office, 1997 have reported high
Ž .
concentrations of copper derived from antifoulant on the cages; Beveridge, 1996 and
Ž .
zinc derived from food; British Columbia Environmental Assessment Office, 1997 .
Ž .y1
present study, the concentration of zinc in sediments from the three plots at Site 1 was
Ž .y1 Ž
665mg g dry weight sediment "19.5 SE, ns5; mean concentration at nearby
Ž .y1 Ž .
control sites: 18 mg g dry weight sediment "2.1 SE, ns3 . Concentrations of copper were generally similar to nearby control sites, although a few individual samples contained higher concentrations. If copper in the sediments is derived from particles of antifoulant paint dislodged from the cages, locally high but spatially variable concentra-tions are likely in the period after first use of the paint.
The zinc concentrations exceed the sediment quality criteria proposed by Long et al. Ž1995 at which adverse biological effects of the contaminant are likely to occur 410. Ž
Ž .y1. Ž .
mg g dry weight sediment . Watzin and Roscigno 1997 found differences in recruitment of benthic invertebrates between control sediments and sediments
experi-Ž Ž .y1.
mentally spiked with zinc to concentrations 646mg g dry weight sediment , similar
Ž .
to those measured at the disused farm site Site 1 in the present study. These differences included reduced numbers of individuals of several taxa in the zinc-spiked sediment. Bioavailability of heavy metals in sediments is controlled by the relative abundance of
Ž
metal-binding phases, such as organic matter and sulphides Casas and Crecilius, 1994; .
Ankley, 1996 , and is therefore, likely to be relatively low in organically enriched, anoxic sediments. As marine farm sites recover, in terms of mineralisation of accumu-lated waste, concentrations of metal-binding phases will decrease and heavy metal contaminants will become more bioavailable and potentially toxic. Consequently, recov-ery of the benthic communities may be impaired and the assumption that benthic impacts of farms are completely reversible may not be appropriate.
4. Conclusions
Estimates of the rate of input of C and supply of O to the seabed below an operating2
salmon farm, based on measured rates of sedimentation and the Findlay–Watling model, respectively, provided predictions of the severity of impact that compared reasonably well with visual observations of the nature of the sediment below the farm. The surface of the sediment was black and covered in numerous patches of Beggiatoa-like growths. At a site where farming of salmon had recently ceased, predicted rates of recovery of the underlying seabed based on rates of mineralisation of C derived from the Findlay–Wa-tling model were in reasonable agreement with rates derived from the observed decrease in the depth of the layer of waste over a 1-year period.
Rates of mineralisation of waste derived from the rate of decrease in the depth of the layer of waste at a disused farm site were comparable to those derived for the same site using the Findlay–Watling model and current velocity data. This supports the suggestion
Ž .
of Findlay and Watling 1997 that the model has applicability beyond their study Ž
environment. They also suggested that a different molar oxygen demand ;0.5:1 rather .
than the value of ;1 used in their model might be appropriate for sites with accumulations of waste on the seabed. Our results indicate that this modification may not be necessary. Incorporating the lower value for molar oxygen demand into their Eq. Ž .4 gives predicted rates of mineralisation at Site 1 of 1593 mmol C my2 dy1, which is
layer of waste. Variables measured in the present study often showed large spatial and temporal variation, illustrating the need for adequate spatial and temporal replication in studies of benthic impact and recovery.
Acknowledgements
Ž .
We thank Andy Hill NIWA for help with field work and analysis of current velocity
Ž .
data, Karen Burt and Faye Richards NIWA for chemical analyses, Big Glory Seafoods for permission to work at their farm sites and for providing logistical support and to the
Ž .
staff of the marine farms particularly Simon Marwick, Greg North, and Mark Sowden
Ž .
for help and hospitality. Mike Beardsell, Rick Pridmore, and Kit Rutherford NIWA provided helpful comments on earlier versions of this manuscript and Mal Green ŽNIWA provided valuable advice on sediment resuspension. This study was funded by. the Foundation for Research, Science, and Technology of New Zealand.
References
Amos, C.L., Daborn, G.R., Christian, H.A., Atkinson, A., Robertson, A., 1992. In situ erosion measurements on fine-grained sediments from the Bay of Fundy. Mar. Geol. 108, 175–196.
Angel, D.L., Krost, P., Gordin, H., 1995. Benthic implications of net cage aquaculture in the oligotrophic Gulf
Ž .
of Aqaba. In: Rosenthal, H., Moav, B., Gordin, H. Eds. , Improving the knowledge base in modern aquaculture. Proceedings of the 5th German–Israeli Status Seminar of the German–Israeli Cooperation Programme in Aquaculture Research, July 18 1994, Jerusalem, Israel. pp. 129–173, Ghent, Belgium, European Aquaculture Society Special Publication No. 25.
Ankley, G.T., 1996. Evaluation of metalracid-volatile sulfide relationships in the prediction of metal bioaccumulation by benthic macroinvertebrates. Environ. Toxicol. Chem. 15, 2138–2146.
Beveridge, M.C.M., 1996. In: Cage Aquaculture. 2nd edn. Fishing News Books, Oxford, 346 pp.
Blackburn, T.H., 1996. Nitrogen gas flux from sediments: insights from simulation modeling. Aquat. Microb. Ecol., Proc. Conf. 10, 209–211.
British Columbia Environmental Assessment Office, 1997. Salmon aquaculture review. Volume 3 Technical advisory team discussion papers. British Columbia Environmental Assessment Office.
Broecker, W.S., Peng, T.-H., 1974. Gas exchange rates between air and sea. Tellus 26, 21–35.
Brown, J.R., Gowen, R.J., McLusky, D.S., 1987. The effect of salmon farming on the benthos of a Scottish sea loch. J. Exp. Mar. Biol. Ecol. 109, 39–51.
Burns, N.M., Gibbs, M.M., Hickman, M.L., 1996. Measurement of oxygen production and demand in lake waters. N.Z. J. Mar. Freshwater Res. 30, 127–133.
Casas, A.M., Crecilius, E.A., 1994. Relationship between acid volatile sulfide and the toxicity of zinc, lead, and copper in marine sediments. Environ. Toxicol. Chem. 13, 529–536.
˚
Dahlback, B., Gunnarsson, L.A.H., 1981. Sedimentation and sulfate reduction under a mussel culture. Mar.¨
Biol. 63, 269–275.
Edwards, J.M.R., 1988. The impact of sea cage salmon farming on the benthic environment of Big Glory Bay, Stewart Island. Unpublished MSc thesis, University of Otago, New Zealand.
Edwards, R., 1998. A catch too far. New Sci. 157, 12.
Findlay, R.H., Watling, L., 1994. Toward a process level model to predict the effects of salmon net-pen
Ž .
aquaculture on the benthos. In: Hargrave, B.T. Ed. , Modeling Benthic Impacts of Organic Enrichment from Marine Aquaculture. Can. Tech. Rep. Fish. Aquat. Sci., 47–77.
Findlay, R.H., Watling, L., Mayer, L.M., 1995. Environmental impact of salmon net-pen culture on marine benthic communities in Maine: a case study. Estuaries 18, 145–179.
Fritz, J.J., Middleton, A.C., Meredith, D.D., 1979. Dynamic process modeling of wastewater stabilization ponds. J. Water Pollut. Control. Fed. 51, 2724–2743.
Glud, R.N., Gundersen, J.K., Revsbech, N.P., Jørgensen, B.B, Huttel, M., 1995. Calibration and performance¨
of the stirred flux chamber from the benthic lander Elinor. Deep-Sea Res. 42, 1029–1042.
Gowen, R.J., Bradbury, N.B., 1987. The ecological impact of salmonid farming in coastal waters: a review. Oceanogr. Mar. Biol. Annu. Rev. 25, 563–575.
Ž .
Hargrave, B.T., 1994. A benthic enrichment index. In: Hargrave, B.T. Ed. , Modeling Benthic Impacts of Organic Enrichment from Marine Aquaculture. . Can. Tech. Rep. Fish. Aquat. Sci., 79–91.
Hevia, M., Rosenthal, H., Gowen, R.J., 1996. Modeling benthic deposition under fish cages. J. Appl. Ichthyol. 12, 71–74.
Johannessen, P.J, Botnen, H.B., Tvedten, Ø.F., 1994. Macrobenthos: before, during, and after a fish farm. Aquacult. Fish. Manage. 25, 55–66.
Long, E.R., Macdonald, D.D., Smith, S.L., Calder, F.D., 1995. Incidence of adverse biological effects within ranges of chemical concentrations in marine and estuarine sediments. Environ. Manage. 19, 81–97. Maa, J.P.-Y., Wright, L.D., Lee, C.-H., Shannon, T.W., 1993. VIMS Sea Carousel: a field instrument for
studying sediment transport. Mar. Geol. 115, 271–287.
Ž .
Mattsson, J., Linden, O., 1983. Benthic macrofauna succession under mussels, Mytilus edulis L. Bivalvia ,´
cultured on hanging long-lines. Sarsia 68, 97–102.
Nature Conservancy Council, U.K., 1989. Fishfarming and the safeguard of the natural marine environment of Scotland. Nature Conservancy Council, United Kingdom.
Panchang, V., Cheng, G., Newell, C., 1997. Modeling hydrodynamics and aquaculture waste transport in coastal Maine. Estuaries 20, 14–41.
Pridmore, R.D., Rutherford, J.C., 1992. Modeling phytoplankton abundance in a small enclosed bay used for salmon farming. Aquacult. Fish. Manage. 23, 525–542.
Rees, T.D., Gyllenspetz, A.B., Docherty, A.C., 1971. The determination of trace amounts of sulphide in condensed steam with NN-diethyl-p-phenylalanine. Analyst 96, 201–208.
Washington State Department of Fisheries, 1990. Final programmatic environmental impact statement. Fish culture in floating net-pens. Technical Appendices. Washington State Department of Fisheries, Olympia, Washington.
Watzin, M.C., Roscigno, P.R., 1997. The effects of zinc contamination on the recruitment and early survival of benthic invertebrates in an estuary. Mar. Pollut. Bull. 34, 443–455.
Wilke, C.R., Chang, P., 1955. Correlation of diffusion coefficients in dilute solutions. AIChE J. 1, 264–270. Williamson, R.B., Mol-Krijnen, J., Van Dam, L.F., 1995. Trace metal partitioning in bioturbated, contami-nated, surficial sediments from Mangere Inlet, New Zealand. N.Z. J. Mar. Freshwater Res. 29, 117–130. Wise, D.L., Houghton, G., 1966. The diffusion coefficients of ten slightly soluble gases in water at 10–168C.