NETWORK DESIGN IN CLOSE-RANGE PHOTOGRAMMETRY
WITH SHORT BASELINE IMAGES
L. Barazzetti
Dept. of Architecture, Built environment and Construction engineering (ABC) Politecnico di Milano, Piazza Leonardo da Vinci 32, Milan, Italy
[email protected] http://www.gicarus.polimi.it
KEY WORDS: Accuracy, Automation, Bundle adjustment, Network Design, Precision, Simulation
ABSTRACT:
The avaibility of automated software for image-based 3D modelling has changed the way people acquire images for photogrammetric applications. Short baseline images are required to match image points with SIFT-like algorithms, obtaining more images than those necessary for “old fashioned” photogrammetric projects based on manual measurements. This paper describes some considerations on network design for short baseline image sequences, especially on precision and reliability of bundle adjustment. Simulated results reveal that the large number of 3D points used for image orientation has very limited impact on network precision.
1. INTRODUCTION
Nowadays, the word “automation” has reached an impressive technological maturity in the field of image-based 3D reconstruction. In recent years, new algorithms were developed from the combination of photogrammetric and computer vision techniques. Users can now obtain detailed 3D models with photorealist texture with minimum manual effort.
Most steps of the “image modelling pipeline” (calibration, orientation, dense matching, mesh generation, texture mapping, orthophoto production) can apparently be carried out in a fully automated way (“babysitting the computer”), limiting the manual effort to image acquisition and ground control point measurement. On the other hand, the growing number of users of photogrammetric/computer vision automated software has also led to an increment of crude digital reconstructions without metric integrity. In fact, users without photogrammetric/surveying experience tend to acquire many images (more than those strictly necessary) with an unfavourable geometry, obtaining “nice” textured models sometimes without metric accuracy (Nocerino et al., 2014). Weak network geometry coupled with uncalibrated images is an important source of errors.
Without a doubt, the transition from manual to automated approaches for the extraction of tie points (TPs) is one of the reasons behind the growing popularity of software for image-based reconstruction. The use of operators like SIFT (Lowe, 2004) or SURF (Bay et al., 2008), which are able to detect corresponding points between set of convergent images, has reduced the manual selection of TPs performed by picking points, limiting manual work only for the case of ground control points (GCPs). In the past, automation was possible only with coded targets or images with the typical aerial (normal) configuration matched with correlation techniques.
The laborious manual extraction of tie points had a remarkable advantage in terms of a better understanding of the photogrammetric process. Users had to pay special attention to image acquisition to reduce manual work. Network design, i.e.
the identification of a suitable image configuration around the object, was a fundamental task.
At the end of October 2010, a new version of PhotoModeler has been released. It incorporated a new SmartMatch tool based on the SIFT operator. It was immediately clear that image processing algorithms for matching needed a new image configuration based on relatively short baselines to detect corresponding points.
This does not mean that the precision of point triangulation is worse because of the short baseline. The use of short baseline images does not always give an overall worsening of precision, because additional images have mainly the aim to facilitate the identification of the same point in more images, reaching therefore the traditional photogrammetric baseline. This means that when matching algorithms like SIFT are used, images have to be acquired by considering the capability of the algorithm to match corresponding points.
Overall, the user has to take into consideration the following aspects during image acquisition:
requirements of the project: metric scale, level of detail, geometric accuracy, …
characteristics of the object: size, shape, texture, … characteristics of the camera: focal length, pixel size,
resolution, …
characteristic of the software: requirements for image matching for orientation (camera pose estimation), dense point cloud extraction, mesh/DEM generation and orthophoto production.
predefined reference system, but also to control network deformation and improve metric accuracy.
The aim of this paper is (i) to analyse the precision achievable from set of short baseline images with simulated datasets and (ii) to try out the overall accuracy with real images. Examples showing how the precision changes in blocks and sequence, as well as the risk of precise reconstructions without metric accuracy (which are different concepts), are illustrated and discussed.
This paper is based on previous work in photogrammetric network design for terrestrial images, especially Fraser (1996). Several basic concepts and algorithms for network design are reused and revised for the particular case of short baseline images matched with SIFT-like algorithms.
2. NETWORK SIMULATION: THE CASE OF SHORT
BASELINE IMAGES
The quality of close-range image networks can be expressed in terms of precision and reliability. Reliability is intended as network diagnosis or checking for model error, whereas precision depends on network geometry and precision of image coordinates (Fraser, 1996).
Starting from the bundle adjustment formulation based on collinearity equations, the configuration problem (first order design, FOD) is the design of an optimal network geometry able to guarantee the required precision. The functional linear and stochastic models can be written as:
� = �� − �
��= � �− (1)
where v, x, and l are vectors of residuals, unknowns and observations, A is the design matrix, Cl is the covariance matrix, P the weight matrix and � the variance factor.
The solution x and its covariance matrix Cx are given by:
� = ���� − ����
��= � ���� − (2)
Simulation is intended as the estimation of Cx given the precision of image coordinates and the configuration of images around the object (exterior orientation parameters), as well as calibration parameters, for which only the focal length is considered in this work (principal point in the centre of the image, distortion-free images). The case of image points with the same precision is here taken into account, so that P becomes the identity matrix.
Starting from an approximate 3D model of the object, a set of 3D points (X, Y, Z) can be extracted to simulate (3D) point coordinates of tie points extracted with SIFT-like operators. The simulation is therefore carried out with a multi-step procedure:
creation of a set of 3D points from an approximate model of the object; starting from a geometrically simplified 3D of the object, a set of laser scans can be simulated. The scan can be randomly decimated to reach the desired number of 3D points;
selection of the acquisition stations, i.e. a set of camera stations defined by position and attitude for every image (exterior orientation parameters); the use of azimuth, elevation and roll angles (available in Australis 6) simplifies this step;
re-projection of 3D points on the image planes, given sensor size and focal length; this step provides (x, y) image coordinates; studies. Bundle adjustment requires a single iteration to estimate network precision. Cx is made up of variances and covariances of 3D points and exterior orientation parameters.
The simulations presented in the next sections were carried out assuming a full-frame camera (36mm ×24mm) and a 20 mm focal length. This replicate a Nikon D700. Three cases are discussed to take into account basic image configurations in terrestrial reconstructions: sequence of “normal” images (e.g. UAV sequence), sequence of convergent images capturing the same portion of the object (e.g. a mosaic on the ground), and 360° closed sequence (e.g. a statue). The software used is Australis 6 (http://www.photometrix.com.au/), described in Fraser and Edmunson (2000). Analysis and results discussed in this paper were carried out with a consideration in mind: software for automated 3D modelling from images could not use the mathematical formulation for image orientation presented in this paper. On the other hand, the proposed procedure allows one to obtain validated results which are representative of the precision achievable.
2.1 Straight sequence with short baseline images
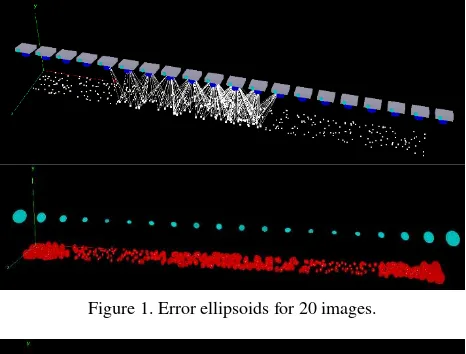
A sequence of “normal” images is a typical configuration of aerial and terrestrial projects. The extraction of tie points is a simple task for the lack of convergent images or scale variations. A simulation was carried out with 20 images over an area of 90m × 8m. 400 3D points provided an overall RMS of 11.3 mm in terms of object point precision.
Figure 1. Error ellipsoids for 20 images.
Figure 2. Error ellipsoids for 40 images.
the sequence, that is worse than in the middle for the smaller number of intersecting rays. Increasing the number of images leads to a stabilization of precision also for the beginning and end of the sequence (e.g. image acquisition has to “start before and finish after”) . with a different number of images and 3D points.
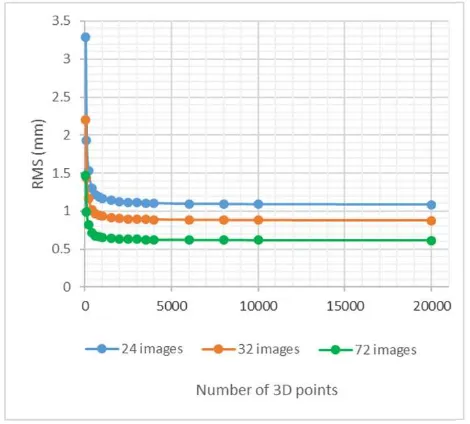
The first (obvious) consideration is that the use of short baseline images, as recommended in most software tutorials, improves also geometric precision. The second less obvious consideration is instead the relationship between the number of matched points and precision, which is shown in Figure 3.
The improvement of precision is significant for a small number of points (about 800), whereas a huge number of 3D points (more than 20,000) does not provide significant improvement. This means that a huge number of 3D points is not really necessary, whereas more attention should be paid to point position to guarantee a uniform distribution in the images. Error ellipsoids illustrate a worse precision along the Y axis (the direction of the optical axis), as expected. However, the value of the ratio RMS X /RMS Y (and RMS Z / RMS Y) is not constant and becomes stable whit a larger number of 3D points.
Figure 3. The relationship between number of 3D points and precision. A large number of points does not give a significant improvement of precision.
2.2 Closed sequence
A cylinder (radius 5 m, height 8 m) was converted into a set of randomly distributed 3D points (from 20 to 20,000). Point normals (nx,ny,nz) were also defined to provide target visibility. A closed sequence made up of 24 (Figure 4), 36 and 72 images was acquired around the cylinder.
Results in terms of RMS of image points are shown in Figure 5. Increasing the number of images (from 24 to 32) gives an overall increment of precision of a factor 1.3, whereas 72 images lead to a factor 1.8. The robust intersection in 3D space from multiple images allows one to reach a precision better than 1.5 mm, that is sufficient for most 3D projects when compared to chosen object size (R = 5000 mm, h = 8000 mm). 24 images equally spaced of 15° seems a good compromise for real projects in terms of precision. Such image configuration is also useful to complete the 3D model with dense image matching algorithms for 3D reconstruction.
Figure 5. Error ellipsoids in the case of a closed sequence.
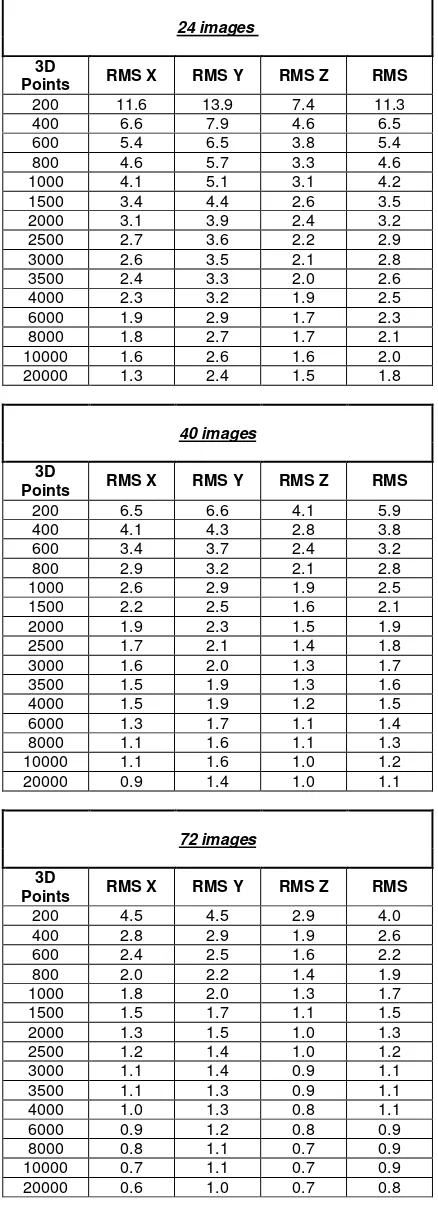
A huge number of 3D points for image orientation does not provide significant improvement of precision. Indeed, the precision simulated 600-800 3D points is very similar to the case of 20,000 3D points. Obviously, error ellipsoids tend to have an elongation along the optical axis of the camera. This means that reconstruction accuracy for tall objects (i.e. a tall statue) will be worse on top, where the ellipsoids tend to become tilted. Numerical results are shown in Table 2, whereas a graph is shown in Figure 6.
Figure 6. Precision of 3D points in the case of 24, 32 and 72 images forming a closed sequence.
images 24
3D Points RMS X RMS Y RMS Z RMS
200 3.6 3.6 2.5 3.3
400 2.1 2.1 1.5 1.9
600 1.6 1.7 1.3 1.5
800 1.4 1.4 1.1 1.3
1000 1.3 1.3 1.0 1.2
1500 1.3 1.2 1.0 1.2
2000 1.2 1.2 1.0 1.2
2500 1.2 1.2 1.0 1.1
3000 1.2 1.2 1.0 1.1
3500 1.2 1.2 1.0 1.1
4000 1.2 1.2 1.0 1.1
6000 1.2 1.2 1.0 1.1
8000 1.2 1.2 1.0 1.1
10000 1.1 1.1 1.0 1.1
20000 1.1 1.1 1.0 1.1
images 32
3D Points RMS X RMS Y RMS Z RMS
200 2.4 2.4 1.8 2.2
400 1.6 1.5 1.2 1.4
600 1.2 1.3 1.0 1.2
800 1.1 1.1 0.9 1.0
1000 1.0 1.0 0.8 1.0
1500 1.0 1.0 0.8 0.9
2000 1.0 1.0 0.8 0.9
2500 1.0 1.0 0.8 0.9
3000 0.9 0.9 0.8 0.9
3500 0.9 0.9 0.8 0.9
4000 0.9 0.9 0.8 0.9
6000 0.9 0.9 0.8 0.9
8000 0.9 0.9 0.8 0.9
10000 0.9 0.9 0.8 0.9
20000 0.9 0.9 0.8 0.9
images 72
3D Points RMS X RMS Y RMS Z RMS
200 1.6 1.6 1.2 1.5
400 1.1 1.1 0.8 1.0
600 0.9 0.9 0.7 0.8
800 0.8 0.8 0.6 0.7
1000 0.7 0.7 0.6 0.7
1500 0.7 0.7 0.6 0.7
2000 0.7 0.7 0.6 0.7
2500 0.7 0.7 0.6 0.6
3000 0.7 0.7 0.6 0.6
3500 0.7 0.7 0.6 0.6
4000 0.7 0.7 0.6 0.6
6000 0.7 0.7 0.6 0.6
8000 0.7 0.7 0.6 0.6
10000 0.6 0.6 0.6 0.6
20000 0.6 0.6 0.6 0.6
Table 2. Precision of 3D points for the closed sequence with a variable number of images and 3D points.
2.3 Closed sequence around a flat object
not difficult to expect a very high precision with the strong triangulation shown in Figure 7, more than sufficient considering the orientation requirements for 3D modeling projects with commercial software.
Figure 7. 3D view for a closed sequence around a flat object.
The simulated panel has a size of 20 m × 20 m. Simulation results by varying the number of 3D points are shown in table 3. Point error ellipsoids tend to become spheres and a significant stabilization of precision is reached for a limited number of points. It is interesting that precision improvement from 25 to 20,000 3D points is only 1.02%. This means that only a limited number of points (matched in the full sequence) is enough to guarantee very precise orientation results. This highlight the importance of matching strategies able to track the same point. At the same time, error ellipsoids for camera positions are significantly larger than point ellipsoids. Interpreting network quality from statistics on exterior orientation parameters is less simple than exploiting 3D point precision.
24 images
3D Points RMS X RMS Y RMS Z RMS
25 0.61 0.61 0.55 0.59
50 0.60 0.60 0.56 0.59
100 0.59 0.59 0.57 0.58
200 0.59 0.59 0.58 0.58
500 0.58 0.58 0.58 0.58
1000 0.58 0.58 0.58 0.58
2000 0.58 0.58 0.58 0.58
5000 0.58 0.58 0.58 0.58
10000 0.58 0.58 0.58 0.58
20000 0.58 0.58 0.58 0.58
Table 3. RMS for the closed sequence around a flat object. Precision does not depend on the number of 3D points.
3. DATUM PROBLEM AND ACCURACY
EVALUATION: THE CASE OF IMAGE SEQUENCES AND THEIR DEFORMATIONS
As described in Nocerino et al. (2014), long sequences of images processed without incorporating ground control points in a rigorous way could provide inaccurate results, much worse than the expected precision. This is a very important aspect because bundle adjustment statistics could be much better than real metric accuracy. Network deformations cannot be neglected for real projects based on free-network solutions. GCPs incorporated in the adjustment in a rigorous way allow one not only to solve the datum problem, but also to reduce and control network deformations.
3.1 Accuracy analysis of a straight sequence
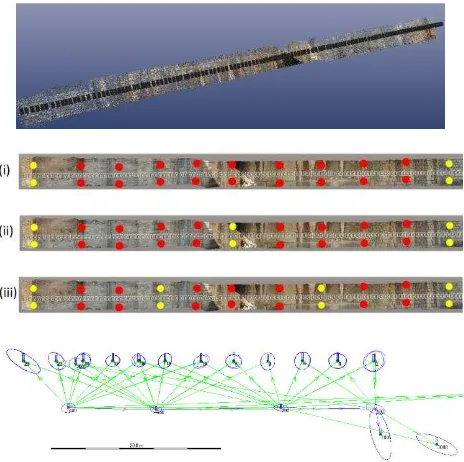
An experiment was carried out with a sequence of 123 images acquired with a Nikon D700 and a calibrated 20 mm lens, i.e. the camera used in the previous simulations. 24 targets were measured with a geodetic network and a total station Leica TS30, obtaining a reference dataset with a precision better than ±0.5 mm. Images were taken with a normal configuration and the covered area is 40 m × 2 m, the baseline is instead about 0.32 m.
Image processing was carried out with three software: PhotoModeler, PhotoScan and ContextCapture. As mentioned, the camera was previously calibrated by acquiring a set of images of an object with a good texture, following the rules presented in Remondino and Fraser (2006). The method followed the principle of markerless calibration presented in Barazzetti et al. (2011) and Stamatopoulos and Fraser (2014). For each software, calibration was carried out independently with the same image dataset.
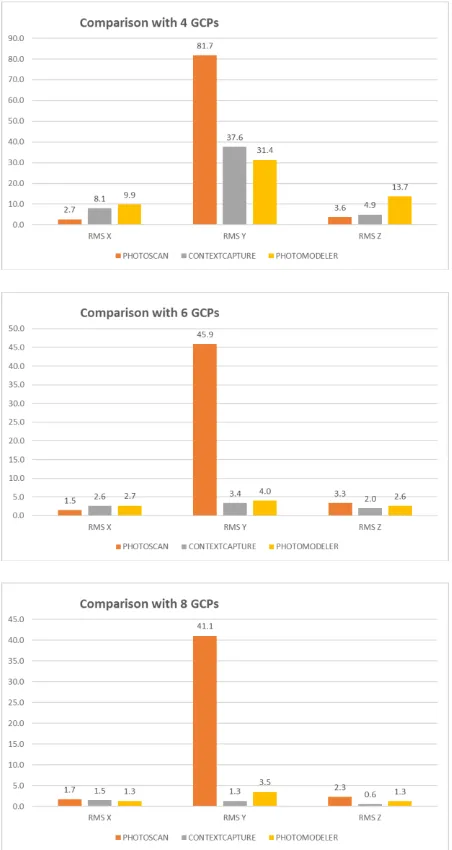
The images of the sequence were then processed in a fully automated way except for the manual measurements of targets in the images. Targets were used with the different configurations of GCPs and check points (CPs) shown in Fig. 8: (i) 4 GCPs at the start and end points and 20 CPs; (ii) 6 GCPs (start, end, middle) and 18 CPs, 8 GCP (equally spaced) and 16 CPs.
The RMS values on CPs provided the results shown in Figure 9. PhotoModeler and ContextCapture can incorporate GCP coordinates in the adjustment, whereas PhotoScan uses a rigid 7-parameter transformation for datum definition. This means that the deformation of the PhotoScan reconstruction cannot be removed. A significant error was found in the final model. PhotoModeler and ContextCapture highlight a bending effect, which is removed by adding GCPs in the sequence.
A comparison between the average GSD (ground sampling distance) and the obtained RMS of image points (about 0.3-0.6 pixels for all the software) demonstrates how network deformations are not negligible. Ground control points rigorously incorporated in the adjustment remains mandatory to control network deformation. As this aspect is not clear to all the users of photogrammetric reconstructions, the risk of precise reconstruction without metric integrity is very high.
Figure 9. RMS of check points for the different software.
After a visual inspection of figure 7, 8, and 9, a question arises: is PhotoScan so bad when compared to the other software? The aim of this experiment was to demonstrate that the 7-parameter transformation applied to a free-network bundle adjustment (similar to what happens in PhotoScan after the “alignment” step) can be the source of huge errors.
On the other hand, a function that is (sometimes) forgotten in PhotoScan is the “optimize camera alignment tool”, which can re-run image triangulation including ground control points to minimize errors on 3D coordinates. A final test was conducted after fixing calibration parameters, setting 3D point precision to 2 mm for total station points. Results on check points for the configuration with 8 GCPs are shown in Table 4, from which it evident the overall improvement of metric accuracy.
PhotoScan with 8 GCPs
Check points residuals (mm)
Before
optimization 1.7 41.1 2.0
After
optimization 2.4 1.1 2.7
Table 4. Results with Photoscan (mm) after using the optimize camera alignment tool.
3.2 Accuracy analysis of a closed sequence
The second experiment was carried out with the same camera/lens and 54 images acquired around a small church. The reference targets were measured with a Leica TS30 total station, obtaining a precision of about ±1 mm.
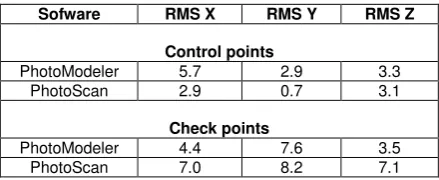
Image processing was carried out with PhotoModeler and PhotoScan (Fig.s 10 and 11). 8 GCPs were used for datum definition, whereas 8 CPs were used to estimate metric accuracy. Statistics are shown in Table 5. Both software provided good results. Although the PhotoScan sequence was rigidly registered with a 7-parameter transformation, the free-network solution was accurate, notwithstanding PhotoModeler results are better in terms of check point errors.
Figure 11. Geodetic network layout.
Sofware RMS X RMS Y RMS Z
Control points
PhotoModeler 5.7 2.9 3.3
PhotoScan 2.9 0.7 3.1
Check points
PhotoModeler 4.4 7.6 3.5
PhotoScan 7.0 8.2 7.1
Table 5. RMS values (mm) on control and check points for the closed sequence.
4. CONCLUSIONS
Nowadays, the word “automation” plays an important role in photogrammetric applications. The commercial market provide several solutions for automatic reconstruction from uncalibrated images. The opportunity to process images in a fully automated way is reducing the attention to important factors such as camera calibration, network geometry, processing time, and metric accuracy.
The risk of precise “crude reconstruction” of uncertain metric accuracy and reliability cannot be neglected. Ground control points rigorously incorporated in the adjustment process are mandatory to control network deformations, especially for long sequences. The use of a 7-parameter transformation (scale+rotation+translation) applied after a free-network adjustment can be the source of large errors, resulting in precise reconstructions without metric accuracy.
The paper described some simulations of photogrammetric projects carried out with short baseline images. Results reveal that the number of 3D points used during image orientation has very low impact on 3D point precision. Particular attention should be paid to guarantee a uniform point distribution in the images, rather than a large number of image points.
ACKNOWLEDGEMENTS
The author wants to thank Clive Fraser for providing a trial version of Australis 6.06, which was used for the simulation presented in the paper. Special thank go to Fabio Roncoroni and Luca Rota Graziosi for the help in the “wall” sequence. This work has been supported by the GAMHer project: Geomatics Data Acquisition and Management for Landscape and Built Heritage in a European Perspective, PRIN: Progetti di Ricerca di Rilevante Interesse Nazionale – Bando 2015, Prot. 2015HJLS7E.
REFERENCES
Barazzetti, L., Mussio L., Remondino F., Scaioni M., 2011. Targetless camera calibration. Int. Archives of Photogrammetry, Remote Sensing and Spatial Information Sciences (IAPRSSIS), 38-5/W16, March 2-5, Trento, Italy
Bay, H., Ess, A., Tuytelaars, T. and van Gool, L., 2008. Speeded-up robust features (SURF). Computer Vision and Image Understanding, 110(3): 346-359.
Fraser, C.S., 1996. Network Design. In K.B. Atkinson, editor, Close Range Photogrammetry and Machine Vision, chapter 9, pages 256-281. Whittles Publishing, Roseleigh House, Latheronwheel, Caithness, KW5 6DW, Scotland, UK
Fraser, C.S., Edmundson, K.L., 2000. Design and Implementation of a Computational Processing System for Off-Line Digital Close-Range Photogrammetry. ISPRS Journal of Photogrammetry & Remote Sensing, 55(2): 94-104.
Lowe, D.G., 2004. Distinctive image features from scale-invariant keypoints. International Journal of Computer Vision, 60(2): 91-110.
Nocerino, E., Menna, F., Remondino F., 2014. Accuracy of typical photogrammetric networks in cultural heritage 3D modelling projects. The Int. Arch. Photogramm. Remote Sens. Spat. Inf. Sci., Volume XL-5, 465-472.
Remondino, F., Fraser, C., 2006. Digital camera calibration methods: Considerations and comparisons. Int. Arch. Photogramm. Remote Sens. Spat. Inf. Sci.; 36: 266–272.
Stamatopoulos, C., Fraser, C.S., 2014. Automated Target-Free Network Orientation and Camera Calibration. Int. Arch. Photogramm. Remote Sens. Spat. Inf. Sci. 2014;1:339–346
Eos System PhotoModeler. [(accessed on 27 January 2015)]. Available online: http://www.photomodeler.com/
Agisoft PhotoScan. [(accessed on 27 January 2015)]. Available online: http://www.agisoft.com