Simultaneous estimation of daily solar radiation and humidity
from observed temperature and precipitation: an application
over complex terrain in Austria
Peter E. Thornton
a,∗, Hubert Hasenauer
b,1, Michael A. White
aaNumerical Terradynamic Simulation Group, School of Forestry, University of Montana, Missoula, MT 59812, USA bInstitut für Waldwachstumsforschung, Universität für Bodenkultur, Peter-Jordan-Straße 82, A-1190 Wien, Austria
Received 7 February 2000; received in revised form 16 June 2000; accepted 16 June 2000
Abstract
Using daily observations of temperature, precipitation, radiation, and humidity from 24 stations spanning a large elevation gradient in Austria, we tested several previously defined algorithms for estimating daily radiation and humidity. The estimation algorithms were first tested independently, and then combined, resulting in a combined algorithm for estimating both radiation and humidity that relies only on temperature and precipitation inputs. Mean absolute errors (MAE) for joint radiation and humidity estimates were 2.52 MJ m−2per day and 85.6 Pa, respectively, close to values reported for the algorithm development
studies. Biases were low:+0.02 MJ m−2per day and+28.2 Pa for radiation and humidity, respectively. Initial results showed biases in estimated radiation related to horizon obstruction and snowpack. We amended the original algorithm, successfully eliminating these effects. Annual prediction MAE was weakly correlated with elevation, and annual bias was not correlated with elevation. Analysis of seasonal patterns in error-elevation relationships showed several periods with significant trends. Radiation MAE was slightly higher in mid-summer for higher elevations, and radiation biases were in general closer to zero throughout the spring and summer at higher elevations. Humidity estimates showed an increased MAE and positive bias at higher elevations in winter. We concluded that the effect of different temperature lapse rates for daily maximum and minimum temperature on the relationship between diurnal temperature range and atmospheric transmittance does not seriously impair predictions over steep elevation gradients in complex terrain. © 2000 Elsevier Science B.V. All rights reserved.
Keywords: Solar radiation; Humidity; Temperature; Lapse rate; Snowcover; Biometeorology
1. Introduction
Radiation and humidity are essential environmen-tal driving variables for many land surface processes,
∗Corresponding author. Tel.:+1-406-243-4326; fax:+1-406-243-4510.
E-mail addresses: [email protected] (P.E. Thornton),
[email protected] (H. Hasenauer).
1Tel.:+43-1-47654-4205; fax:+43-1-47654-4242.
but systematic measurements of these variables over large areas are scarce compared to measurements of temperature and precipitation (Running et al., 1987; Scheifinger and Kromp-Kolb, 2000). Computer sim-ulation of terrestrial ecosystem processes over large regions depends on accurate estimates of radiation and humidity, as well as temperature and precipita-tion (VEMAP Members, 1995). Given observaprecipita-tions of daily maximum and minimum temperature (Tmax and Tmin) and daily total precipitation, previous 0168-1923/00/$ – see front matter © 2000 Elsevier Science B.V. All rights reserved.
studies have shown that accurate daily total radiation estimates can be obtained by using additional observa-tions of daily humidity (Thornton and Running, 1999, hereafter TR), and that accurate humidity estimates can be obtained by using additional observations of daily radiation (Kimball et al., 1997). For greatest utility, estimates of radiation and humidity must be made simultaneously, and must rely only on temper-ature and precipitation observations. TR suggested a linked radiation-humidity estimation algorithm but did not show it in operation. Our objective here was to develop such a linked algorithm and test it against a new set of radiation and humidity observations from an area outside the original calibration region.
We used data from a network of meteorological observation sites in Austria spanning a large eleva-tion gradient (153–3105 m). We chose this network in part because TR suggested two possible problems with the radiation algorithm that could be addressed by a network of observations in complex terrain. First, it appeared that stations in snowy climates had an underprediction bias related to the presence and possibly the amount of snow on the ground. Multiple reflections between a snowpack and the atmosphere are known to influence incident shortwave radiation (Sellers, 1992), and observations of snowpack across the Austrian network permitted a more detailed analy-sis of this effect. Second, the use of the TR algorithm in complex terrain might introduce biases related to differential elevation gradients in maximum and mini-mum temperature. Since the TR algorithm is sensitive to the diurnal temperature range (1T=Tmax−Tmin), and since the elevation lapse rates for Tmaxand Tmin are usually different, it is not clear that a single set of parameters for the algorithm will be adequate for radiation estimates over steep elevation gradients. Observations of temperature, precipitation, radiation, and humidity from the Austrian network cover a large elevation gradient with a relatively high station den-sity, providing a unique opportunity to explore these questions.
Earlier implementations of the radiation algorithm recognized the importance of obstructed horizons on estimated radiation (Running et al., 1987; Glassy and Running, 1994). This effect was not considered in the TR analysis, since the observations were mostly from flat terrain, but we considered it here. Finally, we assessed two approaches to the estimation of
humidity, and demonstrated the influence of joint humidity-radiation prediction on estimation errors when only temperature and precipitation observations are available.
In summary, our main objectives were to evalu-ate the TR radiation algorithm with an independent dataset, extend the algorithm if necessary, incorpo-rate a joint estimation of humidity, and assess pos-sible components of error for the Austrian climate conditions.
2. Data
We obtained, from 24 Austrian weather stations, daily surface weather records consisting of observa-tions of daily maximum and minimum near-surface air temperature, daily total precipitation, daily to-tal global shortwave radiation, and near-surface air temperature and relative humidity at 07.00 h. We calculated water vapor pressure at 07.00 h from the temperature and relative humidity data (Abbott and Tabony, 1985). We assumed that the diurnal changes in water vapor pressure are small, and so used a single value of vapor pressure (VP, Pa) for each day.
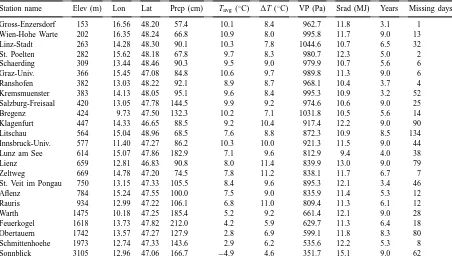
From the period of record at each station, we ex-tracted the longest period having complete temper-ature, precipitation, and humidity data. Precipitation recorded as ‘trace’ was replaced with 0.0 cm. Some stations had missing radiation observations within the retained period of record. Station locations, clima-tological data, retained periods of record, and num-bers of missing radiation observations are listed in Table 1.
3. Methods
3.1. Initial radiation estimates
Using observed temperature, precipitation, and hu-midity, we made initial radiation estimates following exactly the algorithm described in TR. For reference, the primary expressions for prediction of daily total global radiation on a horizontal surface (Rgh, MJ m−2 per day) are reproduced here:
Table 1
Site locations and climatological summariesa
Station name Elev (m) Lon Lat Prcp (cm) Tavg(◦C) 1T (◦C) VP (Pa) Srad (MJ) Years Missing days
Gross-Enzersdorf 153 16.56 48.20 57.4 10.1 8.4 962.7 11.8 3.1 1
Wien-Hohe Warte 202 16.35 48.24 66.8 10.9 8.0 995.8 11.7 9.0 13
Linz-Stadt 263 14.28 48.30 90.1 10.3 7.8 1044.6 10.7 6.5 32
St. Poelten 282 15.62 48.18 67.8 9.7 8.3 980.7 12.3 5.0 2
Schaerding 309 13.44 48.46 90.3 9.5 9.0 979.9 10.7 5.6 6
Graz-Univ. 366 15.45 47.08 84.8 10.6 9.7 989.8 11.3 9.0 6
Ranshofen 382 13.03 48.22 92.1 8.9 8.7 968.1 10.4 3.7 4
Kremsmuenster 383 14.13 48.05 95.1 9.6 8.4 995.3 10.9 3.2 52
Salzburg-Freisaal 420 13.05 47.78 144.5 9.9 9.2 974.6 10.6 9.0 25
Bregenz 424 9.73 47.50 132.3 10.2 7.1 1031.8 10.5 5.6 14
Klagenfurt 447 14.33 46.65 88.5 9.2 10.4 917.4 12.2 9.0 90
Litschau 564 15.04 48.96 68.5 7.6 8.8 872.3 10.9 8.5 134
Innsbruck-Univ. 577 11.40 47.27 86.2 10.3 10.0 921.3 11.5 9.0 44
Lunz am See 614 15.07 47.86 182.9 7.1 9.6 812.9 9.4 4.0 38
Lienz 659 12.81 46.83 90.8 8.0 11.4 839.9 13.0 9.0 79
Zeltweg 669 14.78 47.20 74.5 7.8 11.2 838.1 11.7 6.7 7
St. Veit im Pongau 750 13.15 47.33 105.5 8.4 9.6 895.3 12.1 3.4 46
Aflenz 784 15.24 47.55 100.0 7.5 9.0 835.9 11.4 5.3 12
Rauris 934 12.99 47.22 106.1 6.8 11.0 809.4 11.3 6.1 12
Warth 1475 10.18 47.25 185.4 5.2 9.2 661.4 12.1 9.0 28
Feuerkogel 1618 13.73 47.82 212.0 4.2 5.9 629.7 11.3 6.4 18
Obertauern 1742 13.57 47.27 127.9 2.8 6.9 599.1 11.8 8.3 80
Schmittenhoehe 1973 12.74 47.33 143.6 2.9 6.2 535.6 12.2 5.3 8
Sonnblick 3105 12.96 47.06 166.7 −4.9 4.6 351.7 15.1 9.0 62
aElevation, longitude and latitude (Lon and Lat, decimal degrees), annual total precipitation (Prcp), average near-surface air tem-perature (Tavg), average near-surface diurnal temtem-perature range (1T), average vapor pressure (VP), average daily total incident
short-wave radiation (Srad), years of record used in this study (years), number of days with missing radiation data during this period (missing days).
where Rpot is the daily total top-of-the-atmosphere radiation on a horizontal surface (MJ m−2 per day),
Tt,max the maximum (cloud-free) daily total trans-mittance at a location with a given elevation and near-surface water-vapor pressure on a given yearday,
Tf max the proportion of Tt,max realized on a given day (cloud correction), Rpot, s the instantaneous
po-tential horizontal radiation at solar time s, sr and ss are times of sunrise and sunset, t0,nadir,drythe instan-taneous transmittance at sea level, at nadir, for a dry
atmosphere (unitless), Pz and P0 are the surface air pressures at elevation z and at sea level, mθ the optical
air mass at solar zenith angleθ,α(Pa−1) a parameter describing the effect of VP on Tt,max, B and C are pa-rameters describing the effect of diurnal temperature range (Tmax−Tmin=1T) on daily total transmittance,
1T a 30-day moving average of1T, and b0, b1, and
b2 are empirical parameters controlling the shape of the relationship between1T and B.
We used standard methods to estimate Rpot, ss, sr,
Pz, P0, and mθ (Thornton and Running, 1999). The
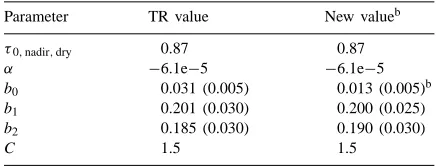
Table 2
Radiation algorithm parametersa
Parameter TR value New valueb
τ0,nadir,dry 0.87 0.87
α −6.1e−5 −6.1e−5
b0 0.031 (0.005) 0.013 (0.005)b
b1 0.201 (0.030) 0.200 (0.025)
b2 0.185 (0.030) 0.190 (0.030)
C 1.5 1.5
aValues from the original algorithm description (TR), and new parameters optimized for the Austrian data. Standard errors in parentheses for parameters estimated by regression. See text for parameter descriptions. Parameters are dimensionless, except α
which has units Pa−1.
bParameter with new value significantly different from TR value (P<0.05).
3.2. Horizon angles
We know from firsthand knowledge of the sites in the Austrian network that radiation observations at many stations are influenced by obstructed horizons, so that direct radiation is blocked during part of the time when the solar elevation angle is greater than zero. This effect was not included in the algorithm from TR, since most of the stations for that study are in flat terrain, and so the radiation estimates from the TR algorithm are likely to have a positive bias. We did not have available the detailed descriptions of site geometry required to make accurate calculations of the horizon angles as a function of solar azimuth. We did have hourly data for a number of years from each station which showed the fraction of each hour with direct radiation. From this data we selected at each station a subset of days distributed across the seasonal cycle with the longest recorded period of direct ra-diation. We took these to be cloudless days, and as-sumed the differences in duration of direct radiation from flat-horizon calculations to be due to horizon ob-structions. Horizon angle (H) was then estimated as a function of daylength receiving direct radiation (tdir, s), site latitude (L), and declination (d):
H=90.0−acos
where spd is the number of seconds per degree of hour angle (spd=240.0). We estimated a single horizon
elevation angle for each station by averaging the hori-zon angles inferred from recorded daylengths over the seasonal cycle (Table 3).
Using these average horizon angles, we again es-timated the daily radiation for each station over the retained period of record. This algorithm includes a separation of the incident radiation between direct and diffuse components, with no direct component when the solar elevation angle is smaller than the horizon angle, and the diffuse component scaled to take ac-count of the sky fraction obscured by the average hori-zon (Appendix B). All parameters were maintained as in TR. We calculated MAE and bias for comparison with results without horizon angle correction.
3.3. Snowpack
The presence of snowpack increases incident short-wave radiation through multiple reflections between the high-albedo snow-covered surface and the atmo-sphere, effectively increasing the diffuse component of global radiation (Meek, 1997; Ellis and Leathers, 1999). We expected this effect to be important for many of the Austrian stations, so we examined the bias in radiation predictions as a function of site snow-pack in hopes of identifying a consistent pattern in the biases which could be easily corrected. We had snow-pack observations for multiple years at only three sites (Obertauern, Feuerkogel, and Schmittenhoehe), but we were able to use a very simple temperature-based snowmelt model (after Running and Coughlan, 1988), calibrated at these three sites, to estimate snowpack at all sites. The simple snow model operates on a daily time step, accumulating snow for precipitation events on days with (Tmax+Tmin)/2.0<0.0◦C, and melting snow at a calibrated rate (r, cm◦C−1 per day) when
Tmin is above a calibrated threshhold (Tcrit,◦C). We chose this very simple formulation for the snowpack model in order to maintain independence from the radiation and humidity data, two variables that are usually included in more sophisticated snowpack models.
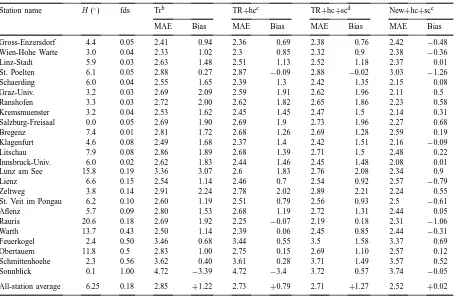
Table 3
Radiation estimation resultsa
Station name H (◦) fds Trb TR+hcc TR+hc+scd New+hc+sce
MAE Bias MAE Bias MAE Bias MAE Bias
Gross-Enzersdorf 4.4 0.05 2.41 0.94 2.36 0.69 2.38 0.76 2.42 −0.48
Wien-Hohe Warte 3.0 0.04 2.33 1.02 2.3 0.85 2.32 0.9 2.38 −0.36
Linz-Stadt 5.9 0.03 2.63 1.48 2.51 1.13 2.52 1.18 2.37 0.01
St. Poelten 6.1 0.05 2.88 0.27 2.87 −0.09 2.88 −0.02 3.03 −1.26
Schaerding 6.0 0.04 2.55 1.65 2.39 1.3 2.42 1.35 2.15 0.08
Graz-Univ. 3.2 0.03 2.69 2.09 2.59 1.91 2.62 1.96 2.11 0.5
Ranshofen 3.3 0.03 2.72 2.00 2.62 1.82 2.65 1.86 2.23 0.58
Kremsmuenster 3.2 0.04 2.53 1.62 2.45 1.45 2.47 1.5 2.14 0.31
Salzburg-Freisaal 0.0 0.05 2.69 1.90 2.69 1.9 2.73 1.96 2.27 0.68
Bregenz 7.4 0.01 2.81 1.72 2.68 1.26 2.69 1.28 2.59 0.19
Klagenfurt 4.6 0.08 2.49 1.68 2.37 1.4 2.42 1.51 2.16 −0.09
Litschau 7.9 0.08 2.86 1.89 2.68 1.39 2.71 1.5 2.48 0.22
Innsbruck-Univ. 6.0 0.02 2.62 1.83 2.44 1.46 2.45 1.48 2.08 0.01
Lunz am See 15.8 0.19 3.36 3.07 2.6 1.83 2.76 2.08 2.34 0.9
Lienz 6.6 0.15 2.54 1.14 2.46 0.7 2.54 0.92 2.57 −0.79
Zeltweg 3.8 0.14 2.91 2.24 2.78 2.02 2.89 2.21 2.24 0.55
St. Veit im Pongau 6.2 0.10 2.60 1.19 2.51 0.79 2.56 0.93 2.5 −0.61
Aflenz 5.7 0.09 2.80 1.53 2.68 1.19 2.72 1.31 2.44 0.05
Rauris 20.6 0.18 2.69 1.92 2.25 −0.07 2.19 0.18 2.31 −1.06
Warth 13.7 0.43 2.50 1.14 2.39 0.06 2.45 0.85 2.44 −0.31
Feuerkogel 2.4 0.50 3.46 0.68 3.44 0.55 3.5 1.58 3.37 0.69
Obertauern 11.8 0.5 2.83 1.00 2.75 0.15 2.69 1.10 2.57 0.12
Schmittenhoehe 2.3 0.56 3.62 0.40 3.61 0.28 3.71 1.49 3.57 0.52
Sonnblick 0.1 1.00 4.72 −3.39 4.72 −3.4 3.72 0.57 3.74 −0.05
All-station average 6.25 0.18 2.85 +1.22 2.73 +0.79 2.71 +1.27 2.52 +0.02 aFirst two columns show the estimated horizon angle (H) and the fraction of days with snow cover (fds).
bPreliminary radiation estimates (TR) without horizon or snow corrections. cOriginal algorithm parameters, with horizon correction (TR+hc).
dOriginal algorithm parameters, with horizon and snow corrections (TR+hc+sc).
eNew b0, with horizon and snow corrections (new+hc+sc). Units for all MAE and bias results are MJ m−2 per day.
with increasing snowpack, at least for low snowpack amounts, due to increasing regional fractional snow-cover (Sellers, 1992). To test this we grouped the days with snowpack in specified ranges (bins) from all stations together, calculated the mean bias for each bin, and examined the relationship for significant trends.
3.4. Parameterization of radiation algorithm
TR suggested that the parameters used to estimate
Tt,maxshould not vary greatly with climate or latitude, since the derivation of these relationships is largely mechanistic. On the other hand, the parameters used to estimate Tf maxwere shown to have significant climatic
variation, and the single set of default parameters from TR is likely to produce biased results for some cli-mates. In particular, TR identified a gradient between stations with summer-maximum and winter-maximum precipitation that has a strong influence on the best-fit parameters for Eq. (2). We expected that some modi-fication of the default parameters from TR would pro-duce lower bias and smaller MAE for predictions in the Austrian climate.
radiation again with the new parameters and calcu-lated MAE and bias for comparison.
3.5. Humidity estimates
We tested two approaches for estimating humid-ity (vapor pressure), one simple and the other more complex. The simple method is based on the assump-tion that the nighttime minimum temperature approx-imately equals the dewpoint temperature. Assuming that dewpoint temperature is constant through the day, then Tmin=Tdew can be used to estimate the daily average water vapor pressure (Running et al., 1987; Hungerford et al., 1989). The more complex method is that presented by Kimball et al. (1997), which was designed to correct biases in the Tdew=Tminapproach for arid climates. The simple approach relies only on observations of Tmin, while the complex approach re-quires annual precipitation and daily radiation as ad-ditional inputs. For preliminary tests we used the ob-served Rgh to estimate VP with the complex method, recognizing that for the complex humidity approach an iterative solution would be required to perform joint estimates of radiation and humidity, since they depend on each other. We calculated MAE and bias in humid-ity predictions from these two methods and compared them to determine which was the most appropriate for the Austrian climate.
3.6. Joint radiation-humidity estimates
Following an assessment of the most appropriate humidity prediction algorithm, we performed a joint prediction of radiation and humidity using only the temperature and precipitation observations as input. The procedure for estimating radiation and humidity jointly is simpler when the simple humidity method is used than when the arid correction method is used. For the arid correction method, humidity predictions depend on radiation (to estimate PET), and radiation estimates depend on humidity (to correct Tt,max for water vapor effects), so an iterative solution is re-quired. The simple humidity method, on the other hand, depends only on Tminso the joint estimation is straightforward: first estimate Tdewfrom Tmin, convert
Tdewto VP, then estimate Rghusing VP. We calculated MAE and bias to assess the loss in predictive ability
when both radiation and humidity observations are unavailable.
3.7. Application in complex terrain
Methods for estimating daily radiation and humid-ity are especially useful in regions of complex terrain where instrument installation and maintenance is diffi-cult. The radiation and humidity estimation algorithms considered here were developed using mostly stations from flat terrain. The Austrian database provided an opportunity to test for trends in prediction bias when these methods were applied over steep elevation gra-dients in complex terrain.
The environmental temperature lapse rate (decrease in near-surface air temperature with increase in el-evation) is usually greater for Tmax than for Tmin, resulting in smaller values of1T at higher elevations
(Thornton et al., 1997). The combined influence of persistently lower 1T in Eqs. (1) and (2) is on
av-erage to reduce Tf max, reducing Rgh for a given Rpot and Tt,max. This tendency to predict lower Tf max with increasing elevation will be offset by increases in Tt,maxdue to lower vapor pressure and optical air mass at higher elevations.
The relationship between lapse rates for Tmax and
Tmin varies seasonally, and so it is also important to test for differences in elevation-error trends over time. To do this we first calculated a time series of MAE and bias for one seasonal cycle at each station, averaging results from multiple years in the retained period of record. We then estimated the elevation trend in MAE and bias for data from a moving window of yeardays to assess both the overall elevation trends and the sea-sonal patterns in these trends.
4. Results
4.1. Initial radiation estimates
respectively. A recent study by Lexer (1997) of sea-sonal patterns of transmissivity in Austria produced a model of radiation for this region with MAE of 3.2 MJ m−2per day.
4.2. Horizon angles
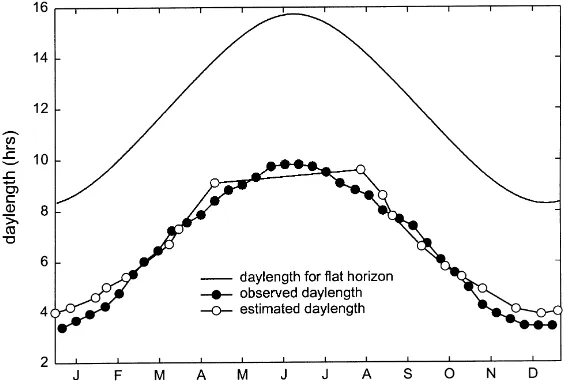
The positive bias in preliminary radiation estimates was due in part to having ignored the influence of obstructed horizons. The average horizon obstruction calculated for the 24 Austrian stations was 6.3◦, rang-ing from 0.0 to 20.6◦ (Table 3). As a check on our methods for estimating horizon angle, we obtained measurements for the time the sun was above the lo-cal horizon at a station which was predicted to have a large average horizon angle (Rauris). The estimated seasonal cycle of daylength using the hourly direct radiation data (available for all stations) compared well with the independent measurements at this station (Fig. 1). The estimated daylength is sometimes longer and sometimes shorter than observed, with the errors distributed symmetrically around the solstices, which is the expected case if the horizons are not smooth.
MAE and bias from predictions of Rgh includ-ing the influence of horizon angle were 2.73 and +0.79 MJ m−2 per day, respectively, or a 4% reduc-tion in MAE and a 35% reducreduc-tion in bias from the preliminary predictions (Table 3). We performed a
Fig. 1. Predicted vs. observed daylength for the Rauris station. Upper solid line shows daylength for a flat horizon; (d) observed daylength
for sun above true horizon; (s) estimated daylength from sunshine hours data.
multiple linear regression of estimation bias by sta-tion against both estimated horizon angle and fracsta-tion of days with snow. We found that the influence of horizon angle on bias was significant and with the ex-pected sign before horizon corrections were applied, and insignificant after correction (Table 4, algorithms TR and TR+hc, respectively).
4.3. Snowpack
Fitting parameters of our simple snow model to the data from three stations gave values of−6.0◦C and 0.042 cm◦C−1per day for the threshold temperature (Tcrit) and the temperature-driven snowmelt rate (r), respectively. MAE and bias for snowpack predictions using this model were 3.91 and 0.06 cm, respectively, based on days with either observed or predicted snow-pack. The average observed snowpack for days with snow from these three stations was 8.5 cm, with stan-dard deviation of 5.8 cm and peak seasonal snowpack between 20 and 35 cm.
Table 4
Multiple regression results for radiation estimation bias versus estimated horizon angle and fraction of days with snow cover [bias=a+b1(H)+b2(fds)]a
Algorithmb a b
1 b2
Value (S.E.) P Value (S.E.) P Value (S.E.) P
TR 1.43 (0.25) <0.01 0.08 (0.03) <0.01 −3.59 (0.57) <0.01
TR+hc 1.57 (0.26) <0.01 −0.01 (0.03) 0.31 −3.59 (0.57) <0.01 TR+hc+sc 1.57 (0.21) <0.01 −0.03 (0.02) 0.16 −0.43 (0.46) 0.36
New+hc+sc 0.18 (0.21) 0.39 −0.03 (0.02) 0.16 0.29 (0.46) 0.54
aStandard errors for each parameter in parentheses. bAlgorithm identifiers as in Table 3.
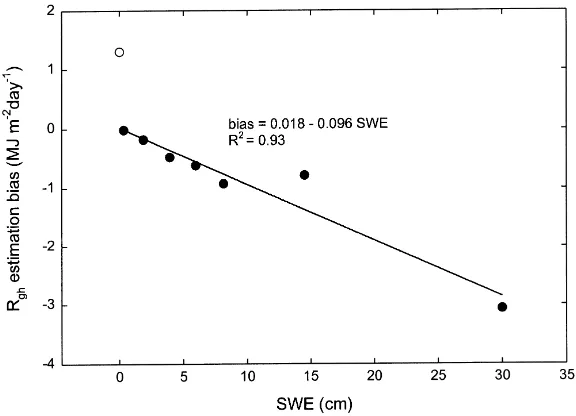
with snow cover had a negative bias (−1.20 MJ m−2 per day), with a significant difference between means (P<0.001). Grouping snow days from all stations to-gether in bins by snow water equivalent (SWE), we found a strong relationship between snow amount and radiation prediction bias (Fig. 2). The shape of this relationship agreed with the expectation of increased observed Rghdue to multiple reflections when there is any snow cover, and an increasingly strong effect as SWE increases, due to higher regional fractional snow cover. There was an abrupt negative shift in prediction bias between the no-snow bin and the first snow bin (average SWE=0.33 cm), suggesting that the presence
Fig. 2. Radiation estimation bias vs. snow water equivalent (SWE). Points are from SWE estimated by the simple snow model, binned for all station-days. Special bin for days with no snowpack, (s) n=45572. Regression based on bins from days with snowpack; (d) total n
for these seven bins=11515, n by bin in order of increasing SWE=[2824, 1680, 833, 789, 721, 1092, 3576]).
of snow, regardless of amount, had an important effect. The effect increased linearly up to SWE of 10 cm.
of 37.5 cm on all days at Sonnblick for the purpose of deriving a correction factor for the snow effect.
There was a significant positive bias for the no-snow days (Fig. 2), which is most likely related to the use of the TR default parameters. It is clear from Fig. 2 that there is a significant difference in the estimation bias between no-snow days and the lowest bin of snow days, indicating that the presence of any snow has an important impact on the radiation environment. The bias still evident for the no-snow days is assumed to be contributed by other factors that are addressed in the reparameterization exercise described later. Based on the regression shown in Fig. 2 for the snow days, and accounting for the offset of this reference bias, we added the following correction factor to Rgh on each day with predicted snow cover:
sc=1.32+0.096(SWE)
where sc is the additive correction (MJ m−2per day) and SWE is limited to a maximum of 30 cm, the aver-age value for the highest bin in Fig. 2. After applying this correction, the MAE and bias for estimated radi-ation were 2.71 and +1.27 MJ m−2 per day, respec-tively, or a 1% reduction in MAE, but a 61% increase in bias from the case with only horizon corrections applied (see Section 5). Multiple regression results (Table 4, algorithm TR+hc+sc) indicated that we had successfully eliminated the influence of both horizon angle and snow cover on the estimation bias. The significant intercept showed that a component of bias remained that was not related to either of these factors.
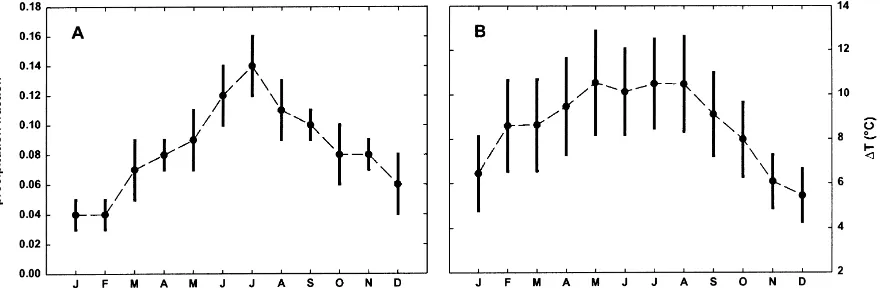
Fig. 3. Monthly climate parameters averaged over all stations. Bars show +/− one standard deviation, (A) fraction of annual total precipitation falling in each month; (B) monthly average1T.
4.4. Parameterization of radiation algorithm
We suspected that this remaining bias was mostly due to the use of the default parameterization of the ba-sic equations from TR. TR suggested that the season-ality of precipitation and the seasonseason-ality of the diurnal temperature range (1T) affect the optimal
parame-terization of Eq. (2). The Austrian stations showed a spatially consistent pattern of summer-maximum precipitation and summer-maximum1T (Fig. 3). TR
noted a gradient in optimal parameters for Eq. (2) between stations having summer-maximum precip-itation with winter-maximum 1T (Florida), and
stations having winter-maximum precipitation with summer-maximum1T (western Oregon). The climate
for the Austrian stations is orthogonal to this gradient, making prediction of the likely parameterization bias difficult.
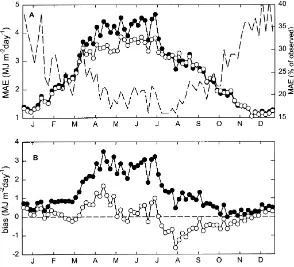
Fig. 4. Radiation error statistics, before (d) and after (s) reparameterization of b0, (A) MAE (5-day average) over all stations. Dashed
line shows MAE as a percentage of the observed Rghfor estimates with new value of b0; (B) estimation bias (5-day average) over all stations, dashed line shows zero bias.
respectively; a 7% reduction in MAE from the case with only horizon and snow corrections, and an almost complete elimination of the annual estimation bias.
We examined the seasonal patterns of radiation es-timation MAE and bias before and after changing b0 (Fig. 4). Reparameterization greatly reduced the mag-nitude of the bias and eliminated a broad peak in MAE and bias that extended from April to July. The result-ing seasonal pattern was very similar to that found for the pooled US data, with low bias in the winter, a peak of positive bias in the spring, and a peak of negative bias in the mid-summer. Although there was a mid-summer peak in MAE when expressed in abso-lute units, MAE expressed as a percentage of Rghwas highest in the winter (Fig. 4A, dashed line), as was also found for the pooled US data.
4.5. Humidity predictions
Results from the two humidity algorithms showed that humidity prediction errors were slightly lower
Fig. 5. Vapor pressure estimation bias over all stations (5-day average) for the simple (s) and complex (d) humidity algorithms, dashed line shows zero bias.
4.6. Joint radiation-humidity predictions
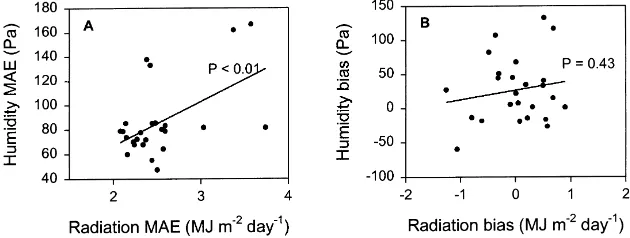
Since humidity estimates do not depend on radi-ation, joint estimation errors for humidity were un-changed from those already reported. The joint es-timation errors for radiation increased, due to errors in estimated humidity used to estimate Tt,max. We found that this additional source of error was very small: MAE and bias for radiation estimates from joint prediction of humidity and radiation were 2.54 and +0.03 MJ m−2per day, respectively, or<1% increase in radiation MAE due to error in humidity estimates. Fig. 6 shows the correlation between station-average estimation errors for radiation and humidity. Results for MAE are shown in Fig. 6A, where the significant positive slope indicates that higher absolute errors for radiation are correlated with higher absolute errors for humidity. Two high-elevation stations, Feuerko-gel and Schmittenhoehe, have large errors for both radiation and humidity and are responsible for the
Fig. 6. Correlation between station-average estimation errors for radiation and humidity, using results from the joint radiation-humidity estimation algorithm, (A) MAE; (B) bias.
strong statistical significance of the relationship. The station-average biases for radiation and humidity are not significantly correlated (Fig. 6B). This suggests that the correlation in MAE is not due to an interaction effect between radiation and humidity predictions, since the expected pattern for an interaction effect would be a positive bias in humidity corresponding to a negative bias in radiation, through the influence of humidity on Tt,max.
4.7. Trends with elevation
Environmental lapse rates for Tmaxand Tminshowed a pattern very similar to that found for a collection of stations in the northwestern US by Thornton et al. (1997). Tminlapse rates were closer to zero than were
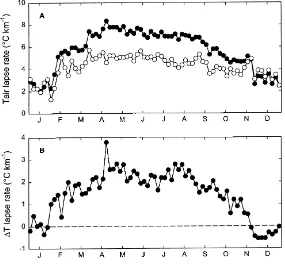
Fig. 7. Seasonal pattern of lapse rates for (A) Tmax(d) and Tmin(s), and (B)1T. Lapse rates at each 5-day period calculated as negative
slope from regression of station average temperature (or1T) for the period from all years of record against station elevation. Note that
positive values indicate a decrease in temperature (or1T) with increasing elevation. Dashed line in B shows zero lapse rate.
lapse rates is also the lapse rate for 1T (Fig. 7B),
which was near zero in mid-winter and increased to a broad peak around 2.5◦C/km through the summer.
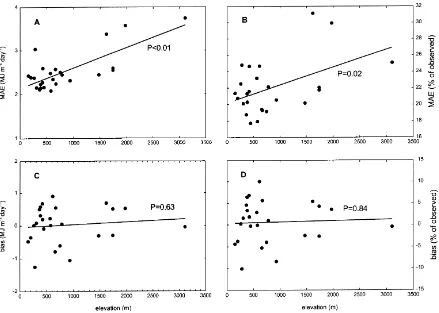
There was a significant increase in the MAE of esti-mated annual radiation for stations at higher elevation. This trend was due in part to higher radiation loads at the higher stations, as evidenced by a decrease in sig-nificance when MAE was expressed as a percentage of the observations (Fig. 8A and B). There was no signif-icant elevational trend in annual bias (Fig. 8C and D). There was a consistent increase in radiation MAE with elevation over the entire year (Fig. 9A), but this trend was mostly due to higher radiation loads at higher elevations (Fig. 9B). There were significant trends in bias with elevation through much of the sea-sonal cycle (Fig. 9C). These trends were strongest dur-ing the period March–September, when there was a general tendency for smaller biases at higher eleva-tions, and weakest in the winter months, when there was a tendency for larger biases at higher elevations
(Fig. 9C). Seasonal patterns in bias were very similar when calculated on a percent basis (results not shown). Trends with elevation in annual MAE and bias for estimation of vapor pressure were not significant (P>0.05), but there was some evidence that both MAE and bias were higher for stations above 1000 m than below (Fig. 10). Average bias for stations below 1000 m was very close to zero, while above 1000 m bias averaged about+75 Pa. Seasonal cycle analysis showed that these weak annual trends were the result of significant positive trends in both MAE and bias with elevation during the winter (Fig. 11).
5. Discussion
para-Fig. 8. Elevation trends in radiation estimation annual error statistics. Regression lines shown with P-value for slope coefficient. (A) and (C) annual MAE and bias, respectively, in absolute units; (B) and (D) annual MAE and bias, respectively, as a percentage of annual averaged observed Rgh.
meter (b0) was required to minimize estimation bias is cause for concern, since this recalibration would not be feasible for most practical applications of the algorithm due to lack of radiation observations. It is possible that the inclusion of horizon and snow effects in the parameterization for the US data would have resulted in a value for b0 closer to that found here. It seems likely, however, that there is some climatic control on the optimal values for this parameter, and a truly general algorithm would need to address this problem. TR and now this study provide some guid-ance, suggesting that the seasonality of precipitation and1T are useful discriminants. Testing this
hypothe-sis would require radiation observations from a wider range of climates than is present in either the US study or the current study. Inclusion of stations from the wet and dry tropics would be especially important.
Fig. 9. Seasonal pattern of elevation trends in radiation estimation error statistics. Based on regression intercepts and slopes, as described in Fig. 7, but regressing MAE and bias against elevation. For all panels: the full seasonal cycle of regression intercepts is shown (d),
corresponding to the zero-elevation errors, while only 5-day periods with significant regression slopes of error against elevation (P<0.05) are shown as the regression-estimated errors at an elevation of 1000m (s). (A) MAE in absolute units; (B) MAE as a percentage of observed Rgh; (C) bias in absolute units; dashed line shows zero bias.
We used a very simple snow model here as a first-order test for identifying and eliminating po-tential radiation biases, and this approach appeared successful. The snow model suffers from too little training data, and many mechanistic improvements are possible. The installation of global radiation sen-sors currently underway at many of the SNOTEL stations in the high country of the western US (Bob Hammer, personal communication) should provide an excellent opportunity to further test and develop this component of the radiation estimation algorithm.
Fig. 10. Elevation trends in vapor pressure estimation annual error statistics. Regression lines shown with P-value for slope coefficient. (A) Annual MAE; (B) annual bias; dashed line shows zero bias.
iteration on radiation and humidity predictions have yet to be identified. Results here suggest that the ef-fects on radiation estimates will be small. Significant overprediction of vapor pressure at higher elevations in the winter (Fig. 11B) suggests that the aridity cor-rection might be appropriate in these cold, low vapor pressure environments.
It appears that the seasonal patterns in Tmax and
Tminlapse rates did not have much effect on radiation predictions over the elevation gradient. We can con-clude that the scatter (MAE) in radiation estimates in-creases with elevation, especially in the summer, and that not all of this increase is the result of higher radi-ation loads at higher elevradi-ation (Fig. 9B). This reduced accuracy could be due to the unaccounted effects of adjacent terrain, varying snowcover conditions, or by the influence of upper air conditions on diurnal tem-perature variations. We are encouraged to find that the seasonal pattern of low elevation bias is very similar to that found for the US study, and that the bias is generally reduced at higher elevations (Fig. 9C).
The consistency of the seasonal bias pattern be-tween the Austrian and US studies suggests that the basic algorithm introduces some systematic bias, pro-ducing overestimates in the spring and underestimates in the late summer and early fall. One possible expla-nation is that seasonal trends in temperature overlaid on the radiation-driven changes in diurnal tempera-ture range lead to increased 1T in the spring when
temperatures are rising and decreased 1T in the late
summer and fall as temperatures drop. These biases in 1T would be expected if Tminwere usually recorded at the same time of day. This argument suggests that the sort of 2-day averaging of Tminsuggested by Bris-tow and Campbell (1984) could help reduce the bias, but we found for both the US and Austrian data that this approach increased MAE without changing the seasonal bias pattern.
In conclusion, we found that the incorporation of horizon and snowpack controls in the TR model re-sulted in good radiation estimates, and that minimiza-tion of radiaminimiza-tion MAE required changing only one of the six original model parameters (b0). Joint estimates of radiation and humidity had very little effect on radiation estimation error. There are several parts of the seasonal cycle that showed small elevation trends in error for radiation and humidity. For application to regional terrestrial ecosystem process modeling,
it is important to understand how these errors affect predictions of fundamental processes, such as net primary production. Preliminary results from another study suggest that the errors and biases illustrated in Fig. 9 have a relatively small effect on predictions of net primary production in complex terrain (M.A., unpublished data).
Acknowledgements
The work described here was begun while P. Thornton and M. White were visiting scientists at the Institut für Waldwachstumsforschung, Universität für Bodenkultur, Vienna, Austria. We are grateful to the Austrian National Weather Center in Vienna, Aus-tria, for providing the weather records. Our thanks to Ingrid Haslik and Roman Rosenthaler for compiling and formatting the station observations and for techni-cal support. Helpful review comments were provided by Helfried Scheifinger and two anonymous review-ers. This work was funded in part by the Austrian Ministry of Science and Traffic, and supported by the research program Forest Ecosystem Restoration. This work was supported in part by NASA Contracts NAG5-6575, NAS5-31368, and NCC5-382.
Appendix A. Definition of MAE and bias
For the case of a set Xo of daily observations of variable X and a corresponding set Xpof daily model predictions, where{1, 2,. . ., n}is the set of observa-tion days, the mean absolute error (MAE) and bias are defined as:
Appendix B. Estimation of direct and diffuse radiation
we assume that H (horizon obstruction angle) is equal at all azimuths, the open-sky fraction is defined as a spherical cap centered at nadir. The fraction of the total hemisphere area within the spherical cap (Sh) is:
Sh=1.0−sin(H ) (B.1)
Having already estimated the daily total transmittance (Tt=Tt,max×Tf max), we estimate the fraction of daily total radiation that arrives at the surface as diffuse (pdif), using the relationship with daily total transmit-tance shown in Jones (Jones, 1992, Fig. 2.8, p. 25) and Gates (Gates, 1980, Fig. 6.14, p. 122) (based on measurements for a flat horizon):
pdif= −1.25Tt+1.25,withpdifconstrained to
×the range 0.0 to 1.0. (B.2)
Calculations of potential (horizontal top-of-the-atmosphere) radiation are made for the direct radia-tion estimate (Rpot,dir) and for the diffuse radiation estimate (Rpot,dif). Horizon obstruction geometry is used to estimate Rpot,dir. Flat horizon geometry is used to estimate Rpot,dif, since diffuse radiation is being received when the sun is above a flat horizon but still below the local terrain horizon. Although we do consider the influence of sub-daily variation in optical air mass when estimating Tt, we ignore the diurnal variation of pdifdue to the influence of optical air mass on instantaneous transmittance in estimat-ing the contributions of direct and diffuse radiation. We also make the simplifying assumption that the diffuse component is distributed evenly over the sky hemisphere at any given time. We include a simple correction for the non-zero albedo of the visible ter-rain elements, assuming that they have a constant albedo (a) of 0.6. Final estimates for direct (Rdir) and diffuse (Rdif) components are:
Rdir=Rpot,dir×Tt(1−pdif) (B.3) Rdif =Rpot,dif×Tt×pdif(Sh+a(1.0−Sh)) (B.4) and total global horizontal radiation (Rgh) is given as
Rdir+Rdif.
References
Abbott, P.F., Tabony, R.C., 1985. The estimation of humidity parameters. Meteorol. Mag. 114, 49–56.
Bristow, K.L., Campbell, G.S., 1984. On the relationship between incoming solar radiation and daily maximum and minimum temperature. Agric. For. Meteorol. 31, 159–166.
Dozier, J., Frew, J., 1981. Atmospheric corrections to satellite radiometric data over rugged terrain. Remote Sens. Environ. 11, 191–205.
Ellis, A.W., Leathers, D.J., 1999. Analysis of cold airmass temperature modification across the US Great Plains as a consequence of snow depth and albedo. J. Appl. Meteorol. 38, 696–711.
Gates, D.M., 1980. Biophysical Ecology. Springer, New York. Glassy, J.M., Running, S.W., 1994. Validating diurnal climatology
logic of the MT-CLIM model across a climatic gradient in Oregon. Ecol. Appl. 4 (2), 248–257.
Hungerford, R.D., Nemani, R.R., Running, S.W., Coughlan, J.C., 1989. MT-CLIM: a mountain microclimate simulation model. US Forest Service Research Paper, INT-414.
Jones, H.G., 1992. Plants and Microclimate. University Press, Cambridge, 428 pp.
Kimball, J.S., Running, S.W., Nemani, R., 1997. An improved method for estimating surface humidity from daily minimum temperature. Agric. For. Meteorol. 85, 87–98.
Lexer, M.J., 1997. Simulation der Globalstrahlung aus täglich Temperatur und Niederschlagsdaten. Forstw. Centralblatt. 114, 109–121.
Meek, D.W., 1997. Estimation of maximum possible daily global solar radiation. Agric. For. Meteorol. 87, 223–241.
Proy, C., Tanré, D., Deschamps, P.Y., 1989. Evaluation of topographic effects in remotely sensed data. Remote Sens. Environ. 30, 21–32.
Running, S.W., Coughlan, J.C., 1988. A general model of forest ecosystem processes for regional applications. I. Hydrological balance, canopy gas exchange and primary production processes. Ecol. Model. 42, 125–154.
Running, S.W., Nemani, R.R., Hungerford, R.D., 1987. Extrapolation of synoptic meteorological data in mountainous terrain and its use for simulating forest evaporation and photosynthesis. Can. J. For. Res. 17, 472–483.
Sellers, P.J., 1992. Biophysical models of land surface processes. In: Trenberth, K.E. (Ed.), Climate System Modeling. Cambridge University Press, London, pp. 451–490.
Scheifinger, H., Kromp-Kolb, H., 2000. Modelling global radiation in complex terrain: comparing two statistical approaches. Agric. For. Meteorol. 100, 127–136.
Thornton, P.E., Running, S.W., 1999. An improved algorithm for estimating incident daily solar radiation from measurements of temperature, humidity, and precipitation. Agric. For. Meteorol. 93, 211–228.
Thornton, P.E., Running, S.W., White, M.A., 1997. Generating surfaces of daily meteorological variables over large regions of complex terrain. J. Hydrol. 190, 214–251.