RESEARCH ON GEOGRAPHICAL ENVIRONMENT UNIT DIVISION
BASED ON THE METHOD OF NATURAL BREAKS (JENKS)
Jian Chen a, *, Shengtian Yang b, Hongwei Li a, Bin Zhang a, Junrong Lv b
a
Institute of Geospatial Information, Information Engineering University, Zhengzhou, China - [email protected] b
School of Geography, Beijing Normal University, Beijing, China
KEY WORDS: Indicators, Algorithm, Feature, Geo-computing, Classification, Experiment, Comparison, Analysis
ABSTRACT:
Zoning which is to divide the study area into different zones according to their geographical differences at the global, national or regional level, includes natural division, economic division, geographical zoning of departments, comprehensive zoning and so on. Zoning is of important practical significance, for example, knowing regional differences and characteristics, regional research and regional development planning, understanding the favorable and unfavorable conditions of the regional development etc. Geographical environment is arising from the geographical position linkages. Geographical environment unit division is also a type of zoning. The geographical environment indicators are deeply studied and summed up in the article, including the background, the associated and the potential. The background indicators are divided into four categories, such as the socio-economic, the political and military, the strategic resources and the ecological environment, which can be divided into more sub-indexes. While the sub-indexes can be integrated to comprehensive index system by weighted stacking method. The Jenks natural breaks classification method, also called the Jenks optimization method, is a data classification method designed to determine the best arrangement of values into different classes. This is done by seeking to minimize each class’s average deviation from the class mean, while maximizing each class’s deviation from the means of the other groups. In this paper, the experiment of Chinese surrounding geographical environment unit division has been done based on the natural breaks (jenks) method, the geographical environment index system and the weighted stacking method, taking South Asia as an example. The result indicates that natural breaks (jenks) method is of good adaptability and high accuracy on the geographical environment unit division.
The geographical environment research was originated in the geopolitics and flourished in the geo-economics. The main representatives of the geopolitics are German geographer Friedrich Ratzel, British geographer Mackinder and American geographical politician Nicholas John Spykman etc. The main representative of the geo-economics is American geographical economist Edward Luttwak. China has the most neighboring countries in the world, and its geographical environment is extremely complex. With the continuous development of globalization, China's relations with neighboring countries have become more complex and more closely. So it is very meaningful to have depth research on geographical environment unit division of China.
1. THE GEOGRAPHICAL ENVIRONMENT INDICATOR SYSTEM
1.1 Indicator selection principles
According to the research needs, different research fields have different indicator selection principles, but many of the principles are universal. By depth study on related fields of the geographical environment, this paper summarizes and proposes the selection principles are as follows on the basis of selection principles of other fields.
(1) The systemic principle, also known as the holistic principle. It requires to take the geographical environment as a system and to optimize the overall system as the yardstick.
(2) The comprehensiveness principle. Any entirety is constructed by the integration of some features for a specific purpose. We should focus on the comprehensive analysis of multiple factors (Qingyun Liu, 2013).
(3) The level principle. Geographical environment indicator system is composed by a number of levels.
(4) The truth principle. Geographical environment indicators must be reliable and objective.
(5) The accessibility principle. (6) The comparability principle.
Furthermore, besides the above principles, we should also follow the scientific principle, representativeness principle, the applicability principle and the simplicity principle etc.
1.2 Construction of the geographical environment indicator system
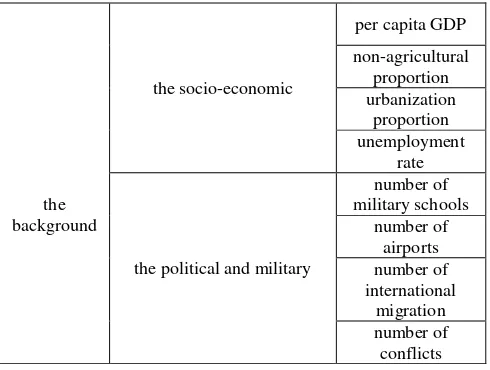
Referring to the indicators of integrated geographic divisions (Du Zheng, 1999), the author divided geographical environment indicators into three categories which include the background, the associated and the potential indicators and three levels. Due to space limitation, only the background indicators are listed in table 1 in detail.
The International Archives of the Photogrammetry, Remote Sensing and Spatial Information Sciences, Volume XL-4/W3, 2013 ISPRS/IGU/ICA Joint Workshop on Borderlands Modelling and Understanding for Global Sustainability 2013,
5 – 6 December 2013, Beijing, China
This contribution has been peer-reviewed.
the then use the normalized data for analysis. Normalization processing of data includes the same chemotactic and dimensionless processing (Baike.Baidu, 2013).
(1) The same chemotactic processing. It is to solve the problem of data of different natures. It can not accurately reflect the consolidated result that summing the data of indicators on different natures directly. In order to obtain the correct results, we should consider changing the nature of data of the indicators, so that all the indicators for evaluation will be with the same chemotaxis.
(2) Data dimensionless processing. It is to solve the comparability of data. Removing the unit limit of data and converting data to a pure dimensionless value can make the indicator data easy to be compared and weighted.
In this paper, indicator data is normalized to [0, 1] by Formula1 based on Min-Max method.
V
ij=
Aij − min(Ai)
max Ai − min(Ai)
(1)
In formula 1, Vij represents normalized value of the ith indicator in the jth region. Aij is the original value of the ith indicator in the jth region. min(Ai) is the min value of the ith indicator of all regions on the same scale. max Ai is the max value of the ith indicator of all regions on the same scale.
2.2 Indicator weight calculation
There are a lot of indicator weight calculation method,for example, Delphi, AHP, RSR and so on. Although weight calculation methods are numerous, they can be roughly divided into three categories.
(1) Subjective weighting method. Indicator weight is determined by experts' subjective experience and judgment. (2) Objective weighting method. Indicator weight is determined by methods of quantitative calculation.
(3) Comprehensive weighting method. Indicator weight is determined by a combination of several methods or the combination of subjective and objective methods.
In the paper, we select the deviation coefficient method to calculate the indicator weight. The calculation procedure is as follows.
(1) Calculating the initial weight of the indicators.
V
AD i=
SiX
(2)
In formula 2, VADi is the deviation coefficient of the ith indicator. Si is the standard deviation of the ith indicator. X is the average of the ith indicator.
(2) Initial weight renormalization. of deviation coefficient of all indicators involved in the analysis. The indicators start from 0, and n+1 is the total number of the indicators involved in the analysis.
2.3 Indicators weighted stacking
In the paper, we can get a combination value of indicator system through the normalized value obtained in 2.1 and indicator region. The indicators are numbered starting from 0, and n+1 is the total number of the indicators involved in the analysis. Similarly, we can obtain the combination values of all the study regions at the same scale by formula 4. The study regions are numbered starting from 0, n +1 is the total number of the regions involved in the analysis at the same scale.
3. GEOGRAPHICAL ENVIRONMENT UNIT DIVISION
3.1 Division principles
(1) Combination of zonality and non-zonality. Zonality and non-zonality is fundamental Regional Differentiation regular pattern of the surface nature. Only a combination of both of them can the spatial differentiation on different scales can be reflected.
(2) Comprehensive analysis combined with the dominant factor analysis. In the division or consolidation process, we should have a comprehensive analysis of the interaction between the various features to identify dominant or critical features, and select the dominant features as the basis or confer dominant features in a larger weight.
(3) Embryology principles. The regional system division and consolidation should be carried out according to the causes and development of the regional units.
The International Archives of the Photogrammetry, Remote Sensing and Spatial Information Sciences, Volume XL-4/W3, 2013 ISPRS/IGU/ICA Joint Workshop on Borderlands Modelling and Understanding for Global Sustainability 2013,
5 – 6 December 2013, Beijing, China
This contribution has been peer-reviewed.
(4) The relative consistency principles. We should pay attention to the internal consistency of the natural complex when the division and merging of the Natural area units is done.
(5) Geographical conjugate principles. Conjugated system mainly is reflected in the interaction between adjacent areas. (6) Division from top to bottom in order.
(7) Merging from bottom to top progressively (Du Zheng, 2012).
3.2 Division method
In the paper, natural breaks (jenks) is taken as the division method. Natural Breaks classes are based on natural groupings inherent in the data. Class breaks are identified that best group similar values and that maximize the differences between classes. The features are divided into classes whose boundaries are set where there are relatively big differences in the data values. The Jenks optimization method, also called the Jenks natural breaks classification method, is a data classification method designed to determine the best arrangement of values into different classes. This is done by seeking to minimize each class’s average deviation from the class mean, while maximizing each class’s deviation from the means of the other groups. In other words, the method seeks to reduce the variance within classes and maximize the variance between classes (Esri, 2010).
3.3 Comparison and analysis of the division results
South Asia is one of the most sensitive areas of China's surrounding geographical environment. In this paper, it is experimental area for unit division. The results are shown in Figures 1 to 5.
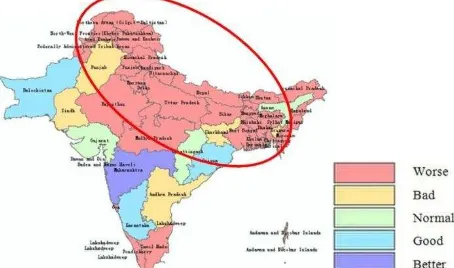
Figure 1. The socio-economic unit division of South Asia
From figure 1, we can see that south Asia can be roughly divided into three units on the socio-economic factor, the worse northwest region, the general central region and the better southwestern region.
Figure 2. The political and military unit division of South Asia
From figure 2, we can see that south Asia can be roughly divided into two units on the political and military factor, the worse northern and eastern regions and the general central region.
Figure 3. The strategic resource unit division of South Asia
From figure 3, we can see that south Asia can be roughly divided into two units on the strategic resource factor, the worse northern and southern regions and the uneven distribution central region.
Figure 4. The ecological environment unit division of South Asia
From figure 4, we can see that south Asia can be roughly divided into three units on the ecological environment factor, the worse northern region, the general central region and the better eastern coast region.
Figure 5. The overall unit division of South Asia
From figure 5, we can see that south Asia can be roughly divided into three units on the comprehensive situation, the worse northern region, the general central region and the better southern region.
The International Archives of the Photogrammetry, Remote Sensing and Spatial Information Sciences, Volume XL-4/W3, 2013 ISPRS/IGU/ICA Joint Workshop on Borderlands Modelling and Understanding for Global Sustainability 2013,
5 – 6 December 2013, Beijing, China
This contribution has been peer-reviewed.
4. CONCULUSIONS
South Asia is one of the most sensitive areas of China's surrounding geographical environment. In the paper, the geographical environment of South Asia is divided on the socio-economic, the political and military, the strategic resources and the ecological environment at the province level based on the natural breaks (jenks) method and the result is clear. On the overall division and analysis, South Asian geographical environment is divided into three sub-regions, including the worse northern region, the general central region and the better southern region.
In the process of the geographical environment unit division, we should pay attention to two questions listed below.
(1) The indicator system is yet to be perfected. Indicator system in the paper is determined after many experts’ discussion. It is of certain authority but not perfect.
(2) Data. Data is the basis of the geographical environment unit division. Firstly, some of the data is difficult to collect. Secondly, the quality of data is related to the division results. (3) Number of Classification. The geographical environment of South Asia is divided into five categories in the paper. We can divide it into three or seven categories according to the research needs.
(4) Scale transformation. Geopolitical environment unit division can be divided into regional level, national level, sub-regional level, provincial level and so on. In the division process, scale can cause changes in the indicator system which determines the division results.
REFERENCES
References from Journals:
Du Zheng, Xiaofeng Fu, 1999. A PRELIMINARY STUDY ON ISSUES OF INTERGRATED GEOGRAPHICAL REGIONAL IZAION. SCIENTIA GEOGRAPHICA SINICA,19(3),194-196.
References from Books:
Du Zheng, Chenghu Zhou,etc., 2012.1 DICTIONARY OF
GEOGRAPHICAL REGIONALIZATION AND PLANNING.
China Water Power Press, Beijing, 30-31.
References from Other Literature: Esri,1995-2010. Arcgis 10 help, USA.
References from websites:
Baike.baidu, 2013.Data normalization, China. http://baike.baidu. com/view/945094.htm (Oct, 2013)
Qingyun Liu, 2013. General principles of the indicator system construction and the principles of a single indicator selection. China. http://zhidao.baidu.com/link?url=pPeVxh8HhJx911zO X olPBSm-DYfnw43u_MwlHAiqMOEiF8ewuUO927X4hV 18 Z rLulF1v1t28OzWE7U4uvjCOD_ (Oct, 2013).
The International Archives of the Photogrammetry, Remote Sensing and Spatial Information Sciences, Volume XL-4/W3, 2013 ISPRS/IGU/ICA Joint Workshop on Borderlands Modelling and Understanding for Global Sustainability 2013,
5 – 6 December 2013, Beijing, China
This contribution has been peer-reviewed.