LAKE URMIA BRIDGE STABILITY ASSESSMENT: RESULTS FROM TERRASAR-X
SPOTLIGHT MODE IMAGES
Farnoosh Hosseini
a,*, Mahdi Motagh
b, Sanaz Vajedian
a, Mohammad Ali Sharifi
aa Department of Surveying and Geospatial Engineering, University of Tehran, Tehran, Iran
b GFZ German Research Centre for Geosciences, Department of Geodesy and Remote Sensing,14473 Potsdam, Germany
ABSTRACT:
In this study we investigate stability of Lake Urmia bridge, locally also known as Shahid Kalantari’s highway bridge, in northwest of Iran using high-resolution satellite radar imagery. The radar dataset includes 22 SAR images acquired in SpotLight mode from 2014 to 2015 in an ascending orbit by TerraSAR-X satellite. A high-resolution Digital Elevation Model (DEM) of the area was constructed from a pair of TanDEM-X bi-static data on June 2012 to remove the effect of topography from interferometry observations. The analysis of X-band interferograms shows high number of displacement fringes, which are interpreted as being caused by thermal dilation due to temperature differences in the imaged area between two SAR acquisitions. This effect, which can often be observed in single interferograms, have important impact on time-series products and should be considered for deformation analysis of bridge structures.
KEY WORDS: Urmia Bridge, TSX SpotLight, TanDEM-X, thermal dilation
1. INTRODUCTION
Geodetic monitoring of bridges is important for evaluating structural conditions and helps avoid human or financial losses caused by early fatigue in the structure.
This letter focuses on stability analysis of Lake Urmia (LU) bridge using X-band interferometry observations. The LU bridge crosses lake Urmia and together with two embankments on its eastern and western side make Lake Urmia Causeway (LUC). The causeway connects two important provinces of East Azerbaijan and West Azerbaijan, reducing the driving distance between them by 135 kilometres.
The bridge has a total length of about 1.7 km and consists of 4 different parts with symmetric geometrical structures including approach, transition, viaduct and arch bridge in its eastern and western parts. The two last parts are referred to as main bridge. The approach bridge is directly supported on the embankments. The foundation solution of the main bridge and the approach bridge differ significantly. The purpose of the transition bridge is to link these two bridge sections enabling uninterrupted uses. The slope in longitude direction is 2% for the approach bridge, 0.48% for the transition bridge, 1.2% for viaduct bridge and 0 for arch bridge. The structure includes 18 caissons filled with concrete; two of them in the embankments and others in the lake. Each caisson constitutes a pile head for the pile group consisting of 4 vertical and 16 inclined 32 inches piles. The steel deck of the bridge has three parts; the central part intended for single-track railway while two outer parts are for double lane vehicle traffic. The height difference between the highest and lowest elevated points of the bridge is about 12 meters. The project was finished in 2009.
* Corresponding author ([email protected])
Previous studies using Envisat, ALOS and TerraSAR-X data show that two embankments on the eastern and western side of the bridge are subject to subsidence with rates exceeding 5 cm/y during 2003-2013 (Shamshiri et al., 2014). The main reason for the subsidence was attributed to consolidation caused by dissipation of excess pore pressure in embankments.
In this paper we focus on the bridge that connects two embankments together and utilize high-resolution X-band SAR images acquired in SpotLight mode by TerraSAR-X
satellite to monitor it’s deformation.
Where k Temp
the temperature difference between the acquisition of two is images of the interferogram k and parameters related to edge e, k
T
and k
Bare temporal and normal baselines of the interferogram k. k
e
is the residual phase component.(Monserrat et al., 2011).
In this paper we evaluate the effect of thermal dilation on X-band interferometric SAR data from Spotlight Mode. We show how phase differences caused by thermal dilation can influence deformation maps derived from small baseline interferograms.
2. INSAR ANALYSIS
2.1 Data and methodology
Fig. 1 illustrates the outline of SAR frame used in this study. The SAR data includes 22 images acquired in SpotLight mode from an ascending orbit from 2014 to 2015 by TerraSAR-X satellite.
Figure 1. TDX and TSX SpotLight frames used in this study. GPS point has been marked by a red circles.
The SAR data are processed using repeat-pass interferometry technique implemented in DORIS software (Kampes and Usai, 1999). To remove the topographic effect from interferograms we used TanDEM-X bi-static data from June 2012 (Moreira et al., 2004) and processed it using SARscape software. For generating high-resolution DEM
using TDX data, we need an external DEM to remove long wavelengths topographic components from TDX interferograms and facilitate phase unwrapping. As the accuracy of the input DEM affects the quality of the derived TDX DEM, three different DEMs with different resolutions were used as input DEMs to select the best one for the processing. These are SRTM C and X-band DEMS with resolutions of 90m and 30 m, respectively, and a photogrammetry-based DEM produced by Iranian National Cartographic Centre (NCC) with a resolution of 10 meters.
2.2 Results
2.2.1 The effect of external DEM on TDX DEM
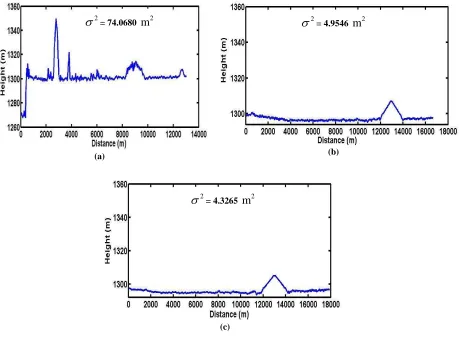
To check the quality of the TDX DEM that was produced using SRTM C, X-band and NCC we extracted an east-west profile for each generated TDX DEM over the causeway. As seen in Fig. 2a, TDX result based on SRTM X-band DEM has lots of jumps which is caused by wrong SRTM-X values in this region. Comparing Fig. 2b and 2c we observe more variation in TDX DEM that was produced with SRTM-C than the one generated from NCC. The smoothest TDX DEM along the causeway is obtained from NCC topographic model and it has the lowest variance value as compared to other products.
A GPS point was used to compare DEM’s absolute heights over the bridge. The position of this point is shown by red circle in Fig. 1. The absolute height comparison results are presented in table 1. As seen the TDX DEM produced by NCC has an absolute accuracy three times better than TDX based on SRTM-X and four times better than TDX based on SRTM-C on the bridge. Therefore, in the following we used TDX DEM that was obtained by NCC for accounting topographic correction of SpotLight interferograms
DEM GPS point’s
Table 1- DEM’s absolute height comparison
2.2.2 Repeat-pass Interferometry
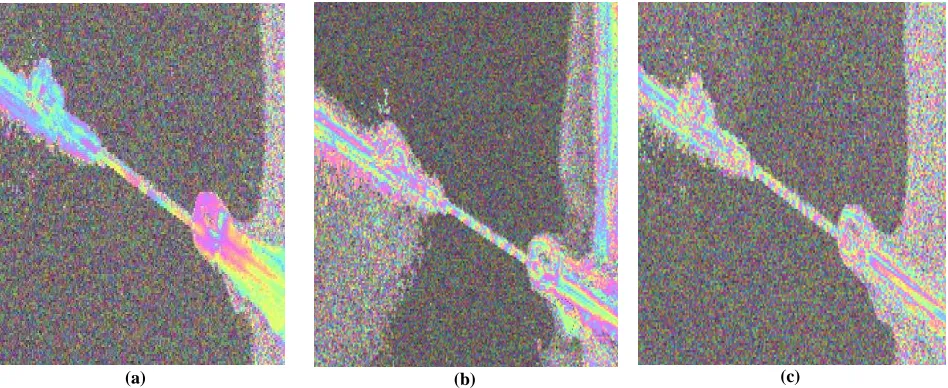
et al., 2011). Fig. 3 shows interferograms with different temperature differences between master and slave images over the bridge. The periodic effect of temperature changes in visible in interferograms.
As seen in the Fig. 3 the number of fringes increases as the temperature difference between two images increases. So there is direct correlation between the number of fringes and the change of temperature between master and slave acquisition time.
(a) (b)
(c)
Figure 2. East-west profile along the causeway in TDX DEM generated based on (a) SRTM-X (b) SRTM-C, and (c) NCC DEMs
2
= 74.0680m
2
2= 4.9546m
22
(a) (b) (c)
Figure 3. Examples of X-band interferograms over LU bridge (a) The 20140609-20140712 interferograms with temperature difference of 4.68°C (b) The 20140209- 20140712 interferograms with temperature difference of 24.08°C (c) The
20150206-20140712 interferogram with temperature difference of 28.28°C
We compared observed fringes over the bridge from different interferograms with temperature difference in each interferogram as shown in Fig. 4. The temperature data were
obtained from Urmia meteorological centre. As seen in the figure each peak in number of observed fringes is exactly equivalent to a peak in the measured temperature.
(a) (b)
Figure 4. (a) Variation in temperature with time. (b) Variation in observed number of fringes with time in SpotLight images
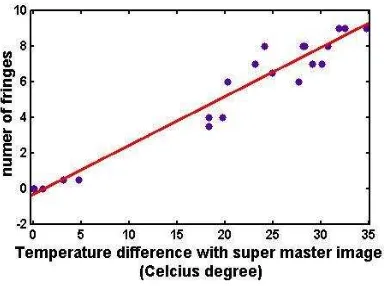
The correlation between the number of fringes observed over the bridge and the difference in temperature is 96.77% for our X-band interferograms over the LU bridge (Fig. 5).
Figure 5. correlation between temperature and number of fringes
3. CONCLUSION:
This paper illustrated the effect of thermal dilation on X-band interferograms constructed from SpotLight SAR data over LU bridge. We derived a correlation of 97% between changes in temperature in radar images and the number of fringes in their associated interferograms. This suggests that
the bridge’s behaviour in X-band interferograms is highly influenced by thermal dilation due to changes in temperature between master and slave images. Such an effect, which can often be observed in single interferograms, have important impact on time-series products and should be considered for deformation analysis of bridge structures, in particular if the observed period is relatively short.
Acknowledgement:
We would like to thank German Aerospace Agency (DLR) for acquiring and providing TerraSAR-X and TanDEM-X images under the proposals motagh_GEO1916 and motagh_XTI_LAND0505, respectively.
REFERENCES:
Crosetto, M., Monserrat, O., Cuevas-González, M., Devanthéry, N., Luzi, G., Crippa, B., 2015. Measuring thermal expansion using X-band persistent scatterer interferometry. ISPRS Journal of Photogrammetry and Remote Sensing 100, 84-91.
Kampes, B., Usai, S., 1999. Doris: The delft object-oriented radar interferometric software, 2nd international symposium on operationalization of remote sensing, enschede, the netherlands. Citeseer, p. 20.
Monserrat, O., Crosetto, M., Cuevas, M., Crippa, B., 2011. The thermal expansion component of persistent scatterer interferometry observations. Geoscience and Remote Sensing Letters, IEEE 8, 864-868.
Moreira, A., Krieger, G., Hajnsek, I., Hounam, D., Werner, M., Riegger, S., Settelmeyer, E., 2004. TanDEM-X: a TerraSAR-X add-on satellite for single-pass SAR
interferometry, Geoscience and Remote Sensing Symposium, 2004. IGARSS'04. Proceedings. 2004 IEEE International. IEEE, pp. 1000-1003.


