CALIBRATION AND STABILITY ANALYSIS OF THE VLP-16 LASER SCANNER
C.L. Glenniea, A. Kusaria, A. Facchinb
a Dept. of Civil & Environmental Engineering, University of Houston, Houston, TX USA - (clglennie, akusari)@uh.edu b Geosoft S.R.L., Viale Lino Zanussi 8D, 33170 Pordenone, IT –[email protected]
Commission I, ICWG III/I
KEY WORDS: Velodyne, Stability, Calibration, LiDAR
ABSTRACT:
We report on a calibration and stability analysis of the Velodyne VLP-16 LiDAR scanner. The sensor is evaluated for long-term stability, geometric calibration and the effect of temperature variations. To generalize the results, three separate VLP-16 sensors were examined. The results and conclusions from the analysis of each of the individual sensors was similar. We found that the VLP-16 showed a consistent level of performance, in terms of range bias and noise level over the tested temperature range from 0-40
°C. A geometric calibration was able to marginally improve the accuracy of the VLP-16 point cloud (by approximately 20%) for a single collection, however the temporal stability of the geometric calibration negated this accuracy improvement. Overall, it was found that there is some long-term walk in the ranging observations from individual lasers within the VLP-16, which likely causes the instability in the determination of geometric calibration parameters. However, despite this range walk, the point cloud delivered from the VLP-16 sensors tested showed an accuracy level within the manufacturer specifications of 3 cm RMSE, with an overall estimated RMSE of range residuals between 22 mm and 27 mm.
1. INTRODUCTION
The recent release of the Velodyne VLP-16 laser scanner has generated significant interest in the surveying and mapping industry because of its small form factor, low power requirements and reasonable cost. The laser scanner has been integrated into a number of unmanned aerial vehicles, indoor mapping platforms, and autonomous vehicle designs as the primary mapping device for collecting high resolution 3D models (Bogue, 2015; Toth and Jóźków, 2015). This widespread integration has come despite the fact that the VLP-16 was primarily built as a low-cost and rugged collision avoidance LiDAR for the automotive industry. Given this initial intent, it is surprising that the survey and mapping community has not completed an evaluation of the sensor accuracy prior to integrating it into a variety of remote sensing platforms. However, to date, a systematic evaluation of the accuracy, repeatability and stability of the sensor has not been presented. This analysis is fundamental to understanding the capabilities of these sensors for 3D modeling and mapping as well as autonomous vehicle navigation.
The VLP-16 is the third generation of multi-laser scanning devices manufactured by Velodyne LiDAR of Morgan Hill, CA; the specifications of the VLP-16 are summarized in Table 1. The predecessors of the VLP-16 were the HDL-32E and HDL-64E, both of which have been extensively studied in the literature to examine both their performance and calibration. For example, (Muhammad and Lacroix, 2010), calibrated an HDL-64E using manually extracted wall surfaces while (Chen and Chien, 2012) used an automatic RANSAC-based plane detection algorithm to extract vertical walls for evaluation of the HDL-64E, (Atanacio-Jiménez et al., 2011) used larged cuboid control targets to calibrate their HDL-64E, and (Chan and Lichti, 2015) utilized cylindrical targets such as lampposts to calibrate a HDL-32E sensor. The calibration and accuracy of the previous generation Velodyne laser scanners has also been reported when they are fused with other sensors in a mobile mapping system, such as the fusion of and HDL-64E and
Ladybug camera reported in (Gong et al., 2013) and (Mirzaei et al., 2012), and the combination of an HDL-32E and frame camera in (Park et al., 2014). In summary, these prior studies have demonstrated that for both the HDL-64E and HDL-32E the factory calibration of the instruments was not optimized, that the instruments exhibited temporal instability and also required a significant warm-up period to reach steady-state ((Glennie et al., 2013; Glennie and Lichti, 2010, 2011). Therefore, given these shortcomings of previous generations of the Velodyne sensor, it would seem instructive to study the calibration and stability of the VLP-16. Herein, we report on a detailed analysis of three VLP-16 laser scanners. With the results of previous Velodyne laser calibrations in mind we have examined each of the VLP-16 scanners with the goal of identifying: (1) if the factory calibration of the instruments was optimized, (2) if the calibration parameters displayed significant temporal variability, (3) if the instrument required a significant warm-up period, and (4) whether the results from the instruments are stable over a wide temperature range.
2. MATHEMATICAL MODEL OF VLP-16
The Velodyne VLP-16 scanner is composed of 16 individual laser-detector pairs which are individually aimed in 2° increments over the 30° field of view of the laser scanner (-15° to +15°). The calculation of (x,y,z) coordinates in the scanners own coordinate system is identical to that of the Velodyne HDL-64E or HDL-32E scanners is given in (Glennie and Lichti, 2010), as:
(1)
where: si is the distance scale factor for laser i;
��� is the vertical offset from scanner frame origin for
laser i;
Ri is the raw distance measurement from laser i; is the encoder angle measurement.
The first six parameters are interior instrument specific calibration values (interior calibration), and are supplied by the manufacturer in an xml document delivered with each scanner. The final two values (Ri and ) are the observations returned by the scanner assembly for each individual laser.
Following previous work, a planar based calibration approach (Skaloud and Lichti, 2006) has been implemented to estimate the interior instrument specific parameters for the VLP-16. The planar observational model is based upon conditioning the LiDAR returns to lie on planar surfaces. Within the adjustment model the coefficients of the planes are estimated along with the system calibration parameters, thus enabling adjustment without knowledge of the true planar surface locations and orientations. The functional model for conditioning the points can be expressed as:
(2)
where are the a priori unknowns of
a plane k on which the LiDAR points are conditioned, and is the vector of LiDAR points within an arbitrarily defined local coordinate system. In a static calibration scenario, scan data are normally collected from a number of different scan locations, j, and therefore, the ith point can be calculated in a consistent local coordinate frame via a rigid body transformation of the form:
(3)
where and tj are the rotational transformation
matrix and translation vector between the jth scanner space and the locally defined coordinate frame respectively, and is the
scanner space coordinates of point i, given by Equation (1). The solution to a least squares adjustment of this functional model can be given using a standard Gauss-Helmert adjustment model, which is described in detail in (Skaloud and Lichti, 2006) and therefore not repeated here.
3. CALIBRATION DATA SETS
Three different VLP-16 sensors were used for the calibration and stability evaluation. For reference, the manufacturer specifications of the VLP-16 are summarized in Table 1. For each of the laser scanners three separate tests were performed to evaluate their warm-up time and range stability, their temperature stability and their geometric calibration accuracy. Each of these tests are briefly summarized below.
Sensor
16 lasers
360° (azimuth) by 30° (vertical) FOV
range: Up To 100 m
0.09° Horizontal Encoder Resolution
5-20 Hz Rotation Rate (User Programmable)
300 kHz
8 Watts
830 g
7.2 cm (height) by 10.3 cm (diameter)
Laser
Class 1
903 nm wavelength
Table 1. Manufacturer Specifications of the Velodyne VLP-16
3.1 Temperature Stability
Laser scanner ranging errors normally show a correlation with temperature, and therefore a majority of LiDAR instruments contain range corrections that vary based on the internal operating temperature of the laser/detector pair. Previous studies have shown that Velodyne scanners contain a varying range bias during warm-up (Glennie and Lichti, 2011), which appears to be correlated to the internal temperature of the Velodyne unit.
To examine the effects of internal temperature on range bias, we performed several warm-up tests on each of the VLP-16 unit were recorded until the internal LiDAR temperature reached 40 °C.
3.2 Geometric Calibration
A static geometric calibration of the VLP-16 units was performed, in which planar surfaces observed in overlapping points clouds were used as constraining conditions in a non-linear least square adjustment to determination optimal calibration parameters for the sensor as described in Section 2. For the geometric calibration, 24 observed point clouds were obtained from the Velodyne sensor at two observation stations inside a room measuring approximately 10m by 20m by 6m (L, W, H), see Figure 1. Twelve observations at each station were collected, with the laser scanner at varied headings and tilt angles as summarized in Table 1. For each of the collections the laser was rigidly attached to a camera tripod with an adjustable pan and tilt mount. Each of the point clouds was of approximately 10 seconds duration. Before the static point clouds were collected, the instrument was allowed to warm up for 30 minutes to allow it to reach a steady state operating temperature, which was in general an internal operating temperature of ~50 °C in a room with an ambient temperature of ~20 °C. The laser was not powered off throughout collection of all 24 observed point clouds (over a period of approximately 45 minutes), and showed a consistent internal temperature throughout the period of observation collection.
Figure 1: Schematic of Static Geometric Calibration Collection
Table 2: Velodyne Sensor Orientation for 12 Point Clouds
Collected at Each Observation Station
3.3 Long Term Static Analysis
In order to examine the typical warm-up time required for the sensor, three long-term static datasets of approximately 3 hours duration (each) were acquired for each unit. For all three experiments, the laser was operating indoors, in a room in which the ambient temperature was ~20 °C throughout the testing. Ranges to a flat target, approximately 4 meters from the instrument for all 16 lasers were extracted once per minute. Mean ranges for each of the lasers was determined, and the mean was then subtracted from each observation to produce long term range deviation graphs for each of the lasers.
4. RESULTS
The results for all three VLP-16 scanners showed remarkable consistency for all three of the test scenarios, and therefore for brevity we will concentrate on showing the results for only one unit. However, these results should be considered representative of the behaviour of the overall sample set of three units.
4.1 Temperature Stability
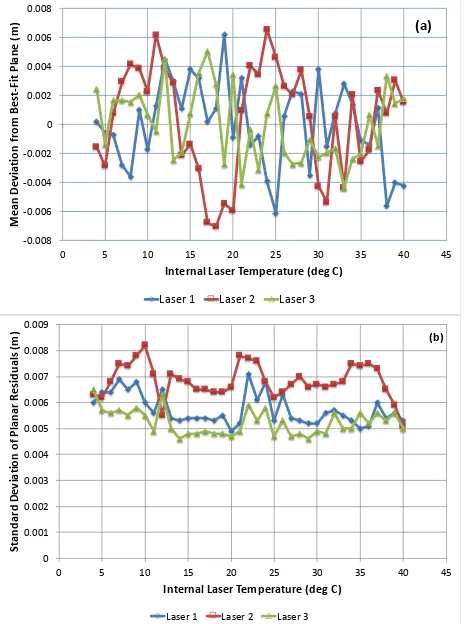
As previously mentioned, an analysis of the Velodyne sensor’s range stability with respect to internal temperature was investigated by freezing each of the units, and then recording continuous observations of ranges to flat planar walls at a distance of ~5 meters from the unit. The entire dataset was used to derive best-fit planes, and then the mean and the standard deviation of each lasers ranges w.r.t. these planes as a function of internal laser temperature were calculated. Showing results for all sixteen lasers at once is impractical on a single graph, and therefore the results for three representative lasers are given in Figure 3.
Figure 3 clearly shows that there does not appear to be a significant correlation with either range bias, or range noise (i.e. standard deviation) and temperature. The noise level of the lasers and the deviations from the best-fit plane remain stable for the entire range of temperatures examined. The maximum range bias variation for any given laser is under 15 mm over the range of temperatures measured. Overall standard deviations of the range measurements vary from 5 to 12 mm for all lasers examined. It is important to note that these observations were collected under ideal viewing conditions; i.e. with short ranges to a flat white target at nearly perpendicular viewing angles, and therefore represents the typical noise floor for the VLP-16 instrument over the range of temperatures studied. Both the bias variation and overall noise level are well with the manufacturer specifications for the unit, given in Table 1. Because the VLP-16 is rated IP-67 and designed to be deployed under harsh environmental conditions, such as on autonomous vehicles, the exhibited temperature stability is encouraging.
Figure 3: (a) Mean and (b) Standard Deviation of Range
Residuals to Best Fit Plane over a range of internal temperatures for three representative lasers from the VLP-16
4.2 Geometric Calibration
Each of the 24 observed point clouds, described in section 3.2, were first segmented into planar surfaces of maximum dimension of 2 x 2 meters. For each observed point cloud, this generally represented between 25 and 50 planar surfaces. From this initial set, 125 common planar surfaces (i.e. surfaces identified in more than one point cloud) were extracted, and correspondence between the selected surfaces in all of the observed point clouds was manually obtained. The 125 planar surfaces contained ~200,000 individual point locations, with between 10,000 to 20,000 observations for each of the 16 lasers in the sensor head.
As detailed in (Glennie and Lichti, 2010, 2011), the interior calibration model for the Velodyne HDL-32E consists of 6 parameters per laser:
1. Horizontal Rotation Correction, β. The horizontal angular offset of the laser from the scanner encoder zero angle measured about the z-axis;
2. Vertical Rotation Correction, δ. The vertical angular offset of the laser from the scanner’s xy plane;
3. Horizontal Offset, H. The offset of laser measurement origin from z-axis in the xy plane;
4. Vertical Offset, V. The offset of the laser measurement origin orthogonal to the xy-plane; and
5. Distance Offset, D. Distance bias for each individual laser. 6. Distance Scale Factor, s. This parameter is directly related to the distance corrections in the x and y directions in the Velodyne factory calibration model.
The horizontal and vertical offsets are very weakly observable in the static calibration, as they are highly correlated to the horizontal and vertical rotations respectively, as discussed in (Glennie and Lichti, 2010; Glennie, 2012). We attempted to recover these offsets for the VLP-16, but in general found very high correlation of these parameters with the vertical and horizontal rotation corrections; correlation coefficients were between 0.92 and 0.98 for all observational sets. However, the physical location of each laser emitter/receiver pair is precisely located within the machined portion of the laser assembly. These locations are known with a level of accuracy from the system CAD drawings at an order of magnitude better precision than the ranging accuracy of the instrument. As a result, the factory values for the horizontal and vertical offsets are held as fixed without compromising the overall calibration parameter determination of the instrument. Therefore, four parameters per laser were solved for in the final adjustment.
Overall, the geometric calibration of the laser instruments improved the accuracy of the resultant point clouds on the order of 10 to 20%. For the measure of improvement in accuracy we are reporting the reduction in the RMSE misclosures of the laser observations on the extracted planar surfaces from the calibration adjustment. However, the geometric calibration parameters were not stable: repeated calibrations of the instrument at different times showed variations in the calibration values that were on par with the improvement seen in a single calibration; i.e. the application of the calibration determined from data set 1 to another observation set for the same unit did not show the same 10 to 20% improvement in accuracy. This temporal instability of the Velodyne instrument was also previously reported in (Glennie and Lichti, 2011) for an earlier generation Velodyne scanner, the HDL-64E.
A by-product of the geometric calibration process is that we can use the planar residuals for each of the individual lasers within the VLP-16 to examine their noise level. Figure 4 shows the RMSE of the planar residuals for each of the three lasers for their separate geometric calibrations. The figure clearly shows that the performance of the individual lasers in the VLP-16 is not uniform. For each of the VLP-16 units there are lasers that show better overall point cloud precision. There is also a significant difference between the overall units. Unit 1 in the above figure had an overall RMSE of 22.2 mm, while units 2 and 3 had an RMSE of 26.9 and 26.7 mm respectively. It is also interesting to note that for all three units tested, lasers 1, 3 and 5 consistently underperformed in terms of residual noise when compared to the other laser receiver/pairs in the unit. These three lasers are oriented at -15, -13 and -11° respectively,
i.e. they are the three most downward looking lasers. It may be a reasonable conclusion that the measurements from these lasers may have additional distortion because they are made through
VLP-16 Units Evaluated after geometric calibration
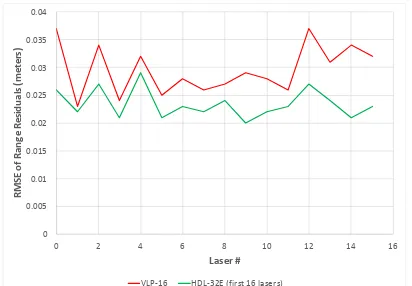
As a final note regarding the calibration of the VLP-16, Figure 5 displays the range residuals per laser for the VLP-16 versus the range residuals for the first 16 lasers of the HDL-32E unit whose calibration is detailed in (Glennie et al., 2013). The overall RMSE of range residuals for the VLP-16 is 26.9 mm, compared to 22.7 mm for the HDL-32E.
Figure 5: Comparison of Range Residuals by Laser for VLP-16
and HDL-32E after static Calibration.
4.3 Long Term Static Analysis
A typical set of results for the long-term ranging observational sets are shown in Figure 6. It should be noted that the temporal behaviour of the sensor was similar in all three static tests, and therefore the results of only one test, and for 4 of the 16 lasers are shown as representative of the performance of all lasers for all of the static tests.
An examination of Figure 6 shows that the long-term errors are bounded within a range of -2 to +2 cm, which is well within the manufacturer accuracy specification of 3 cm ranging accuracy. In fact the overall ranging precision for each of the 16 lasers in the long-term static cases varies from approximately 8 to 18
collected under ideal viewing conditions, with short ranges to a flat white target at nearly perpendicular viewing angles, and therefore represents the typical noise floor for the VLP-16 instrument over the three hour time period. There does also not appear to be a significant warm-up period for the lasers. The results presented in (Glennie and Lichti, 2011) showed that for the Velodyne HDL-64E an initial change in range bias of several cm occurred in the first 30-60 minutes of operation. This behaviour is not present in the VLP-16 results.
Nevertheless, a closer examination of Figure 6 indicates that while the lasers don’t appear to have an initial warm-bias, there is a pronounced range bias walk for two of the lasers plotted (12 and 13). It was previously assumed (Glennie and Lichti, 2011), that range walk in the Velodyne scanners, which was only observed in the initial warm-up of the instrument, was correlated with the internal temperature of the laser. However, the internal temperature of the VLP-16, plotted on the secondary horizontal axis in Figure 6, does not appear to have significant correlation with the range walk present in either lasers 12 or 13. Indeed, it could be argued that laser 12 (and others not displayed) exhibit range walk over the entire three hour static collection. In general, this range walk is evident in a number of the lasers over the static datasets collected, although the magnitude and period of the walk appears to change. However, while significant, the range walk is still smaller in magnitude than the VLP-16 ranging accuracy specifications. This temporal instability in the range biases is likely the reason that the geometric calibration of the unit is not consistent.
Figure 6: Sample Long-Term Range Residuals for VLP-16
5. CONCLUSIONS
The results of this analysis show that the ranging ability of the VLP-16 is within the manufacterers stated accuracy specification of the laser sensors over the temperature range examined, and that the scanner does not appear to require a significant warm-up time. The factory supplied calibration of the VLP-16 units is also significantly improved over that of its predecessors, especially the first generation HDL-64E. Temporal analysis of the sensors suggests that there may be some instability in the ranging of the instrument that doesn’t appear correlated with the instrument temperature. Overall ranging accuracy of the VLP-16 with the factory supplied calibration is between 22 and 27 mm RMSE, which is slightly worse than that of the HDL-32E, but still within the 3 cm ranging accuracy quoted on the instrument specification sheets. The ranging from each of the lasers within the VLP-16 are not at a consistent noise level, with lasers 1, 3 and 5, which are the three most downward looking lasers in the array, performing performance to a level closer to the raw noise level (~10 mm) of the laser range observations over short time windows.
REFERENCES
Atanacio-Jiménez, G., González-Barbosa, J.-J., Hurtado-Ramos, J.B., Ornelas-Rodríguez, F.J., Jiménez-Hernández, H., García-Ramirez, T., González-Barbosa, R., 2011. LIDAR velodyne HDL-64E calibration using pattern planes. International Journal of Advanced Robotic Systems 8, 70-82.
Bogue, R., 2015. Sensors for robotic perception. Part two: positional and environmental awareness. Industrial Robot: An International Journal 42, 502-507.
Chan, T., Lichti, D., 2015. Automatic In Situ Calibration of a Spinning Beam LiDAR System in Static and Kinematic Modes. Remote Sensing 7, 10480.
Chen, C.-Y., Chien, H.-J., 2012. On-Site Sensor Recalibration of a Spinning Multi-Beam LiDAR System Using Automatically-Detected Planar Targets. Sensors 12, 13736.
Glennie, C., Brooks, B., Ericksen, T., Hauser, D., Hudnut, K., Foster, J., Avery, J., 2013. Compact Multipurpose Mobile Laser Scanning System - Initial Tests and Results. Remote Sensing 5, 521-538.
Glennie, C., Lichti, D.D., 2010. Static Calibration and Analysis of the Velodyne HDL-64E S2 for High Accuracy Mobile Scanning. Remote Sensing 2, 1610-1624.
Glennie, C., Lichti, D.D., 2011. Temporal Stability of the Velodyne HDL-64E S2 Scanner for High Accuracy Scanning Applications. Remote Sensing 3, 539-553.
Glennie, C.L., 2012. Calibration and Kinematic Analysis of the Velodyne HDL-64E S2 Lidar Sensor. Photogrammetric Engineering & Remote Sensing 78, 339-347.
Gong, X., Lin, Y., Liu, J., 2013. 3D LIDAR-Camera Extrinsic Calibration Using an Arbitrary Trihedron. Sensors 13, 1902.
Mirzaei, F.M., Kottas, D.G., Roumeliotis, S.I., 2012. 3D LIDAR–camera intrinsic and extrinsic calibration: Identifiability and analytical least-squares-based initialization. The International Journal of Robotics Research 31, 452-467.
Muhammad, N., Lacroix, S., 2010. Calibration of a rotating multi-beam lidar, Intelligent Robots and Systems (IROS), 2010 IEEE/RSJ International Conference on. IEEE, pp. 5648-5653.
Park, Y., Yun, S., Won, C., Cho, K., Um, K., Sim, S., 2014. Calibration between Color Camera and 3D LIDAR Instruments with a Polygonal Planar Board. Sensors 14, 5333.
Skaloud, J., Lichti, D., 2006. Rigorous approach to bore-sight self-calibration in airborne laser scanning. Isprs Journal of Photogrammetry and Remote Sensing 61, 47-59.
Toth, C., Jóźków, G., 2015. Remote sensing platforms and
Laser 8 Laser 12 Laser 13 Laser 15 Temperature