TEXTURE BASED HYPERSPECTRAL IMAGE CLASSIFICATION
B. Kumar*, O. Dikshit
Department of Civil Engineering, Indian Institute of Technology Kanpur, India - (brajeshk, onkar)@iitk.ac.in
Commission VIII, WG VIII/8
KEY WORDS: Hyperspectral, Spectral, Texture, Geometric Moments, Classification, Support Vector Machine
ABSTRACT:
This research work presents a supervised classification framework for hyperspectral data that takes into account both spectral and spatial information. Texture analysis is performed to model spatial characteristics that provides additional information, which is used along with rich spectral measurements for better classification of hyperspectral imagery. The moment invariants of an image can derive shape characteristics, elongation, and orientation along its axis. In this investigation second order geometric moments within small window around each pixel are computed which are further used to compute texture features. The textural and spectral features of the image are combined to form a joint feature vector that is used for classification. The experiments are performed on different types of hyperspectral images using multi-class one-vs-one support vector machine (SVM) classifier to evaluate the robustness of the proposed methodology. The results demonstrate that integration of texture features produced statistically significantly better results than spectral classification.
1. INTRODUCTION
Accurate image classification is important for many applications including agriculture monitoring, hydrological science, environmental studies, military applications, and urban planning etc. Hyperspectral (Goetz, 2009) sensors capture tens or hundreds of fine contiguous spectral bands of an image scene from ultraviolet to infrared region. The rich spectral information can be helpful to more discriminately identify the surface material, and objects of interest. However, high dimensionality also possess some challenges to supervised classification due to limited availability of training samples and curse of dimensionality. On the other hand contiguous spectral bands are highly correlated and provide redundant information. Therefore, dimensionality reduction by spectral feature extraction or selection is often performed prior to classification to mitigate the high dimensionality related problems. Feature extraction generally transforms the original data into a new smaller representation such that important information can be preserved with minimum number of features. The techniques such as principal component analysis (PCA) (Joliffe, 2002), discrete boundary feature extraction (DBFE) (Lee, et al., 1993), and nonparametric weighted feature extraction (NWFE) (Kuo, et al., 2002), etc. transform the original data into new uncorrelated dataset such that only a small number components have the maximum data variance.
The conventional pixel wise classifiers that use spectral features only, usually produce noisy classified maps. The labelling uncertainties can be minimized by combining some additional information in classification. In remotely sensed images the spatial context of a pixel can provide additional information as neighbouring pixels are highly correlated and likely to have same label. By integrating spectral and spatial information better classification can be performed yielding
more accurate results. The integration of spatial information is usually done either by post classification refinement or by using joint spectral-spatial feature vector. Post classification refinement mostly include relaxation labelling and segmentation based approaches. The spatial feature extraction involves determining information about shape, size, co-occurrence, and texture, etc. from a crisp or adaptive neighbourhood. The major approaches in this categories are based on Markov random field (MRF) (Farag, et al., 2005), Gabor filters (Grigorescu, et al., 2002), morphological operators, and wavelet decomposition etc. The high dimensionality possess the major challenge to the spatial feature extraction. The traditional 2-dimensional (D) approaches need to be adapt to 3-D structure of the hyperspectral imagery.
Texture is an important characteristics to model the spatial properties of an image. The texture analysis has been widely used for classification and segmentation of different types of images. The traditional approaches to texture analysis include gray level co-occurrence matrices (GLCM) (Haralick, et al., 1973), MRF models, Gabor filters, Gibbs random field models, and wavelet analysis, etc. The high dimensionality is the major challenge in texture modelling of the hyperspectral images. Additional efforts are required to adapt the traditional texture analysis methods to high dimensional data. Shi, et al. (2003) used Gabor filters on spectral bands of a hyperspectral image with reduced dimensionality to compute texture features. A similar approach was applied in (Rellier, et al., 2004) with a simplified multivariate Gaussian MRF model. Shi, et al. (2005) modelled hyperspectral texture using multiband correlation functions. Tsai, et al. (2013) extended GLCM to 3-D GLCM and defined third-order texture measures for extracting texture features from hyperspectral image cube.
In this research work the second order geometric moments are used to compute texture features and a spectral-spatial framework for supervised classification of hyperspectral *Corresponding author
imagery. The rest of the paper is organized as follows. Section 2 provides the theoretical background, section 3 outlines the proposed methodology, the experimental results are presented in section 4, and finally section 5 concludes the work.
2. BACKGROUND
This section describes the methods used in this work for characterization of spectral and spatial information. We used PCA and DBFE, which are unsupervised and supervised techniques respectively for spectral feature extraction to investigate the integration of texture information with different types of spectral features. Both these algorithms are widely used and have been demonstrated to be powerful approaches.
2.1 PCA
The PCA is an unsupervised data transformation technique that transforms the dataset into lower dimensional space that retains most of the variation of original dataset into a new set of orthogonal variables called principal components (PCs) minimizing the correlations among PCs. The PCs are sorted such that the first PC preserves the greatest variance, second PC corresponds to next greatest variance, and so on. For hyperspectral image classification a subset of largest PCs corresponding to some pre-specified percentage of cumulative variance usually 99%, is taken.
2.2 DBFE
The DBFE was proposed by Lee, et al. (1993) who introduced the concept of effective decision boundary and defined discriminantly informative features (DIF) and discriminantly redundant features (DRF) for feature extraction. It is a supervised feature extraction technique. The DIF and DRF are extracted from decision boundary using a decision boundary feature matrix (DBFM). The eigenvectors of DBFM corresponding to nonzero eigenvalues are the DIFs and used as new feature vectors. For multiclass problem DBFMs are shape characteristics, elongation, and orientation along its axis. Geometric moments are widely used in various image processing tasks such as segmentation, object detection, scene matching, shape analysis, and texture recognition, etc. The image moments within small window centred on a pixel are computed which are subsequently used to compute texture features. The geometric moments of the order of (p q ) of a order have different geometric interpretations about area, orientation, elongation, and shape, etc. For pixel wise texture texture features since moments themselves are not sufficient to characterize good texture features (Tuceryan, 1994). Texture feature of a pixel at location ( , )i j is determined by using a
small window Wij of size L L and applying some mapping
function. We use absolute deviation of moments from their mean value to map moment image Mpqto the texture feature image F using following transformation pq
1 1 nonlinear functions may also be used for transformation.
3. METHODOLOGY
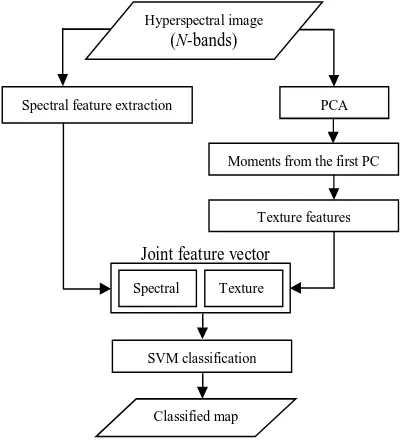
Figure 1. Flow chart of the proposed methodology.
We decompose hyperspectral image by PCA and use the first PC, which retains the most of the variance, to compute moments. In this work second order (p q 2) geometric moments are used for computing texture features. For pixel wise texture feature extraction, 8-connected neighbourhood is considered. A 3 3 window centred on the pixel under consideration is placed and moments are computed on the local sub image. Similarly a 3 3 window is used again to
determine texture features from the moment images (Mpq). The texture features are stacked with spectral features to form a joint feature vector, which is used for classification using SVM. The accuracy analysis of the results is done in terms of kappa coefficient (
) (Congalton, et al., 1999). The statistical significance of the difference between two classifications is determined using Z statistics defined as follows1 2 variances. The classifications are statistically significantly different at 5% significance level if Z 1.96 for a two-tailed test. However, for one-tailed test, classifier 1 is statistically significantly better than classifier 2 if Z1.645 at 5% significance level.
4. EXPERIMENTAL RESULTS
In this section experimental results and their analysis are presented. Several experiments are performed to evaluate the effectiveness of the proposed methodology.
4.1 Description of Datasets
The investigations involve two different types of airborne hyperspectral datasets.
4.1.1 University of Pavia Dataset: This dataset is captured by ROSIS-3 sensor over urban area of Engineering School at University of Pavia, Italy. It is
610 340
pixels image with 1.3 meters pixel size. Original dataset consists 115 spectral bands in the range0.43 0.86 m
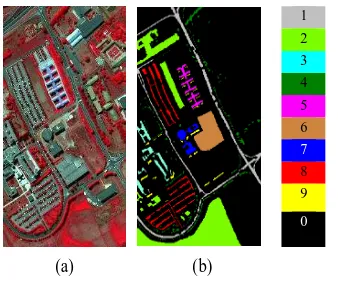
but 12 bands are discarded due to noise. The false color composite (FCC) and ground reference data are shown in Figure 2. There are nine land cover classes of interest: Asphalt, Meadows, Gravel, Tree, Metal sheets, Soil, Bitumen, Bricks, and Shadow.Figure 2. University of Pavia: (a) FCC (b) Ground reference
4.1.2 Salinas Dataset: It is a 512 217 pixels scene captured by AVIRIS sensor over the Salinas Valley, CA, USA. The spatial resolution is 3.7 meters/pixel. Original dataset has 224 spectral channels out which 20 water absorbing bands are removed. The FCC and corresponding ground reference of Grapes untrained, Soil vinyard develop, Corn senesced green weeds, Lettuce romaine 4wk, Lettuce romaine 5wk, Lettuce romaine 6wk, Lettuce romaine 7wk, Vinyard untrained, Vinyard vertical trellis.
Figure 3. Salinas: (a) FCC (b) Ground reference
4.2 Classification
The supervised classification is done using SVM, which is well suited to classify hyperspectral data (Camps-Valls, et al., 2005). It can handle the issues like high dimensionality, small size training samples, and poor generalization, etc. better than the conventional classifiers. The SVM is implemented using MATLAB interface of LIBSVM (Chang, et al., 2011) tool. We used one-vs-one multi-class SVM with radial basis function (RBF) kernel. The parameters, cost C and the spread of kernel
are determined optimally using 5-fold cross validation. The feature extraction using DBFE is implemented with MultiSpec tool (Landgrebe, et al., 2003).4.3 Results
The texture features obtained from second order (p q 2) geometric moments (m00,m m m m01, 10, 11, 02,m20)are combined with spectral feature obtained from PCA or DBFE. The length of feature vector is increased by six as one additional feature is produced by each moment image. The results are compared with spectral classification results to investigate the impact of integration of spatial information. For both spectral feature extraction techniques, the first few components necessary to retain 99% variance are kept in joint feature vector.
4.3.1 University of Pavia Dataset Results: The details of training and test samples used in the experiments are provided in Table 1. The training samples are randomly chosen from the ground reference and remaining samples are used for evaluating the performance. The results reported for each experiment are the average of ten trials. It can be observed
Class No. of samples Class wise accuracies () in % Z statistic No. Name Training Test PCA
(a)
DBFE (b)
PCA+Texture (c)
DBFE+Texture (d)
ca
Z Zdb
1 Asphalt 548 6083 81.45 90.47 99.53 99.30 33.64 20.99
2 Meadows 540 18109 76.80 93.66 99.10 98.96 53.82 20.01
3 Gravel 392 1707 74.53 86.49 99.04 99.46 22.32 15.14
4 Tree 524 2540 94.62 97.59 99.05 98.96 8.81 3.66
5 Metal sheets 265 1080 99.91 99.82 99.72 99.72 -0.99 -0.45
6 Soil 532 4497 79.55 93.88 99.95 99.83 31.51 15.47
7 Bitumen 375 955 91.34 93.37 99.69 99.80 9.08 7.96
8 Bricks 514 3168 83.10 90.05 99.22 99.29 22.77 16.14
9 Shadow 231 716 100 99.86 99.86 99.85 -1.00 0
Overall 3921 38855 81.86 93.04 99.36 99.28 74.35 39.47
Table 1. Classification accuracies for University of Pavia dataset. The best results are highlighted in bold typeface. Z is the ij Z statistic between classifiers i and j.
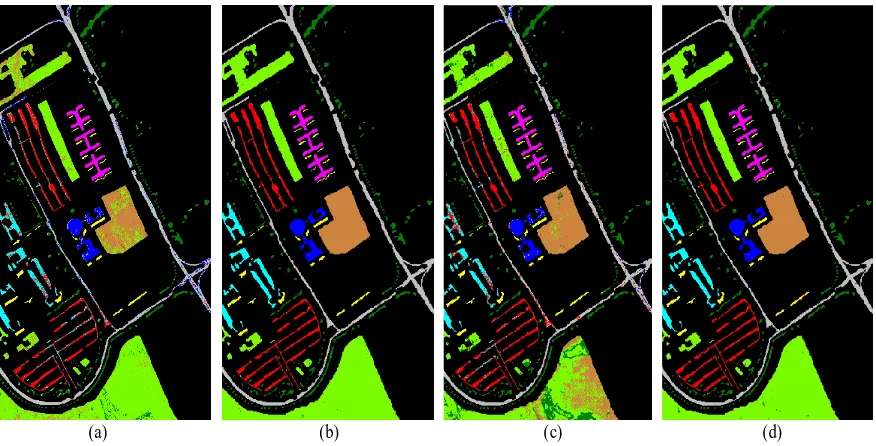
(a) (b) (c) (d)
Figure 4: Classified maps for University of Pavia dataset: (a) PCA (b) PCA+Texture (c) DBFE (d) DBFE+Texture
classify the samples from classes Metal sheets (99.91%) and Shadow (100%) only. Better results are obtained using DBFE with overall accuracy of 93.06%. However, as in case of PCA the best accuracies are obtained for “Metal sheets” (99.82%) and Shadow (99.86%) classes only. In both cases the accuracy improvements are desirable for most of the classes. The statistically significantly better results are obtained by integrating texture information both with PCA and DBFE features. The overall improved to 99.36% and 99.28% using texture features with PCA and DBFE respectively. The classification accuracy for most of the classes is statistically significantly improved. For classes Metal sheets and Shadow the accuracy is reduced slightly but the difference is not statistically significant. Almost 99% or more accuracy is achieved for all the classes in both the cases. The classified maps of University of Pavia are shown in Figure 4. It can be observed from the figure that noisy map obtained by spectral classifications are well smoothened by spectral-spatial classification.
4.3.2 Salinas Dataset Results: The results of experiments on Salinas dataset are reported in Table 2. The experiments are performed for a different kind of database to evaluate the effectiveness of the proposed methodology. Like previous experiments the training samples are randomly selected from ground reference and remaining samples are kept for accuracy analysis. PCA produced overall of 89.60% and DBFE performed better with 91.95%. Both PCA and DBFE yielded poorest results for two classes “Grapes untrained” (82.61% and 83.56% respectively) and “Vinyard untrained” (54.53% and 69.79% respectively). By observing confusion matrix it is found that most of the misclassified pixels of “Grapes untrained” are classified as “Vinyard untrained” and vice versa. Additional information provided by texture feature has helped better discriminating the different classes. By spectral-spatial classification using PCA and texture features achieved more than 99% accuracy for all the classes. The overall as well as class wise are statistically significantly improved. The texture features with DBFE also statistically significantly improved overall and class specific accuracies for most of The International Archives of the Photogrammetry, Remote Sensing and Spatial Information Sciences, Volume XL-8, 2014
Class No. of samples Class wise accuracies () Z statistic
No. Name Training Test PCA
(a)
DBFE (b)
PCA+Texture (c)
DBFE+Texture (d)
ca
Z Zdb
1 Broccoli green weeds 1 252 1757 98.42 99.47 99.94 99.71 4.95 1.07 2 Broccoli green weeds 2 474 3252 99.67 99.74 99.84 99.61 1.29 -0.90
3 Fallow 239 1737 97.27 98.22 100 99.53 6.88 3.60
4 Fallow rough plow 169 1225 99.17 99.00 99.25 99.09 0.23 0.21
5 Fallow smooth 342 2336 99.02 97.73 99.29 98.53 0.97 1.99
6 Stubble 516 3443 99.91 99.60 99.91 99.41 0 -1.06
7 Celery 442 3137 99.70 99.36 99.93 99.32 2.11 -0.17
8 Grapes untrained 1395 9876 82.61 83.56 99.96 99.34 40.18 37.02 9 Soil vinyard develop 775 5428 99.67 98.99 99.94 99.67 2.99 4.11 10 Corn green weeds 407 2871 91.55 94.17 99.45 98.57 14.35 8.74 11 Lettuce romaine 4wk 141 927 95.45 96.19 99.24 98.59 5.10 3.24 12 Lettuce romaine 5wk 232 1695 99.64 99.21 100 99.76 2.45 2.19 13 Lettuce romaine 6wk 124 792 98.99 97.96 99.49 98.09 1.16 0.18 14 Lettuce romaine 7wk 121 949 92.90 96.06 99.04 96.91 6.87 0.99 15 Vinyard untrained 906 6362 54.53 69.79 99.96 99.08 70.35 47.34 16 Vinyard vertical trellis 231 1576 98.44 98.12 99.94 98.90 4.63 1.79
Overall 6766 47363 89.60 91.95 99.81 99.20 67.47 53.38
Table 2. Classification accuracies for Salinas dataset. The best results are highlighted in bold typeface. Z is the Z statistic ij between classifiers i and j.
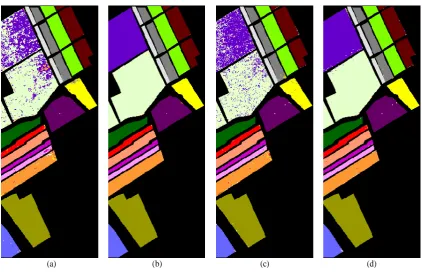
(a) (b) (c) (d)
Figure 5: Classified maps for Salinas dataset: (a) PCA (b) PCA+Texture (c) DBFE (d) DBFE+Texture the classes including “Grapes untrained” and “Vinyard
untrained”. However, in this case accuracies of some classes is reduced but the difference is not statistically significant. The integration of texture information with PCA produced better results than its integration with DBFE with overall of 99.81% and 99.20% respectively. Figure 5 presents the classified maps for Salinas dataset. The noisy maps are improved by integrating texture information.
5. CONCLUSION
In this research work a spectral-spatial supervised framework was proposed for integrating spectral and texture features to classify hyperspectral data. The second order geometric moments were used to compute texture features. The proposed methodology was tested on two airborne hyperspectral datasets to evaluate its effectiveness. Two techniques, one supervised and one unsupervised were employed for spectral feature The International Archives of the Photogrammetry, Remote Sensing and Spatial Information Sciences, Volume XL-8, 2014
reduction. The experimental results showed that integration of texture and spectral features produced statistically significantly better results than spectral classification. The texture features were successfully integrated with spectral features computed by different algorithms to reduce the label uncertainty. For both the datasets more than 99% accuracy was achieved in terms of kappa coefficient.
ACKNOWLEDGEMENTS
The authors would like to thank Prof. Paolo Gamba from University of Pavia, Italy to provide ROSIS dataset.
REFERENCES
Goetz, A.F.H., 2009. Three decades of hyperspectral remote sensing of the Earth: A personal view. Remote Sensing of
Environment. 113, pp. S5–S16.
Joliffe, I., 2002. Principal Component Analysis. Springer-Verlag, New York.
Lee, C., and Landgrebe, D.A., 1993. Feature extraction based on decision boundaries. IEEE Transactions on Pattern
Analysis and Machine Intelligence, vol. 15, no. 4, pp. 388–
400.
Kuo, B.-C., and Landgrebe, D.A., 2002. A robust classification procedure based on mixture classifiers and nonparametric weighted feature extraction. IEEE Transactions on Geoscience
and Remote Sensing. vol. 40, no. 11, pp. 2486–2494.
Farag, A., Mohamed, R., and El-Baz, A., 2005. A unified framework for map estimation in remote sensing image segmentation. IEEE Transactions on Geoscience and Remote
Sensing, vol. 43, no. 7, pp. 1617–1634.
Grigorescu, S.E., Petkov, N., and Kruizinga, P., 2002. Comparison of texture features based on Gabor filters. IEEE
Transactions on Image Processing, vol. 11, no. 10, pp.
1160-1167.
Haralick, R.M., Shanmugan, K., and Dinstein, I., 1973. Texture features for image classification. IEEE Transactions
on System, Man, Cybernetics, vol. SMC-3, no. 6, pp. 610–621.
Shi, M., and Healey, G., 2003. Hyperspectral texture recognition using a multiscale opponent representation. IEEE
Transactions on Geoscience and Remote Sensing, vol. 41, no.
5, pp. 1090-1095.
Rellier, G., Descombes, X., Falzon, F., and Zerubia, J., 2004. Texture Feature Analysis Using a Gauss–Markov Model in Hyperspectral Image Classification. IEEE Transactions on
Geoscience and Remote Sensing, vol. 42, no. 7, pp. 1543-1551.
Tsai, F., and Lai, J.-S., 2013. Feature Extraction of Hyperspectral Image Cubes Using Three-Dimensional Gray-Level Cooccurrence. IEEE Transactions on Geoscience and
Remote Sensing, vol. 51, no. 6, pp. 3504-3513.
Castaings, T., Waske, B., Benediktsson, J.A., and Chanussot, J., 2010. On the influence of feature reduction for the classification of hyperspectral images based on the extended morphological profile. International Journal of Remote
Sensing, vol. 31, no. 22, pp. 5921–5939.
Tuceryan, M., 1994. Moment based texture segmentation.
Pattern Recognition Letters, vol. 15, pp. 659-668.
Congalton, R.G., and Green, K., 1999. Assessing the accuracy
of remotely sensed data- principles and practices. Lewis
Publisher, Boca Raton.
Camps-Vallas, G., and Bruzzone, L., 2005. Kernel-based methods for hyperspectral image classification. IEEE
Transactions on Geoscience and Remote Sensing, vol. 43, no.
6, pp. 1351-1362.
Chang, C.-C., and Lin, C.-J., 2011. LIBSVM: a library for support vector machines. ACM Transactions on Intelligent
Systems and Technology, vol. 2, no. 3, pp. 27:1-27:27.
Landgrebe, D. A., 2003. Signal Theory Methods in
Multispectral Remote Sensing. Hoboken, NJ: Wiley.