GEOSPATIAL APPROACH ON LANDSLIDE HAZARD ZONATION MAPPING USING
MULTICRITERIA DECISION ANALYSIS: A STUDY ON COONOOR AND OOTY, PART
OF KALLAR WATERSHED, THE NILGIRIS, TAMIL NADU
S. Abdul Rahamana, *, S. Aruchamy b, R. Jegankumar c a,
Research Scholar, Dept. of Geography, Bharathidasan University, Tiruchirappalli, Tamil Nadu, India.- [email protected] b Professor & Head, Dept. of Geography, Bharathidasan University, Tiruchirappalli, Tamil Nadu, India.- [email protected] c3
Assistent Professor, Dept. of Geography, Bharathidasan University, Tiruchirappalli, Tamil Nadu, India. - [email protected]
Commission VIII, WG VIII/1
KEY WORDS: Landslide Hazard Zones, Geospatial Technology, Analytical Hierarchy Process
ABSTRACT:
Landslides are one of the critical natural phenomena that frequently lead to serious problems in hilly area, resulting to loss of human life and property, as well as causing severe damage to natural resources. The local geology with high degree of slope coupled with high intensity of rainfall along with unplanned human activities of the study area causes many landslides in this region. The present study area is more attracted by tourist throughout the year, so this area must be considered for preventive measures. Geospatial based Multicriteria decision analysis (MCDA) technique is increasingly used for landslide vulnerability and hazard zonation mapping. It enables the integration of different data layers with different levels of uncertainty. In this present study, it is used analytic hierarchy process (AHP) method to prepare landslide hazard zones of the Coonoor and Ooty, part of Kallar watershed, The Nilgiris, Tamil Nadu. The study was carried out using remote sensing data, field surveys and geographic information system (GIS) tools. The ten factors that influence landslide occurrence, such as elevation, slope aspect, slope angle, drainage density, lineament density, soil, precipitation, land use/land cover (LULC), distance from road and NDVI were considered. These factors layers were extracted from the various related spatial data’s. These factors were evaluated, and then, the individual factor weight and class weight were assigned to each of the related factors. The Landslide Hazard Zone Index (LHZI) was calculated using Multicriteria decision analysis (MCDA) the technique based on the assigned weight and the rating is given by the Analytical Hierarchy Process (AHP) method. The final cumulative map of the study area was categorized into four hazard zones and classified as zone I to IV. There are 3.56 % of the area comes under the hazard zone IV fallowed by 48.19 % of the area comes under zone III, 43.63 % of the area in zone II and 4.61% of the area comes hazard zone I. Further resulted hazard zone map and landuse/landcover map are overlaid to check the hazard status, and existing inventory of known landslides within the present study area was compared with the resulting vulnerable and hazard zone maps. The landslide hazard zonation map is useful for landslide hazard prevention, mitigation, and improvement to society, and proper planning for land use and construction in the future..
* Corresponding author. This is useful to know for communication with the appropriate person in cases with more than one author.
1. LANDSLIDE
1.1 Introduction
Landslide is the major disaster event which frequently occurs in hilly areas. Outward and downward movement of mass consisting of rocks, slop instability and soils due to natural or manmade causes is termed as landslides. These events are associated with pre and post of earthquake, soil erosion, rainfall and anthropogenic activities.
However, the risk of landslide incidents could possibly be minimized if the knowledge of the potentially landslide prone areas are known in prior. Generally, the prediction of occurrence of a potentially landslides in future is represented in the form of landslide vulnerability zone map. Slope instability research and vulnerability mapping are substantial component of hazard management in decreasing the risk of living with landslides.
The process of creating the maps involves several qualitative or quantitative approaches (e.g., Soeters and Van Westen, 1996;
Aleotti and Chowdhury, 1999). Early attempts had defined susceptibility classes by qualitative overlaying of geological and morphological slope-attributes to landslide inventories (Nielsen et al., 1979). However, more sophisticated assessments involved techniques such as AHP, bivariate, multivariate, logistic regression, fuzzy logic, or artificial neural network (ANN) have been reported in recent years.
The AHP is a theory of measurement dealing with quantifiable and intangible criteria. It has been applied to numerous areas, such as decision theory and conflict resolution. Using this method, each layer used in the landslide hazard zone is broken into smaller factors, then these factors are weighed based on their importance, and eventually the prepared layers are assembled and the final map is produced. It is based on three principles: decomposition, comparative judgment and synthesis of priorities. In this method, the weight of each layer depends on the judgment of expert, so that the more precise is the judgment, the more compatible is the produced map with reality. The increase of computer-based tools and techniques has been found to be useful in the hazard
mapping of landslides. One of such significant tools is geographic information systems (GIS).
2. AIM AND OBJECTIVES
2.1 Aim
The main aim of the study is to assess the landslides hazard zones for the Coonoor and Ooty, part of Kallar Sub Watersheds, The Nilgiris, Tamil Nadu using geospatial based Multicriteria decision analysis with AHP approach.
2.2 Objectives
The aim requires the following objectives:
I. Determination of various themes or factors for the hazard zone mapping and preparation of necessary thematic maps.
II. Determination of weights and ratings for the different themes in the analysis by applying AHP method.
III. Integration of different themes using GIS to prepare land slide hazard zones.
3. STUDY AREA
The study area is Coonoor and Ooty, part of Kallar Sub Watersheds, The Nilgiris, is situated in Eastern slope of Western Ghats stretching from West to the East. Study area comes under the part of the Nilgiri District. The Coonoor and Ooty areas are part of the Kallar watershed. Its significant basin is Bhavani river basin, which is the main in moyar and Bhavani River.
3.1 Location
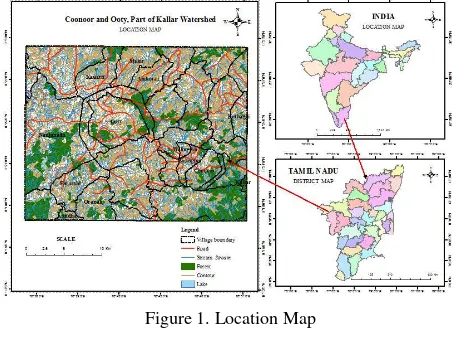
Present study area fallows under 11° 16' 58.7"N to 11° 29' 23.9"N latitude and 76° 35' 7.15"E to 76° 51' 15.97"E Longitudes, covers an area of 673 Sq.Km. It comes under Nilgiris district and this study area covers 3 taluks, Coonoor, Kothagiri, Udhagamandalam, and it consists of 22 Revenue Villages (Figure.1).
Topography of the study area is relatively steep with elevation range from 550 m to 2600 m. About 85% of areas are mountains covered with diverse plant communities that form various types of forest along with agricultural activities, especially Tea, coffee plantation, vegetables and orchards, which are normally cultivated in the upper and the lower area (Figure.2). The climate of this area is temperate for more than half of the year. The average day temperature of the sub watershed is 16.15° C and the average rainfall is about 901.65mm. The winter is relatively cool. The maximum rainfall is received during the month of October and November.
The Study area falls in the following soil group’s Clayey Soil, Gravelly Clay Soil, Gravelly Loam Soil and it covers around 3 lakhs of population. This area has got a large number of beauty spots such as Ooty botanical garden, boat house, Paikara Dam, Kattery waterfalls, Log falls, Catherine falls, Lamb’s rock, Dolphin nose view point, Kallar, Sim’s park in Coonoor is a well known tourist attraction. In the recent years, the study area has experienced several devastated landslide incidents that brought vast damage to properties and natural environment, and loss of human life.
Figure 1. Location Map
Figure2. Elevation Map
4. DATA AND METHODLOGY
4.1 Data
In this study, for preparing the landslide hazard zone map, ten factors were considered which are Elevation, Slope Aspect, Slope Angle, Distance from Road, Lineament Density, Stream Density, Soil, Rainfall, Land use/Land cover (Lu/Lc), and the normalized difference vegetation index (NDVI). Elevation, Slope Aspect, Slope Angle, were derived from Digital Elevation model and 20 meter contour, while Lu/ Lc and NDVI were derived from Landsat-8, Feb-2014 satellite image. Other base layers like streams, road network, contour, settlements, were captured from SOI toposheets are followed by 58 A/11 and 58 A/15. The working scale of geographic maps was chosen at 1:50,000. All the collected data were converted to a raster grid with 25 m × 25 m cells for the use with AHP technique. The total cell number is 29, 85,838 for this study. Arc GIS 10.1 and Erdas 9.2 were used to prepare thematic maps and layers.
Elevation, Slope Aspect, Slope Angle were derived from Digital Elevation model and 20 meter contours. The elevation ranges from 550m to 2600m equally classified into 300 m interval. Slope aspect was determined by the down-slope direction of the maximum rate of change in value from each cell to its neighbours. Final results were reported in terms of the 8 basic
compass directions on the output map. The slope angle command takes an input surface raster and calculates an output raster containing the slope angle at each cell. The lower the slope angle value, the flatter the terrain; the higher the slope angle value, the steeper the terrain. The output slope angle raster can be calculated as percent slope angle or degree of slope angle.
In addition road and drainage map were derived from toposheets. The drainage density was calculated. The distance to road buffer was calculated at 100 meter interval. The lineament map was prepared from Bhuvan data, and lineament density was calculated. The soil depth map prepared from block level soil map. The precipitation data were provided by the Indian Meteorological Department (IMD) over the period of the study, and the spline interpolation method was used to produce rainfall intensity map of the area.
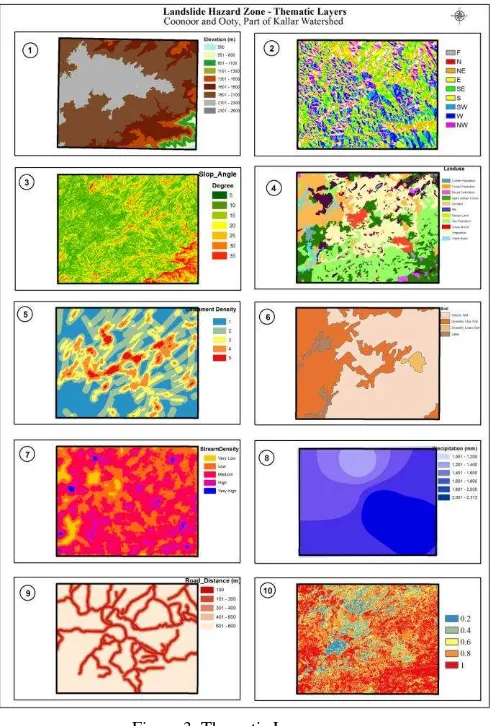
LULC data were generated from Landsat-8 image using a hybrid method and the study area was classified in to ten classes which are coffee plantation, tea plantation, Urban mixed, rural mixed, orchards, Range land, and water body were identified for Lu/Lc. Finally, the NDVI was generated, its values range from -1 to +-1 (pixel values 0–255) (Figure 3)
4.2 Methodology
In this study, the Analytical Hierarchy Process (AHP) technique was used to produce landslide hazard zone map for the Coonoor and Ooty area, part of Kallar watershed, which is being one of the well-known landslide hotspots in Tamil Nadu. To achieve this, the relevant thematic layers pertaining causative factors were generated using remotely-sensed data, field visits and GIS tools. Landslide hazard zone map of the study area was eventually prepared using AHP method. Finally the Landslide Hazard Zone Index (LHZI) value for each considered pixel was computed by summation of each factor ’s weight multiplied by class weight of each referred factor (for that pixel) written as follows:
LHZI ( )
n i j i j
W R (1)
where LHZI is the required landslide hazard zone index of the given pixel, Rj and Wi are class weight (or rating value) and the factor weight for factor i derived using AHP technique
Figure 3. Thematic Layers
5. ANALYTICAL HIERARCHY PROCESS (AHP)
The landslide hazard zone map, multicriteria decision analysis based various methods, such as fuzzy logic, statistic methods and AHP can be used. Present study of AHP techniques was followed. The present study of AHP techniques was applied. AHP involves building a hierarchy of decision elements (factors) and then making comparisons between possible pairs in a matrix to give a weight for each element and also a consistency ratio. It is based on three principles: decomposition, comparative judgment and synthesis of priorities.
Analytical hierarchy process (AHP) is a semi-qualitative method, which involves a matrix-based pair-wise comparison of the contribution of different factors for land sliding. It was developed by Saaty (1980) and gained widespread attention later on. Factor weight of each criterion is determined by a pair- wise comparison matrix as described by Saaty (1990, 1994), and Saaty and Vargas (2001). To get factor weights in AHP, one has to build a pair-wise comparison matrix with scores given in Table 1.
In the construction of a pair- wise comparison matrix, each reciprocals 1/2 and 1/9. Since we have used ten parameters, the comparison matrix has 100 boxes. However, because the pair-wise comparison matrices are symmetrical in nature, only 55 corresponding values are, therefore, reciprocal with each other. Once the matrix is constructed, weights whose sum equals one, will be obtained by computer based image processor with thematic layers of all causal factors categorized on the basis of class weights as inputs..
Scales Degree of preferences
Descriptions
1 Equally Two activities contribute equally to the objective. 3 Moderately Experience and judgment
slightly to moderately favour one activity over another. 5 Strongly Experience and judgment
strongly or essentially favour
Table 1. Fundamental scales for pair-wise comparisons
In AHP, for checking consistency of matrix, consistency ratio is used, which depends on the number of parameters. The consistency ratio (CR) is obtained by comparing the consistency index (CI) with average random consistency index (RI).The consistency ratio is defined as
CR CI
RI
(2)
Where, CI is the consistency index which is expressed as:
max matrix and it is computed from the matrix and n is the order of the matrix. And the average random consistency index (R.I.) is derived from a sample of randomly generated reciprocal matrices using the scales 1/9, 1/8,…., 8 and 9.
Table 2. Random Consistency Index (RI)
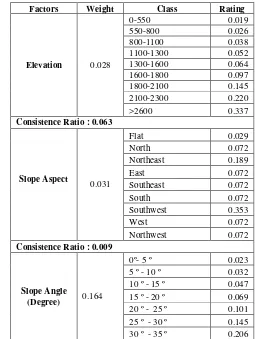
The final result consists of the derived factor weights and class weights, and a calculated consistency ratio (CR), as seen in (Table 3). In AHP, the consistency used to build a matrix is checked by a consistency ratio, which depends on the number of parameters. For a 10×10 matrix, the CR must be less than 0.1 to accept the computed weights. The models with a CR greater than 0.1 were automatically rejected, while a CR less than 0.1 were often acceptable.
In this study, the CR is 0.066, the ratio indicates a reasonable level of consistency in the pair-wise comparison, that is good enough to recognize the factor weights. Consequently, the weight corresponding to precipitation is highest, whereas elevation is lowest (Table 3). For all cases of the gained class weights, the CR is less than 0.1, the ratio indicates a reasonable level of consistency in the pair-wise comparison that was good enough to recognize the class weights.
Table 3 Par-wise comparison matrix
Factors Weight Class Rating
Elevation 0.028
>35 º 0.377
Table 4. Weight, Class rating and Consistence ratio
6. RESULT AND DISCUSSION
Applying the AHP, the LHZI values were computed by using Equation (1). From the calculation, it was found that the LHZI had a minimum value of 0.06, and a maximum value of
0.34, with an mean value of 0.16 and a standard deviation of 0.04. The LHZI represents the relative hazards of a landslide occurrence. Therefore, the higher the index, the more hazard area is to landslide.
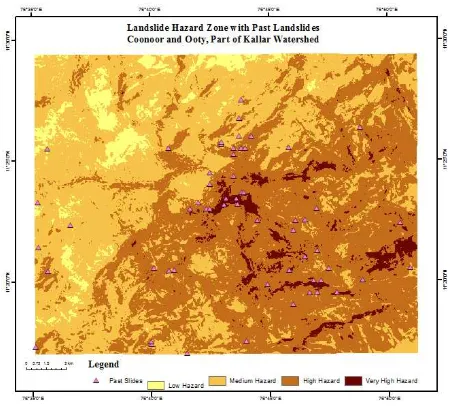
These LHZI values were then divided into five classes based on the natural breaks range, which represent five different zones in the landslide hazard zone map. These are Very High Hazard, High Hazard, Medium Hazard, Low Hazard, (Figure.4). The percentage covering areas of each hazard zone classes are shown in (Table 5) along with number of known landslide locations occurred.
The LHZI data seen in (Table 5), it shows Zone IV (very high hazard -3.56%) and Zone III (high hazard - 48.19%) total 51.75 % area are very critical zones and they had accommodate about 71% of the landslide reference points. Other areas are located in zone II (medium hazard - 43.63%), and Zone I (low hazard –
Figure 4. Landslide vulnerability zone map based on AHP
6.1 Conclusion
In this study, the analytical hierarchy process (AHP) was applied to develop landslide susceptibility map for the Coonoor and Ooty, part of Kallar watershed located in Nilgiri District. To achieve this objective, ten landslide inducing factors were taken into consideration, which are elevation, slope aspect, slope angle, distance from road, drainage density, lineament density, soil depth, precipitation, land use/land cover (LULC) and NDVI. The first eight parameters were extracted and calculated from their associated database while LULC and NDVI maps were derived from Landsat-8 satellite image. These factors were evaluated, and then factor
weight and class weight were assigned to each of the associated factors.
Figure 4.1. Landslide vulnerability zone map based on AHP with known landslide locations
Based on the results given in Table 4, the three most influencing factors to landslide activity (judged from their associated weights) are precipitation (0.259), distance to road (0.170), and slope angle (0.164). And the three least influencing factors are elevation (0.028), slope aspect (0.031), and drainage density (0.033). The obtained vulnerability map and its relevant data (Figure 4 and Table 5) indicate that the very high and high hazard zones cover about 51.75 % of the total area while about 48.25% were classified as moderate and low hazard zones.
REFERENCES
Leventhal, R. A., Kotze, P.G.,(2008). Landslide susceptibility and hazard mapping in Australia for land-use planning with reference to challenges in metropolitan suburbia. Engineering Geology., 102, 238–250.
Moreiras, S.M., (2004). Landslide incidence zonation in the Rio Mendoza Valley. Mendoza province, Argentina. Earth Surface Processes and Landforms., 29 (2): 255–266.
Yagi, H. (2003). Development of assessment method for landslide hazardness by AHP. Abstract Volume of the 42nd Annual Meeting of the Japan Landslide Society, p. 209–212.
Yalcin, A. (2008). GIS-based landslide susceptibility mapping using analytical hierarchy process and bivariate statistics in Ardesen (Turkey). Catena., 72, 1–12.
Vijith, H. and Madhu, G. (2008). Estimating potential landslide sites of an upland sub-watershed in Western Ghat’s of Kerala (India) through frequency ratio and GIS. Environ Geol, 55:1397-1405.
Saaty, T.L., (1980). The Analytical Hierarchy Process, McGraw Hill, New York.
Saaty, T.L. and Vargas, L.G. (2001). Models, Methods, Concepts, and Applications of the Analytic Hierarchy Process. 1st ed. Kluwer Academic, Boston, 333p.
Saha, A.K., Gupta, R.P., Arora, M.K., (2002). GIS-based landslide hazard zonation in the Bhagirathi (Ganga) valley, Himalayas. International Journal of Remote Sensing, 23 (2): 357–369.
Van Westen, C.J., Castellanos Abella, E.A., and Sekhar, L.K. (2008). Spatial data for landslide susceptibility, hazards and vulnerability assessment: an overview. Eng Geol, 102(3-4):112-131.
Mwasi, B. (2001). Land use conflicts resolution in a fragile ecosystem using Multi- Criteria Evaluation (MCE) and a GIS-based Decision Support System (DSS). Proceedings of the International Conference on Spatial Information for Sustainable Development; October 2-5, 2001; FIG-International Federation of Surveyors; Nairobi, Kenya, p. 11.
Malczewski, J., (1999). GIS and Multi-criteria Decision Analysis, JohnWiley and Sons, New York.
Lee, S., (2005). Application of logistic regression model and its validation for landslide susceptibility mapping using GIS and remote sensing data. International Journal of Remote Sensing., 26 (7): 1477–1491.
Komac, M. (2006). A landslide susceptibility model using the Analytical Hierarchy Process method and multivariate statistics in perialpine Slovenia. Geomorphology., 74, 17–28.
Ercanoglu, M., O. Kasmer and N. Temiz, (2008). Adaptation and comparison of expert opinion to analytical hierarchy process for landslide susceptibility mapping. Bull. Eng. Geol. Envir., 67: 565-578.
Nandi, A., Shakoor, A. (2009). A GIS-based landslide susceptibility evaluation using bivariate and multivariate statistical analyses. Engineering Geology., 110 (1-2): 11-20.
Ayalew, L., Yamagishi, H., and Ugawa, N.(2004). Landslide susceptibility mapping using GIS-based weighted linear combination, the case in Tsugawa area of Agano River, Niigata Prefecture, Japan. Landslides, 1:73–81.
Revised April 2014