Nur Yanuary Koswara, 2015
IMPLEMENTING TASK-BASED LANGUAGE TEACHING IN TEACHING SPEAKING Universitas Pendidikan Indonesia | repository.upi.edu | perpustakaan.upi.edu
20 CHAPTER III
RESEARCH METHODOLOGY
Chapter three presents the methodology on conducting this study. This
chapter provides four main parts of the investigation: research design, data
collection technique, research procedures, and data analysis technique.
3.1Research Design
Quantitative method in the forms of quasi-experimental design was
employed in this study, with nonrandomized or non-equivalent pre-test and
post-test groups. Task-Based Language Teaching (TBLT) treatments were
implemented in the experimental group of this study, whereas, the control group
was the class which did not get TBLT treatments. This design was used because it
allows for attempts to fulfill standards of the true experimental design as closely
as possible (Hatch and Farhady, 1982).
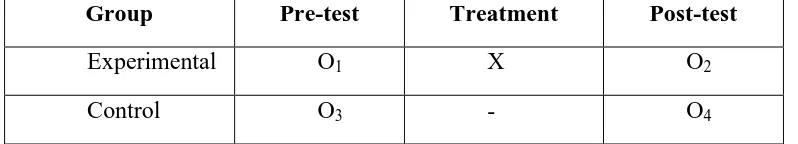
The quasi-experimental design using nonrandomized control group
pre-test and post-pre-test design can be depicted bellow:
Table 3.1
Research Design
Group Pre-test Treatment Post-test
Experimental O1 X O2
Control O3 - O4
Note:
- X refers to the exposure of a group to an experimental variable
- O refers to the process of observation or measurement
Nur Yanuary Koswara, 2015
IMPLEMENTING TASK-BASED LANGUAGE TEACHING IN TEACHING SPEAKING Universitas Pendidikan Indonesia | repository.upi.edu | perpustakaan.upi.edu
21
As cited from Hatch and Farhady (1982, p. 51), a variable can be defined
as an attribute of a person, a piece of text, or an object which varies from
person to person, text to text, object to object, or from time to time. In
research, there are two kinds of variable, independent variable and dependent
variable. Independent variable is the variable which is selected, manipulated, and
measured by the researcher, while the dependent variable is the variable which a
researcher observes to determine the effect of the independent variable. The
independent variable of the research is TBLT approach and the dependent
variable is the students’ speaking skill.
Hypothesis is defined as a formal affirmative statement predicting a single
research outcome, a tentative explanation of a relationship between two or more
variables. It also limits the focus of investigation to a define target and determines
what observations are to be made (Best and Kahn, 2006). Null hypothesis is the
common hypothesis in which stated there is no difference (Hatch & Farhady,
1982). Null hypothesis is known as statistical hypothesis (Arikunto, 2010, p. 113).
Therefore, the hypothesis of this study was as follows:
H0 = There is no significance difference between students’ post-test scores
in experimental group and control group.
HA = There is a significance difference between students’ post-test in
experimental group and control group.
3.2Data Collection
3.2.1 Population and Sample
Population is any group or individuals that have one or more
characteristics in common that are of interest of the researcher; while sample
are a small proportion of a population selected for observation and analysis
(Best, 1981). The sample of this study was chosen purposively, based on the
same number of students and absence of significant difference between scores
Nur Yanuary Koswara, 2015
IMPLEMENTING TASK-BASED LANGUAGE TEACHING IN TEACHING SPEAKING Universitas Pendidikan Indonesia | repository.upi.edu | perpustakaan.upi.edu
22
The population of this study was second grade students of one senior
high school in Majalengka whereas two classes were used as the sample: one
class for the experimental group and the other one for the control group.
3.2.2 Research Instruments
Research instrument is a tool which is used in collecting data
(Arikunto, 2010, p. 203). The data were collected to answer research questions
of a study. There were two kinds of research instruments utilized in this study;
pre-test, post-test, and interviews. The pre-test was conducted to both
experimental and control group before the treatment, in order to measure
students’ ability of spoken narrative texts. The post-test was conducted to both groups after the treatment, in order to see whether or not there is a change on
students’ spoken narrative texts ability. The questionnaire was conducted to
the experimental group only. It was aimed to find out students’ responses
toward the implementation TBLT communicative approach.
The pre-test and post-test in this study were in the form of a speaking
test. The taped performance was used because it can be kept as evidence to
support the teacher’s judgments and it is available for checking by others if
the teacher is unsure about assigning a score or grade to a particular student,
as suggested by Brown and Yule (1999, p. 105).
Filling questionnaire was conducted in the last meeting. Questionnaire
was distributed to 20 students of the experimental group. The questionnaire
was distributed to explore students’ responses toward TBLT and to find out
the advantages and disadvantages of the approach based on students’
responses.
3.2.3 Research Procedures
3.2.3.1Organizing Teaching Procedures
In organizing teaching procedures, the researcher served as the teacher
and facilitator for both experimental and control groups. The teaching
Nur Yanuary Koswara, 2015
IMPLEMENTING TASK-BASED LANGUAGE TEACHING IN TEACHING SPEAKING Universitas Pendidikan Indonesia | repository.upi.edu | perpustakaan.upi.edu
23
appropriate materials for the teaching and learning processes during the
treatment. The material was about spoken narrative text. Spoken narrative text
was chosen as the material of this study because it was appropriate with the
Competence Standard and Basic Competence. The second step was organizing
teaching procedure. The teaching procedure in the experimental class
employed TBLT approach while the control group employed
Presentation-Practice-Production.
3.2.3.2Organizing the Research Instruments
An instrument is used to gather data (Cresswell, 2008, p. 90). In this
research, organizing the research instruments includes creating the test item
for both pre-test and post-test and constructing closed and opened
questionnaire.
The first instrument was students’ pre-test and post-test scores in order to answer the first research question that investigates the effectiveness of
Task-Based Language Teaching (TBLT) in teaching spoken narrative text.
Then, the second instrument, questionnaires, was distributed to answer the
second research question which gives the information about students’
responses to TBLT approach in spoken narrative text. The questionnaire
consists of 12 questions in a form of likert scale.
3.2.3.3Testing the Validity of the Pre-Test and Post-Test through the
Pilot Test
The pre-test and post-test were examined to find out whether or not the
items have face and content validity. To test the two kinds of validity, the test
item was pilot-tested to ten students of the same school with the subjects in
this study. At first, the ten students were asked to read the instruction
contained in the test item, in order to find out whether or not the instruction
was understandable and clear enough. This was conducted to examine the face
validity of the test item. Then, because the instruction was found to be clear,
Nur Yanuary Koswara, 2015
IMPLEMENTING TASK-BASED LANGUAGE TEACHING IN TEACHING SPEAKING Universitas Pendidikan Indonesia | repository.upi.edu | perpustakaan.upi.edu
24
were examined, to find out whether or not the students had performed the
particular language skills and areas expected in the test item.
3.2.3.4Administering Pre-test to Experimental and Control Group
Administering pre-test to experimental and control group was
conducted before conducting the treatment in order to portray students’ ability
of spoken narrative text.
3.2.3.5The Teaching Program
The experimental group and the control group used a different
treatment. The treatment in the form of Task-Based Language Teaching
(TBLT) was only carried out in the experimental group, while the
Presentation-Practice-Production was carried out in the control group. The
learning materials and context were approximately similar, only the methods
were different.
3.2.3.5.1 Experimental Group
In conducting the treatments, the researcher acted as the teacher.
The teacher used Task-Based Language Teaching (TBLT) approach
during teaching learning process in teaching spoken narrative texts in the
experimental group.
The treatments were carried out in five meetings in which lasted
for 90 minutes for each meeting. The treatments’ process that applied TBL
approach in spoken narrative text will be systematically interpreted below:
Step 1: Create a number of schema-building tasks.
The material given in this study was spoken narrative text. Spoken
narrative text was chosen as the material of this study because it was
appropriate with the SKKD. In this step, teacher introduces the topic,
decides the context for the task, and introduces some keywords as the
Nur Yanuary Koswara, 2015
IMPLEMENTING TASK-BASED LANGUAGE TEACHING IN TEACHING SPEAKING Universitas Pendidikan Indonesia | repository.upi.edu | perpustakaan.upi.edu
25
31). Teacher chose a topic that is closely related to the students’ real life in
order to make them motivated in doing the tasks.
Step 2: Give learners controlled practice in the target language vocabulary, structures and functions (Nunan, 2004, p. 31). Students were
given worksheet related to the topic and vocabularies gained in the
previous step.
Step 3: Give learners authentic listening practice (Nunan, 2004, p. 32). This step might use worksheet and video as the media. The students
watch some videos while they have to fill in a worksheet.
Step 4: Focus learners on linguistic elements, e.g. grammar and vocabulary (Nunan, 2004, p. 31). This step focuses on the grammar and
vocabularies of the material being given.
Step 5: Provide freer practice (Nunan, 2004, p. 32).
Students were asked to work in groups. On the first day, the
students were asked to brainstorm their idea helped by their own team. On
the second, third, and fourth day, the groups’ job was to practice together
and to give some feedbacks to the members in order to help improving the
students’ speaking skill.
Step 6: Pedagogical task.
In this step, students have to perform their spoken narrative text
with the chosen topic using their own ideas. In this step, the students feel
more confident in doing final task alone after getting much input through
the sequence of tasks (Nunan, 2004, p. 33). This step was done in the last
meeting and considered as post-test.
3.2.3.5.2 Control Group
In conducting the treatments, the researcher acted as the teacher.
The teacher used Presentation-Practice-Production approach during
teaching-learning process in teaching spoken narrative texts in the control
Nur Yanuary Koswara, 2015
IMPLEMENTING TASK-BASED LANGUAGE TEACHING IN TEACHING SPEAKING Universitas Pendidikan Indonesia | repository.upi.edu | perpustakaan.upi.edu
26
The class was conducted in five meetings which lasted for 90
minutes for each meeting. The teaching process that applied
Presentation-Practice-Production in spoken narrative text will be systematically
interpreted below:
Step 1: Class Presentation
In the class presentation, teacher delivered the materials about
spoken narrative text to the students. The teacher delivered the
material through lecturing to build students knowledge before the
presentation. Class presentation is done in every meeting.
Step 2: Students’ Practice
In this step, students were asked to work in groups. This step
was given in every meeting. On the first day students were asked to
brainstorm their own idea individually. Then, on the second, third, and
fourth meeting, the students were asked to perform in groups and
giving feedback to each other.
Step 3: Production
This is the last step of PPP approach. Students were asked to
students have to perform their spoken narrative text with the chosen
topic using their own ideas. The students were given 5 minutes to
perform. This step was done in the last meeting and considered as
post-test.
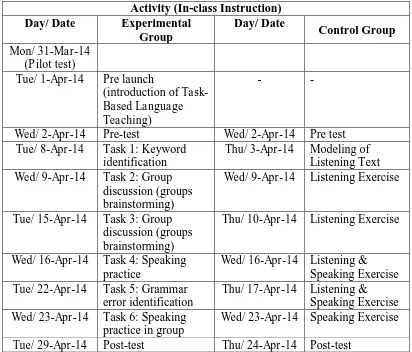
Although the approaches were different, the learning materials and context
were approximately similar between experimental group and control group, as can
Nur Yanuary Koswara, 2015
IMPLEMENTING TASK-BASED LANGUAGE TEACHING IN TEACHING SPEAKING Universitas Pendidikan Indonesia | repository.upi.edu | perpustakaan.upi.edu
27
Tue/ 1-Apr-14 Pre launch
(introduction of Task-Based Language Teaching)
- -
Wed/ 2-Apr-14 Pre-test Wed/ 2-Apr-14 Pre test
Tue/ 8-Apr-14 Task 1: Keyword
identification
Thu/ 10-Apr-14 Listening Exercise
Wed/ 16-Apr-14 Task 4: Speaking
practice
Wed/ 16-Apr-14 Listening & Speaking Exercise
Tue/ 22-Apr-14 Task 5: Grammar
error identification
Thu/ 17-Apr-14 Listening & Speaking Exercise
Wed/ 23-Apr-14 Task 6: Speaking
practice in group
Wed/ 23-Apr-14 Speaking Exercise
Tue/ 29-Apr-14 Post-test Thu/ 24-Apr-14 Post-test
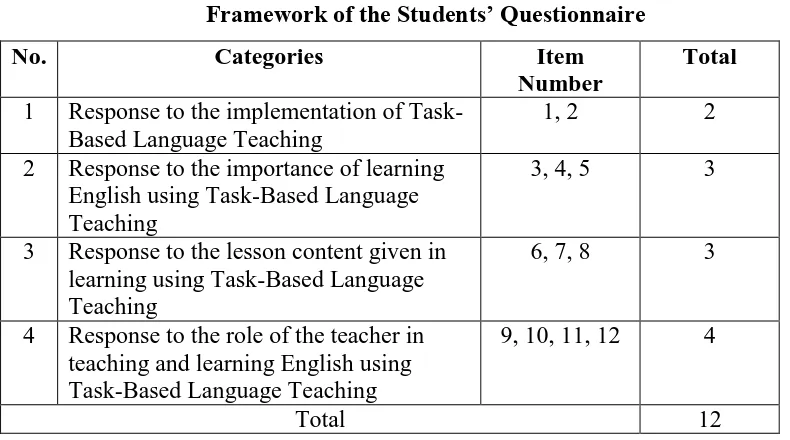
3.2.3.6Distributing Questionnaires
Questionnaires were distributed to 20 students in the experimental
group. The questionnaire consisted of 12 questions in the form of
closed-coded questionnaire. Closed questionnaire consists of five responses category:
strongly agree, agree, undecided, disagree, and strongly disagree. The
questionnaires were distributed to find out students’ responses toward TBLT.
Nur Yanuary Koswara, 2015
IMPLEMENTING TASK-BASED LANGUAGE TEACHING IN TEACHING SPEAKING Universitas Pendidikan Indonesia | repository.upi.edu | perpustakaan.upi.edu
28
Consist of 12 positive statements; presented below the framework of
the Questionnaire:
Table 3.3
Framework of the Students’ Questionnaire
No. Categories Item
Number
Total
1 Response to the implementation of Task-Based Language Teaching
1, 2 2
2 Response to the importance of learning English using Task-Based Language Teaching
3, 4, 5 3
3 Response to the lesson content given in learning using Task-Based Language Teaching
6, 7, 8 3
4 Response to the role of the teacher in teaching and learning English using Task-Based Language Teaching
9, 10, 11, 12 4
Total 12
3.2.4 Data Analysis
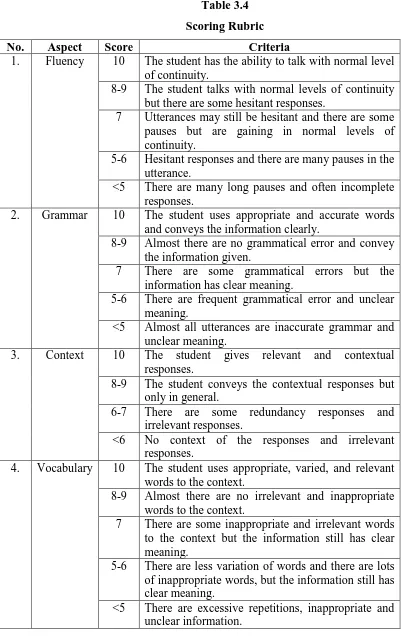
3.2.4.1Scoring Rubric
As the pre-test and post test scores were the main data analyzed in this
study, the process of generating scores from the students’ work in the pre-test and post-test would use appropriate scoring rubric. The scoring rubric used in
Nur Yanuary Koswara, 2015
IMPLEMENTING TASK-BASED LANGUAGE TEACHING IN TEACHING SPEAKING Universitas Pendidikan Indonesia | repository.upi.edu | perpustakaan.upi.edu
29
Table 3.4
Scoring Rubric
No. Aspect Score Criteria
1. Fluency 10 The student has the ability to talk with normal level of continuity.
8-9 The student talks with normal levels of continuity but there are some hesitant responses.
7 Utterances may still be hesitant and there are some pauses but are gaining in normal levels of continuity.
5-6 Hesitant responses and there are many pauses in the utterance.
<5 There are many long pauses and often incomplete responses.
2. Grammar 10 The student uses appropriate and accurate words and conveys the information clearly.
8-9 Almost there are no grammatical error and convey
5-6 There are less variation of words and there are lots of inappropriate words, but the information still has clear meaning.
Nur Yanuary Koswara, 2015
IMPLEMENTING TASK-BASED LANGUAGE TEACHING IN TEACHING SPEAKING Universitas Pendidikan Indonesia | repository.upi.edu | perpustakaan.upi.edu
30 3.2.4.2Normal Distribution Test
In order to calculate the normal distribution of a set of data, the
Kolmogorov-Smirnov test was used in this research. The test compared the
scores in the sample to a normally distributed set of scores with the same
mean and standard deviation (Field, 2005). The test was employed through
SPSS 18.0 for Windows.
Conducting the normal distribution test included three steps: stating
the hypothesis and setting the alpha level; analyzing the scores using the
Kolmogorov-Smirnov formula; and interpreting the output data. For the first
step, the alpha level set is at 0.05 (two-tailed test) and the hypothesis is as
follows:
H0: The score between experimental and control group is normally
distributed
HA: The scores between experimental and control group is not
normally distributed
The output data were interpreted by this way: if the result is
non-significant (p < 0.05) it means that the distribution of the sample is
significantly different from normal distribution (probably normal). If the result
is significant (p > 0.05) then the distribution is not significantly different from
normal distribution (Field, 2005).
3.2.4.3Homogeneity Variance
Homogeneity variance was calculated after calculating the normal
distribution test between experimental group and control group. The first step
in the measuring data was stating the hypothesis. In this study, the null
hypothesis was stated. The null hypothesis (H0) is that the variances of the
control and experimental groups are homogenous. Afterwards, the next step
was getting the level of significant 0.05, measuring homogeneity variance
using Laverne’s test and alpha level of significant. If Asymp. Sig < 0.05, the
Nur Yanuary Koswara, 2015
IMPLEMENTING TASK-BASED LANGUAGE TEACHING IN TEACHING SPEAKING Universitas Pendidikan Indonesia | repository.upi.edu | perpustakaan.upi.edu
31
contrary, if Asymp. Sig > 0.05, the null hypothesis is accepted which means
the variance data of two group is equal (Hatch & Faradhy, 1982).
3.2.4.4Independent t-test
Independent t-test was used to analyze the significant differences
between the students’ means score of their first draft in experimental and
control groups. The first step was stating the null hypothesis in which it states
that there is no significant difference of means between the control group and
experimental groups. Then, the next step was setting the level of significance
t-test 0.05 (two-tailed). If the significance value of students’ score of the
control and experimental group is smaller than 0.05, then Ho is rejected. On
the other side, if the significance value is larger than 0.05, then Ho is retained
(Hatch & Farhady, 1982, p. 88). After that, the next step was calculating t-test
score using SPSS 18.0; comparing tobt and tcrit. If tobt > tcrit, it means that the
hypothesis is not rejected, there is a significant difference between two
groups. In contrary, if tobt < tcrit, it means that the hypothesis is rejected, there
is no significance difference between the two groups (Kranzler and Moursund,
1999).
3.2.4.5Effect Size
The effect size was used to determine how significant the impact of the
treatments was to the experimental groups’ scores. Effect size has positive
correlation to its value. The larger effect size value is the larger of treatment
will be (Coolidge, 2000). The formula of effect size is described as follow:
� = √ � � + ��
Note:
r = effect size
t = t obt or t value from the calculation of independent t test
Nur Yanuary Koswara, 2015
IMPLEMENTING TASK-BASED LANGUAGE TEACHING IN TEACHING SPEAKING Universitas Pendidikan Indonesia | repository.upi.edu | perpustakaan.upi.edu
32
Value of effect size is described in the table below:
Table 3.5
Scale of Effect Size
Effect Size r value
Small .100
Medium .243
Large .371
(Coolidge, 2000, p. 151)
3.2.5 Data Analysis of the Questionnaire
3.2.5.1Validity of Questionnaire
The validity of the questionnaire was employed through Ms. Office
Excel 2007 using the sample of the experimental group questionnaire. The
question items in a questionnaire can be said valid if rot > rcrit, while if rot <
rcrit, it can be said that it is not valid (Arikunto, 1998). The result was
calculated by comparing the robt to rcrit with N = 10 and α = .05.
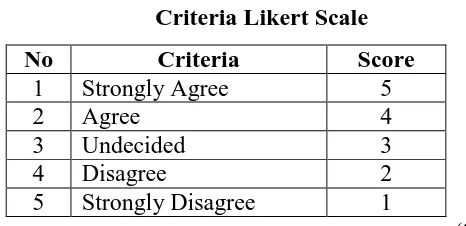
3.2.5.2Likert Scale
The questionnaires were distributed to the sample after questionnaire had
been ensured to be valid. The questionnaire in this study consisted of 12
statements. Each statements had five various alternative options that should be
chosen by the students. The study used Likert scale with typical five-level as
shown in table below.
Table 3.6
Criteria Likert Scale
No Criteria Score
1 Strongly Agree 5
2 Agree 4
3 Undecided 3
4 Disagree 2
5 Strongly Disagree 1
Nur Yanuary Koswara, 2015
IMPLEMENTING TASK-BASED LANGUAGE TEACHING IN TEACHING SPEAKING Universitas Pendidikan Indonesia | repository.upi.edu | perpustakaan.upi.edu
33
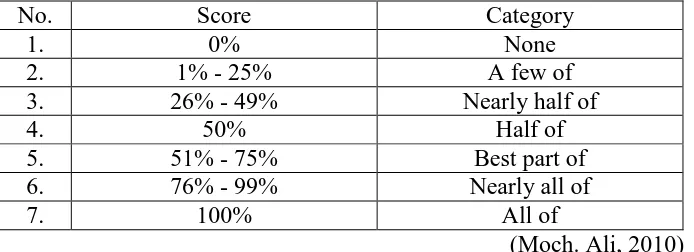
Afterwards, the response frequencies were computed into percentages. The
following presents the formula to calculate the percentages. (Ningrat, 2000 cited
in Nurlaila, 2013).
p = �� � �
An the last, to interpret the scores by looking the following rule:
Table 3.7
Percentage Classification
No. Score Category
1. 0% None
2. 1% - 25% A few of
3. 26% - 49% Nearly half of
4. 50% Half of
5. 51% - 75% Best part of
6. 76% - 99% Nearly all of
7. 100% All of
(Moch. Ali, 2010)
P = Percentage
F o = Frequency
N = The number of Respondent