www.elsevier.com/locate/eja
Spatial and temporal distribution of the root system and root
nutrient content of an established
Miscanthus
crop
D. Neukirchen, M. Himken, J. Lammel, U. Czypionka-Krause, H.-W. Olfs *
Centre for Plant Nutrition and Environmental Research, Hydro Agri, Hanninghof 35, D-48235 Du¨lmen, Germany
Accepted 10 April 1999
Abstract
Although a high biomass yield is obtained from established Miscanthuscrops, previous studies have shown that fertilizer requirements are relatively low. As little information on the role of the Miscanthus roots in nutrient acquisition is available, a study was conducted to gather data on the Miscanthus root system and root nutrient content. Therefore in 1992, the root distribution pattern of an established Miscanthus crop was measured in field trials using the trench profile and the auger methods. Also, in 1994/1995, seasonal changes in root length density (RLD) and root nutrient content were monitored three times during the vegetation period.
The trench profile method showed that roots were present to the maximum depth measured of 250 cm. The top soil (0–30 cm) contained 28%of root biomass, while nearly half of the total roots were present in soil layers deeper than 90 cm. Using the auger method, we found that RLD values in the topsoil decreased with increasing distance from the centre of the plants. Below 30 cm, RLD decreased markedly, and differences in root length in the soil between plants were less pronounced. The total root dry weight down to 180 cm tended to increase from May 1994 (10.6 t ha−1) to November 1994 (13.9 t ha−1) and then decreased again until March 1995 (11.5 t ha−1). Nutrient concentrations in the roots decreased with increasing depth. The concentrations of N (0.7–1.4%) and K (0.6–1.2%) were clearly higher than those of P (0.06–0.17%). The mean values for N, P and K contents of the roots of all three sampling dates in 1994/1995 were 109.2 kg N ha−1, 10.6 kg P ha−1and 92.5 kg K ha−1.
Although our results showed that RLD values forMiscanthusin the topsoil are lower than for annual crops, the greater rooting depth and the higher RLD ofMiscanthus in the subsoil mean that nutrient uptake from the subsoil is potentially greater. This enables Miscanthus crops to overcome periods of low nutrient (and water) availability especially during periods of rapid above-ground biomass growth. © 1999 Elsevier Science B.V. All rights reserved.
Keywords:Auger method;Miscanthus; Root length density; Root nutrient content; Root system; Trench profile method
1. Introduction (Greef and Deuter, 1993; hereafter called
Miscanthus), a herbaceous perennial originating from East Asia, is an interesting option because Over the last few years, the cultivation of
non-of its fast growth rate and high yield level under food crops has been promoted in Europe to replace
European conditions (Nygaard Nielsen, 1988; fossil energy sources. Miscanthus×giganteus
Schwarz et al., 1995; Greef, 1996). However, the fertilizer requirement of an establishedMiscanthus * Corresponding author. Tel.:+49-2594-798-217;
crop has been found to be rather small. Results
fax:+49-2594-7455.
E-mail address:[email protected] (H.-W. Olfs) from several field experiments have shown either
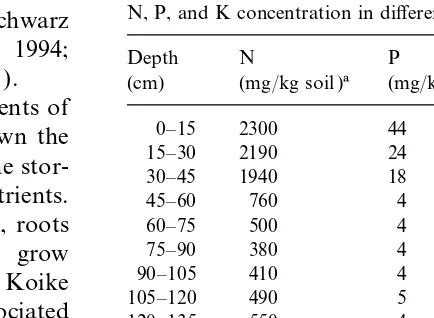
Table 1
no, or only insignificant, yield increases due to
N, P, and K concentration in different soil layers
fertilizer applications (e.g. Funk, 1993; Schwarz
et al., 1993; Lewandowski and Kahnt, 1994; Depth N P K
Himken et al., 1997; Mediavilla et al., 1997). (cm) (mg/kg soil )a (mg/kg soil )b (mg/kg soil )b A recent study on the nutrient requirements of
0–15 2300 44 154
Miscanthus(Himken et al., 1997) has shown the
15–30 2190 24 84
importance of below-ground rhizomes in the stor- 30–45 1940 18 57 age and mobilization/remobilization of nutrients. 45–60 760 4 28
60–75 500 4 32
Although rhizomes are first formed in July, roots
75–90 380 4 26
originating from these rhizomes do not grow
90–105 410 4 26
before shooting starts the following year. Koike
105–120 490 5 35
et al. (1975) reported that rhizomes and associated 120–135 550 4 30 shoot bases begin to shoot in late April/early May. 135–150 500 4 28
150–165 550 5 50
About a month after the start of shoot elongation,
165–180 600 5 37
roots begin to grow. The roots of a rhizome are only active during the year the rhizome sends up
aTotal soil N according to Kjeldahl digestion.
shoots, and regrowth of roots associated with older bP and K extraction with CAL. rhizomes is negligible. The maximum shoot
bio-mass is found in September, coincident with
anthe-sis, and almost all above-ground plant material studies were performed on the plots receiving 90 kg N ha−1[for more details see Himken et al., dies before early November. However, root growth
continues until late October (Midorikawa et al., 1997]. 1975).
Little information exists on the role of the roots 2.2. Root measurements
in nutrient acquisition for a Miscanthus crop.
Therefore, this study focused on the root system Rooting patterns ofMiscanthuswere estimated using two methods: the trench profile method and ofMiscanthus. The aims were (1) to characterize
the root distribution pattern of an established the auger method (Bo¨hm, 1979). In May 1992, a trench (200 cm wide), oriented perpendicular to
Miscanthus crop and (2) to obtain information
about total root weight and nutrient content of the plant rows, was dug down to a depth of 250 cm. To expose the roots for counting, a 5 mm
Miscanthusroots.
soil layer was removed from the trench wall by water using a hand sprayer (Bo¨hm and Ko¨pke, 1977). A transparent plastic sheet with a
2. Material and methods
50×50 mm grid was fixed to the wall, and all visible roots regardless of their thickness were
2.1. Study site and trial set-up
marked with a permanent marker (Reijmerink, 1973). Roots in the 0–10 cm soil layer could not The study site was a Eutric fluvisol (sandy loam;
pH 7.1) located near the Rhine valley (N 51°31∞, be detected because of the presence of the rhi-zomes. The number of marks on the sheet were E 6°42∞) in Western Germany. The soil nutrient
status is summarized in Table 1. Further details on counted for each 5 cm soil layer. To calculate the root length density (RLD), these values were con-soil characteristics and cropping history have been
reported by Himken et al. (1997).Miscanthuswas verted, taking into acount a soil volume of 450 cm3 (180 cm width×5 cm depth of the soil planted at a rate of 10,000 plants ha−1 in May
1989 on a farmer’s field following a wheat crop. layer×0.5 cm thickness of the sprayed off soil layer).
After a 3 year establishment period, the plant
three times in the 1994/1995 vegetation period roots, a subsample was taken and stored at−5°C until determination of root length (RL) was pos-(May 1994, November 1994, March 1995). The
field was subdivided into four blocks and from sible. RL was measured by a modified line intersec-tion method (Newman, 1966 modified according each block five plants were chosen at random for
root sampling. Soil was sampled from the 0–90 cm to Tennant, 1975) using a 1.5×1.5 cm grid. The root length density (RLD; cm cm−3) was then and 90–180 cm soil layers using 10 cm and 8 cm
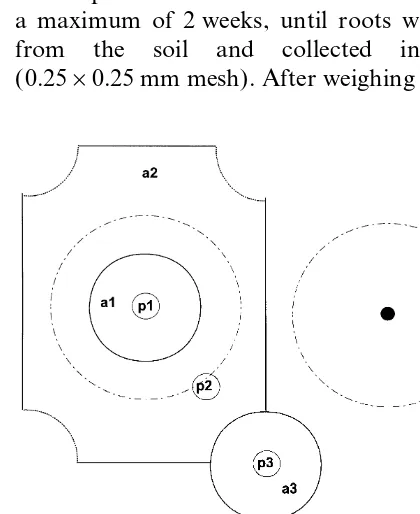
diameter augers, respectively. The cores were posi- calculated taking the respective soil volume into account (Garay and Wilhelm, 1983). In the tioned (i) at the centre of the plant (p1=area
effected directly by the rhizome), (ii) at the mid- 1994/1995 examination, the rest of the subsample from each depth, position and replicate was dried, way point between the rhizomes of four plants
(p3=area with smallest influ-ence from the plants) weighed again, dried and ground.
Total root dry weight (RDW; kg ha−1) was and (iii) mid-way between p1 and p3 (p2=area
with average conditions) ( Fig. 1). Cores were cut calculated, assuming that each of the three sam-pling positions (p1–p3) was representative for a into 15 cm segments. It was not possible to measure
roots in the 0–15 cm layer at position p1 due to specific area (a1=1104 cm2, a2=8592 cm2, and a3=1104 cm2; Fig. 1).
the presence of rhizome material in the cores. The
soil samples from the same position and depth of For analysis of the nutrients in the roots, a weighed sample from the four replicates was mixed each replicate were bulked and stored at 4°C for
a maximum of 2 weeks, until roots were washed and homogenized. N, P and K contents were determined following Kjeldahl digestion using an from the soil and collected in a sieve
(0.25×0.25 mm mesh). After weighing the cleaned automated continuous flow system (Holz, 1974). N and P were determined colorimetrically, and K was analysed with a flame photometer. The total nutrient content was defined as the product of RDW and nutrient concentration in the roots.
2.3. Data analysis
A statistical evaluation was only possible for RLD and RDW, because nutrient concentrations in the roots were measured in pooled samples. Differences in RLD and RDW between soil depth and sampling dates were analysed using the Tukey HSD test at the 5% level.
3. Results
3.1. Root distribution
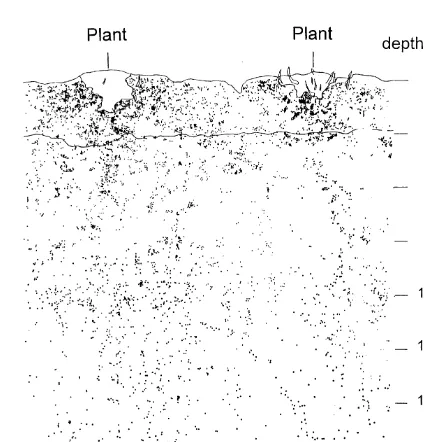
The root distribution determined using the trench profile method in 1992 is shown in Fig. 2. Roots were visible down to a depth of 250 cm. The top soil (0–30 cm) contained 28% of the counted roots. About a quarter of the roots were
Fig. 1. Sampling scheme for the core method (p1=centre of the
found in the 30–90 cm soil layer. Nearly half of
plant, p3=mid-way between two plants and p2=midway
the total counted roots were present in the deeper
between p1 and p3) and corresponding representative areas (a1–
Fig. 3. Root length density (RLD) obtained with the auger method for the 0–180 cm soil profile in June 1992 (P1, P2 and P3 indicate the different sampling positions; see Fig. 1).
Fig. 2. Spatial distribution of the roots obtained with the trench
profile method in May 1992. positions p2 and p3. There were no differences in
RLD between the three sampling positions at a depth greater than 30 cm. In the deepest soil layer decreased continuously with increasing depth,
although a larger number of roots were observed measured (165–180 cm), RLD was higher than 0.1 cm cm−3.
in the 100–130 cm soil layer.
There were no significant differences in RLD between the three sampling dates in 1994/1995.
3.2. Root length density
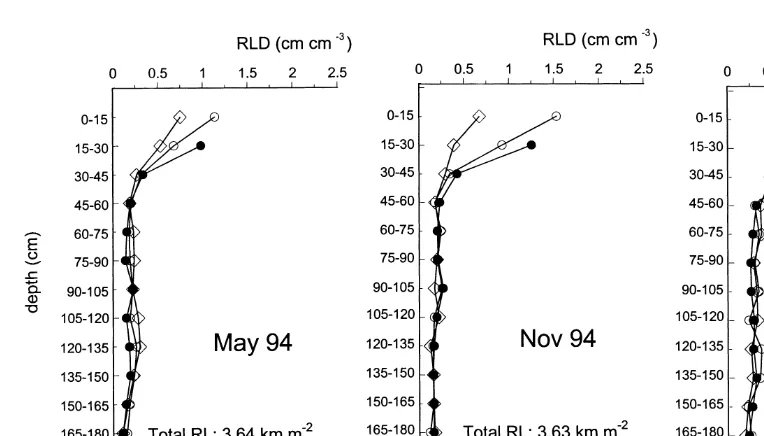
Nevertheless, the total RL for the soil profile — calculated using RLD data and the representative Using the auger method in June 1992, RLD
was found to be highest for the two top soil layers areas (a1–a3) for each sampling position (Fig. 1) — increased from 3.6 km m−2 in May (0–15 cm and 15–30 cm; Fig. 3). With increasing
distance from the centre of the plant, RLD 1994 to 4.9 km m−2in March 1995 ( Fig. 4). decreased for these soil layers. Below 30 cm, the
density of roots decreased clearly for all three 3.3. Root dry weight
sampling positions, and horizontal differentiation
was less pronounced (tendency for higher RLD As with RLD values, RDW tended to decrease with sampling depth for all three sampling dates values at p3 in comparison to p2 and p1). At a
soil depth of 135–165 cm, markedly higher values in 1994/1995, with the exception of the 75–105 cm soil layer, in which RDW was higher than in the for RLD were found for each of the three positions
in comparison to soil layers at a depth of 45– layers above or below ( Table 2). The total RDW in the soil profile down to 180 cm increased from 135 cm.
Consistent with the 1992 data, largest root 10.6 in May to 13.9 t ha−1in November and then decreased to 11.5 t ha−1 in March 1995, reaching densities were found in the upper 30 cm of the soil
profile for each sampling date in the 1994/1995 nearly the same level as in spring the previous year. The increase in RDW from May 1994 to growing season ( Fig. 4). RLD values declined
markedly with increasing soil depth. In the top November 1994 was mainly due to increases in the 0–15, 15–30 and 30–45 cm soil layers because soil (0–30 cm) RLD values tended to be higher at
Fig. 4. Root length density (RLD) obtained with the auger method for the 0–180 cm soil profile for three sampling dates in the 1994/1995 growing period (P1, P2 and P3 indicate the different sampling positions; see Fig. 1).
However, the decrease in RDW over winter was also due to a loss of dry weight in deeper soil layers up to 120 cm.
Table 2
Root dry weight (RDW ) in different soil layers during the
1994/1995 growing perioda 3.4. Content of mineral nutrients in the roots
Depth Samplings RDW LSDb
The nutrient concentrations in the roots were
(cm)
similar for the three sampling dates in 1994/1995,
May 1994 November 1994 March 1995
and the concentrations of N (0.7–1.4%) and K
RDW (kg ha−1) (0.6–1.2%) were clearly higher than those of P
(0.06–0.17%). The N, P and K concentrations in
0–15 2475 4550 4008 nsc
the roots tended to decrease with increasing soil
15–30 1947 2967 1787 ns
30–45 995 1244 1024 ns depth (data not shown).
45–60 636 ab 737b 482 a 239
60–75 558 667 454 ns
75–90 620 b 724 b 370 a 182 Table 3
Nutrient contents (N, P and K ) in total root dry matter of
90–105 1173 1010 741 ns
105–120 573 631 590 ns Miscanthus
120–135 520 386 681 243
Samplings Mean
135–150 421 360 585 ns
150–165 343 342 445 ns
May November March
165–180 317 281 304 ns
Total 10 579 13 898 11 471
Nutrient content (kg ha−1)
The contents of N, P and K, defined as the systems (e.g. Bo¨hm, 1979). Both methods used in our experiments have their advantages and disad-product of dry matter and mean nutrient
concen-tration, were also fairly similar throughout the vantages: qualitative analysis of root distribution is easier with the trench profile, but the auger vegetation period of the Miscanthus crop
( Table 3). The mean values for the N, P, and K method can give a more accurate quantitative analysis and is more suited to periodic sampling contents of the roots of all three sampling dates
were 109.2 kg N ha−1, 10.6 kg P ha−1and 92.5 kg (Perry et al., 1983).
RLD values obtained in the soil depth up to K ha−1.
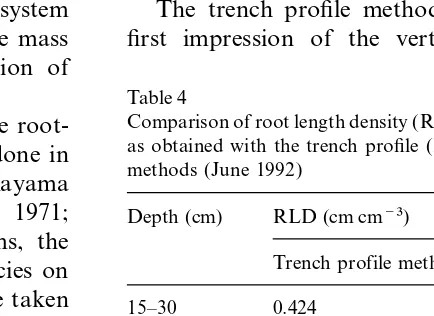
135 cm with the trench profile method in 1992 were 1.3–2.6 times lower than the values deter-mined by the auger method ( Table 4). RLD below
4. Discussion
135 cm was much lower for the trench profile method. This is in agreement with Ku¨cke et al. The distribution and growth of roots from
annual crops and trees have been intensively inves- (1995), who found that RLD data for cereals and sugar beets obtained with the trench profile method tigated (e.g. Kutschera, 1960; Bo¨hm, 1978),
whereas the root patterns of perennial plants like were four- to tenfold lower than the values calcu-lated with the auger method. The better
correspon-Miscanthusare not well known. There is no
gen-erally acceptable method for estimating root sys- dence of RLD data obtained with the auger and trench profile methods in our investigation may tems of herbaceous perennials. The main
difficulties are separation of the current year’s be due, at least in part, to the fact thatMiscanthus
is a perennial crop with less pronounced spatial roots from roots that were established in the
preceding years as well as the differentiation variability, andMiscanthusroots are more visible because the root diameter is greater.
between live and dead roots. Furthermore, translo-cation of nutrients and carbohydrates from the
below-ground plant parts of herbaceous perennials 4.2. Rooting pattern of Miscanthus
in spring to form new shoots andvice versa
reloca-tion from the shoots to the root/rhizome system The trench profile method was used to get a first impression of the vertical and horizontal at the end of the growth period may cause mass
changes without any shedding or formation of
new tissues. Table 4
Comparison of root length density (RLD) in different soil layers
Up to now, investigations concerning the
root-as obtained with the trench profile (May 1992) and the auger
ing system ofMiscanthushave only been done in
methods (June 1992)
natural plant communities in East Asia ( Kayama
et al., 1969, 1972; Yamane and Sato, 1971; Depth (cm) RLD (cm cm−3)
Midorikawa et al., 1975). In such systems, the
Trench profile methoda Auger methodb interaction of the roots of other plant species on
the rooting pattern ofMiscanthushas to be taken 15–30 0.424 1.104
into consideration. 30–45 0.247 0.339
45–60 0.199 0.242
The present study was conducted on a
well-60–75 0.159 0.213
established Miscanthus crop in the 4th and 6th
75–90 0.097 0.242
year after planting to give a general view of the
90–105 0.132 0.156
spatial and temporal root distribution and of the 105–120 0.136 0.246 nutrient content ofMiscanthusroots. 120–135 0.131 0.246
135–150 0.084 0.497
150–165 0.070 0.351
4.1. Methods comparison
165–180 0.084 0.188
Several methods have been proposed to examine aRLD calculated with measured root length per foil unit. bAverage of RLD at p1, p2 and p3.
distribution of theMiscanthusroot system. Roots example, at the 150 cm soil depth, the RLD for the
Miscanthus crop was 0.1–0.3 cm cm−3 (Fig. 4) in were present at the maximum depth of 250 cm
investigated in this study, which is comparable to contrast to the RLD values of 0.04–0.13 cm cm−3
of winter wheat reported by Kuhlmann et al. (1989) the rooting depth of perennial crops like alfalfa
but more than the rooting depths of other arable and 0.01–0.05 cm cm−3 of maize reported by Wiesler and Horst (1994). The presence of relatively crops like maize or sugar beet ( Kutschera, 1960).
In contrast, Yano and Kayama (1975) reported a high RLD values in the subsoil and the ability to explore the subsoil for nutrients can help to explain maximum rooting depth of 120 cm in a
semi-natural grassland community dominated by why an establised crop ofMiscanthusrequires rela-tively low external inputs of nutrients (Himken
Miscanthus in northeastern Japan. A possible
explanation for this disagreement are different soil et al., 1997). conditions (e.g. soil compaction layers, water
hold-ing capacity, nutrient availability), which are 4.3. Root dry weight
known to have a great effect on root growth (e.g.
Geisler and Maarufi, 1975). Comparing the start and end of the growing period, there were only small variations in RDW. Overall, the results of our study confirm other
findings [summarized by Bo¨hm (1979) and Ko¨pke Almost similar trends were observed for rhizome dry matter in this field experiment (Himken (1981)] that root density is highest in the topsoil.
Nevertheless, in the sub-soil (30–90 cm) and in the et al., 1997).
The highest RDW values in the top- and subsoil deeper subsoil layers (>90 cm), Miscanthus has
many more roots than other arable crops. This layers in our study measured at the end of the growing period in November 1994 are in agreement can be explained by the fact thatMiscanthusas a
perennial crop builds up a root system at depth, with the results of Yano and Kayama (1975), who found a maximum RDW in natural Miscanthus
which can be used for more than one vegetation
period. In contrast, annual plants like winter wheat communities in late October. The results therefore indicate that root growth ofMiscanthuscontinues need about 2 months after the start of the growing
period to explore the soil profile down to 90 cm at least one more month after anthesis (Midorikawa et al., 1975). These results are in (Bo¨hm, 1978).
As expected, rooting density decreased with contrast to annual crops, in which the highest root distribution and root dry weight are attained at increasing distance from the centre of the plant
(Figs. 3 and 4). A higher rooting density within anthesis (Bo¨hm, 1974; Mengel and Barber, 1974). The RDW for theMiscanthuscrop under study the rows rather than between rows has also been
reported for annual crops such as maize and is equivalent to about half of the maximum above-ground dry matter production of an established soybeans (Mengel and Barber, 1974; Arya et al.,
1975; Tardieu, 1988a,b). Nevertheless, for crop and in the same order of magnitude as rhizome dry matter (Himken et al., 1997).
Miscanthus, these differences could only be found in the topsoil (0–30 cm). In deeper soil layers,
distribution of roots is independent of the position 4.4. Nutrient content
of sampling. This could be due to the overlapping
of root systems from neighbouring plants in deeper Nutrient concentrations in roots have been reported to vary with soil nutrient status ( Van soil layers.
In comparison to RLD in the topsoil reported Praag et al., 1988; Burke and Raynal, 1994). The decrease in nutrient concentration in the roots for annual crops (e.g. 2.6–5 cm cm−3 for maize;
Taylor and Klepper, 1973; Mengel and Barber, appears to be related to the decrease in nutrient content in the soil. Similar results were found by 1974; Smika and Klute, 1982; Fusseder, 1985), the
RLD values found for Miscanthus were relatively Raspe et al. (1989) for N, P and K concentrations in roots of a 100 year oldPicea abiesstand in the low (0.5–2.3 cm cm−3). However, the RLD of
Bo¨hm, W., 1978. Untersuchungen zur Wurzelentwicklung bei
inadequate washing of the roots, especially in the
Winterweizen. Z. Acker- Pflanzenbau 147, 264–269.
topsoil, where much higher soil N, P, and K
Bo¨hm, W., 1979. Methods of Studying Root Systems.
contents were found ( Table 1). Overall, a
signifi-Springer, Berlin.
cant amount of nutrients found in the total bio- Burke, M.K., Raynal, D.J., 1994. Fine root phenology, pro-mass is located in the roots. In comparison to N, duction and turnover in a northern hardwood forest
eco-system. Plant and Soil 162, 135–146.
P, and K contents in shoots (Himken et al., 1997),
Funk, R., 1993. Einfluß der Beregnung und N-Du¨ngung auf
nutrient contents in roots are in the same order of
die Ertragsbildung und Qualita¨tsmerkmale von
Topi-magnitude, whereas nutrient contents in rhizomes
nambur,Arundo donaxL. undMiscanthus sinensisAnderss.
are twofold higher. This gives a clear indication
als mo¨glicher Energie- und Zelluloserohstoff, Ph.D. thesis,
that storage of nutrients in below-ground plant University of Hohenheim.
parts is an important nutrient pool forMiscanthus. Fusseder, A., 1985. Verteilung des Wurzelsystems von Mais im Hinblick auf die Konkurrenz um Makrona¨hrstoffe. Z. Pflanzenernaehr. Bodenk. 148, 321–334.
Garay, A.F., Wilhelm, W.W., 1983. Root system characteristics 5. Conclusions of two soybean isolines undergoing water stress conditions.
Agron. J. 75, 973–977.
Our results show that RLD in the topsoil for Geisler, G., Maarufi, D., 1975. Untersuchungen zur Bedeutung des Wurzelsystems von Kulturpflanzen. I. Der Einfluß des Miscanthusis lower than for annual crops such as
Bodenwassergehaltes und der Stickstoffdu¨ngung auf
Pflan-winter wheat and sugar beets. However, much
zenwachstum, Wurzelmorphologie, Transpiration und
greater rooting depth enablesMiscanthuscrops to
Stickstoffaufnahme. Z. Acker- Pflanzenbau 141, 211–230.
potentially take up nutrients (and water) from the
Greef, J.M., Deuter, M., 1993. Syntaxonomy of
subsoil and thereby overcome periods of low nutri- Miscanthus×giganteus. Angew. Bot. 67, 87–90.
ent (and water) availability in the topsoil, especially Greef, J.M., 1996. Etablierung und Biomassebildung von Miscanthus×giganteus. Guvillier-Verlag, Go¨ttingen.
during periods of rapid above-ground biomass
Himken, M., Lammel, J., Neukirchen, D., Czypionka-Krause,
growth. Furthermore, such an extensive rooting
U., Olfs, H.-W., 1997. Cultivation ofMiscanthusunder West
system is likely to reduce losses of nutrients
(especi-European conditions: Seasonal changes in dry matter
pro-ally nitrate) due to leaching throughout the year.
duction, nutrient uptake and remobilization. Plant and Soil 189, 117–126.
Holz, F., 1974. Die automatische Bestimmung des Stickstoffs als Indolphenolgru¨n in Bo¨den und Pflanzen. Landwirtsch. Acknowledgements
Forsch. 26, 177–191.
Kayama, R., Yoshida, J., Sakaida, T., 1969. Studies on the
We thank Dr P. Seward for critical comments
relationship between Miscanthus sinensis community and
and reviews of the manuscript. This research pro- soil. Part 2 Relationship between productivity ofMiscanthus ject was partly funded by the Federal Ministry of sinensisgrassland and microtopography. Jpn. J. Ecol. 19, Research and Technology (BMFT ) and by the 169–176.
Kayama, R., Yano, N.Y., Sugimoto, Y., 1972. Studies on the
Federal Ministry of Food, Agriculture and
relationship between Miscanthus sinensis community and
Forestry (BMELF ).
soil. Part 3 Seasonal variation of production ofMiscanthus sinensis grasslands and the soil conditions. Jpn. J. Ecol. 22, 151–161.
References Koike, J., Shoˆji, S., Yoshida, S., 1975. Aboveground biomass and litter in theMiscanthus sinensiscommunity. JIBP Synth. 13, 141–147.
Arya, L.M., Blake, G.R., Farrell, D.A., 1975. A field study of
Ko¨pke, U., 1981. A comparison of methods for measuring root soil water depletion patterns in presence of growing soybean
growth of field crops. Z. Acker- Pflanzenbau 150, 39–49. roots: 3. Rooting characteristics and root extraction of soil
Ku¨cke, M., Schmid, H., Spiess, A., 1995. A comparison of four water. Soil Sci. Soc. Am. Proc. 39, 437–444.
methods for measuring roots of field crops in three contrast-Bo¨hm, W., 1974. Wurzelforschung und Landschaftso¨kologie.
ing soils. Plant and Soil 172, 63–71. Nat. Land. 49, 158–161.
Kuhlmann, H., Barraclough, P.B., Weir, A.H., 1989. Utilization Bo¨hm, W., Ko¨pke, U., 1977. Comparative root investigations
of mineral nitrogen in the subsoil by winter wheat. Z. Pflan-with two profile wall methods. Z. Acker- Pflanzenbau 144,
Kutschera, L., 1960. Wurzelatlas mitteleuropa¨ischer Ackerunk- 1993. Ertragsverlauf vonMiscanthus sinensis‘Giganteus’ auf zwei Ackerstandorten in O¨ sterreich. Bodenkultur 44, ra¨uter und Kulturpflanzen. DLG-Verlag, Frankfurt/Main.
Lewandowski, I., Kahnt, G., 1994. Einfluß von Bestandesdichte 253–263.
Schwarz, K.U., Greef, J.M., Schnug, E., 1995. Untersuchungen und Stickstoff- Du¨ngung auf die Entwicklung, Na¨hrstoff
-gehalte und Ertragsbildung von Miscanthus ‘Giganteus’. zur Etablierung und Biomassebildung von Miscanthus giganteusunter verschiedenen Umweltbedingungen. Land-Mitt. Ges. Pflanzenbauwiss. 7, 341–343.
Mediavilla, V., Lehmann, J., Meister, E., Stu¨nzi, H., 1997. Bio- bauforsch. Vo¨lkenrode, Sonderheft 155, 1–122.
Smika, D.E., Klute, A., 1982. Surface area measurement of corn mass production withMiscanthus and indigenous grasses.
Agrarforschung 7, 295–298. root systems (Colorado). Agron. J. 74, 1091–1093. Tardieu, F., 1988a. Analysis of the spatial variability of maize Mengel, D.B., Barber, S.A., 1974. Development and
distribu-tion of the corn root system under field condidistribu-tions. Agron. root density. 1. Effect of wheel compaction on the spatial arrangement of roots. Plant and Soil 107, 259–266. J. 66, 341–344.
Midorikawa, B., Shimada, Y., Iwaki, H., Ohga, N., 1975. Root Tardieu, F., 1988b. Analysis of the spatial variability of maize root density. 2. Distances between roots. Plant and Soil production in seminatural grassland community dominated
byMiscanthus sinensisin Kawatabi area. JIBP Synth. 13, 107, 267–272.
Taylor, H.M., Klepper, B., 1973. Rooting and water extraction 114–123.
Newman, E.I., 1966. A method of estimating the total length pattern for corn (Zea maysL.). Agron. J. 65, 965–968. Tennant, D., 1975. A test of a modified line intersect method of root in a sample. J. Appl. Ecol. 3, 139–145.
Nygaard Nielsen, P., 1988. Produktiviteten af elefantengras of estimating root length. J. Ecol. 63, 995–1001.
Van Praag, H.J., Sougnez-Remy, S., Weissen, F., Carletti, G., Miscanthus sinensis ‘Giganteus’ pa farskellige jordtyper.
Saertryk Tidsskrift Planteavl 91, 275–281. 1988. Root turnover in a beech and a spruce stand of the Belgian Ardennes. Plant and Soil 105, 87–103.
Perry, R.L., Lyda, S.D., Bowen, H.H., 1983. Root distribution
of fourVitiscultivars. Plant and Soil 71, 63–74. Wiesler, H., Horst, W.J., 1994. Root growth and nitrate utiliza-tion of maize cultivars under field condiutiliza-tions. Plant and Soil Raspe, S., Feger, K.H., Zo¨ttl, H.W., 1989. Erfassung der
Ele-mentvorra¨te in der Wurzelbiomasse eines 100 ja¨hrigen Fich- 163, 267–277.
Yamane, I., Sato, K., 1971. Seasonal change of chemical com-tenbestandes (Picea abiesKarst.) im Schwarzwald. Angew.
Bot. 63, 145–163. position inMiscanthus sinensis. Rep. Inst. Agr. Res. Tohoku Univ. 22, 1–36.
Reijmerink, A., 1973. Microstructure, soil strength and root
development of asparagus on loamy sands in the Nether- Yano, N., Kayama, R., 1975. Seasonal and yearly change of biomass and litter — Underground. JIBP Synth. 13, lands. Neth. J. Agric. Sci. 21, 24–43.