L
Journal of Experimental Marine Biology and Ecology 244 (2000) 219–238
www.elsevier.nl / locate / jembe
Dissolved organic nitrogen dynamics in coastal waters and
the effect of copepods
a ,* a b
Toru Hasegawa , Isao Koike , Hiroshi Mukai
a
Ocean Research Institute, University of Tokyo, 1-15-1, Minamidai, Nakano, Tokyo 164-8639, Japan b
Akkeshi Marine Biological Station, Hokkaido University Akkeshi, Hokkaido 088-1113, Japan Received 10 December 1998; received in revised form 20 September 1999; accepted 20 September 1999
Abstract
15 15
The dynamics of freshly released and N labeled dissolved organic nitrogen (DO N) in the
,94 mm planktonic assemblages of coastal waters and the effects of herbivorous copepods on
15 1
those dynamics were assessed by applying NH4 under laboratory conditions. At the same time,
1
the rate of NH4 uptake and regeneration in the ,94mm planktonic assemblages, and the rates of
1 15
ingestion and NH4 regeneration by copepods were evaluated by N accumulation in the
15 1
particulate organic nitrogen (PON) fraction and in the copepods, and NH4 isotope dilution during the incubation. Under conditions of high ambient Chlorophyll a, the presence of copepods
15
stimulated total community DO N release which was correlated with high ingestion rates of the
15
copepods. The copepods primarily grazed on N tagged phytoplankton and ‘sloppy feeding’
15
would be a mechanism responsible for the DO N release. On the other hand, the addition of
15
copepods gave a negative effect on DO N release in ,94 mm plankton assemblages at the occasions when ambient Chlorophyll a concentrations were low and nitrogen–Chlorophyll a ratios
15
were high. The micrograzer and other organic particles that less labeled by N tracer, would be
15
the important foods for the copepods under those conditions, while the possible DO N release by the micrograzer would be repressed by copepods grazing. When a stimulating effect of the
15
copepods addition on relative DO N accumulation was found, the copepods sometimes released
15 15
more N labeled DON than N assimilated into their body. Even under those conditions, the
15
rates of DO N release by copepods normalized to ambient zooplankton biomass are rather minor compared to those by planktonic assemblages of ,94 mm, suggesting the importance of
15
microzooplankton and phytoplankton on DO N release in this coastal waters. 2000 Elsevier Science B.V. All rights reserved.
15
Keywords: DON; Nitrogen dynamics; N tracer; Food web structure; Copepods
*Corresponding author. Tel.:181-3-5351-6457; fax:181-3-5351-6461.
E-mail address: [email protected] (T. Hasegawa)
220 T. Hasegawa et al. / J. Exp. Mar. Biol. Ecol. 244 (2000) 219 –238
1. Introduction
In the coastal marine environment, the supply of nitrogenous nutrients, rather than phosphorus, often limits primary production and consequently has effects on the trophic structure of upper water column (Ryther and Dunstan, 1971; McCarthy and Carpenter, 1983; Oviatt et. al, 1995). Evaluating the nitrogen dynamics in marine environment is, therefore, indispensable to gain a better understanding of coastal ecosystem.
In this system, dissolved organic nitrogen (DON) is often the largest pool of nitrogen (Sharp, 1983). DON concentrations in some coastal waters show significant seasonal variations, indicating dynamic transformations of at least a certain component of the DON pool (Banoub and Williams, 1973; Motoda et al., 1977). These observations suggest that DON is potentially an important nitrogen source for bacteria and sometimes for phytoplankton (Jackson and Williams, 1985; Tupas and Koike, 1991; Bronk and Glibert, 1993a). Many potential processes by which dissolved organic matter (DOM) is released into the marine ecosystem have been observed, including active release by phytoplankton (Fogg, 1983), ‘sloppy feeding’ by zooplankton (Lampert, 1978; Strom et al., 1997) and lysis by virus infected cells (Bratbak et al., 1992). Those observations, however, were based on dissolved organic carbon (DOC) or a specific pool of DON (e.g., free amino acids).
Evaluation of individual processes that release DON to natural marine environments is still limited primarily because of the complexity of DON dynamics and lack of suitable
15
methodologies. The N tracer methodology to assess the nitrogen dynamics within marine ecosystems has been used successfully for many years (Dugdale and Goering, 1967; Wheeler et al., 1989; Tupas and Koike, 1991), but reliable methods to determine
15
the N content of DON have only been recently developed (Axler and Reuter, 1986;
15
Bronk and Glibert, 1991; Slawyk and Raimbault, 1995). The application of DO N measurements have revealed DON release or uptake in natural planktonic communities (Axler and Reuter, 1986; Bronk and Glibert, 1991, 1993a,b; Slawyk and Raimbault, 1995).
One of the key organisms in subarctic marine food webs is the calanoid copepod which is a direct link between primary production and higher trophic levels. There have been several studies on DOM release by copepods (Fuhrman, 1987; Roy et al., 1989; Strom et al., 1997), but quantitative evaluation of total DON release (i.e., not for individual components of DON such as amino acids) has seldom been attempted in natural communities. Furthermore, copepods may suppress DON release or enhance DON uptake by other planktonic communities directly or indirectly through trophic interactions. It has been observed that copepods control the abundance of ciliates and
1
indirectly stimulate NH4 regeneration by flagellates within the community (Glibert et al., 1992; Miller et al., 1995).
15
In this study, the N tracer technique was applied to address seasonal dynamics of
15 1
freshly synthesized organic nitrogen from NH , including its flux to DON fraction, in4
T. Hasegawa et al. / J. Exp. Mar. Biol. Ecol. 244 (2000) 219 –238 221
2. Materials and methods
2.1. Plankton and water sampling
Copepods and seawater were sampled on 29 March, 24 April, 17 May 1996, 19 May, 8 August and 24 October 1997 at a station (water depth 13 meters: 438019N, 1448529E) in Akkeshi Bay, eastern Hokkaido, Japan. Copepods were collected with vertical tows (bottom to surface) of a 0.33-mm mesh net with a 0.45-m diameter opening. After the tow the contents of the cod end was diluted with surface water.
In the shore based laboratory, copepods were sorted under a dissecting microscope and transferred into 100-ml beaker filled with filtered seawater (Whatman GF / F). Surface seawater samples were collected in 20-l carboys and kept in the dark until experiments were conducted. Temperature and salinity were measured using a YSI salinometer (Model 33 S-C-T meter) on discrete water samples collected at 1-m intervals from the surface to a depth of 12 m.
2.2. Incubation experiments
The effects of copepods on the nitrogen cycle especially on the release of dissolved
15 15
organic nitrogen (DO N), which was freshly synthesized from N labeled dissolved inorganic nitrogen, were examined. In 1996 and May 1997, seawater was prescreened with a 94-mm mesh net and was aliquoted into 4 or 531-l polycarbonate bottles. Copepods were rinsed with the prescreened seawater (94mm) and were added to grazing bottles but not to one bottle which was assigned as the control. The species and biomass of the copepods used are described in Table 1 together with the incubation conditions.
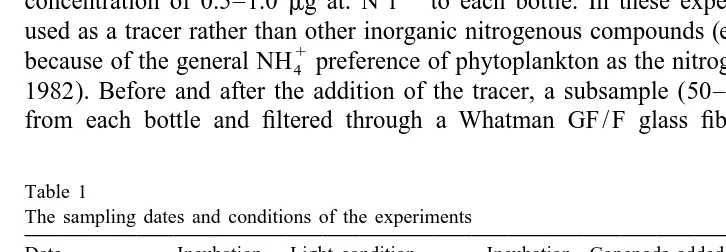
15 1 15
At the beginning of the experiments, NH4 (99.0 atom% N) was added to a
21 1
concentration of 0.5–1.0 mg at. N l to each bottle. In these experiments, NH4 was
2 2
used as a tracer rather than other inorganic nitrogenous compounds (e.g., NO3 or NO )2
1
because of the general NH4 preference of phytoplankton as the nitrogen source (Dortch, 1982). Before and after the addition of the tracer, a subsample (50–100 ml) was taken from each bottle and filtered through a Whatman GF / F glass fiber filter (25 mm).
Table 1
The sampling dates and conditions of the experiments
Date Incubation Light condition Incubation Copepods added 2
temperature (mE / s / m ) time (h)
Species Biomass C:N
(8C) 21
(mg l ) (atom: atom)
29 March 1996 2 64–730 (natural) 8 Acartia tumida 0.35–0.47 4.4
222 T. Hasegawa et al. / J. Exp. Mar. Biol. Ecol. 244 (2000) 219 –238
Particulate organic matter (POM) collected on the filter was used for Chlorophyll a analysis. Filtrates were kept frozen (2208C) for analyses of nutrients and DON.
At the beginning of the experiments, one grazing bottle was sacrificed as time zero of measured parameters. The contents were prescreened through a 193-mm mesh net to remove copepods, then the screened seawater was filtered through a Whatman GF / F filter (47 mm). The filtrate was frozen for later analyses of the nutrients, DON and
1
nitrogen isotopic ratios of NH4 and DON. In this study DON was defined as the fraction passing through the GF / F filter (0.6mm nominal porosity). It was found that the GF / F filtrate of our sample water contained about 30% of the total bacterial population (data not shown). The filter with POM was frozen until analyses for its carbon and nitrogen contents and nitrogen isotopic ratio. Copepods were rinsed with filtered seawater (GF / F) to remove attached particles and collected on a 12-mm Nuclepore filter (25 mm) and frozen until analyses for its carbon and nitrogen contents and nitrogen isotopic ratio.
In August 1997, seawater prescreened through a 94-mm mesh net was collected into a single 4-l polycarbonate bottle to which the copepods were added. Before and after
15 1
addition of the NH4 tracer, a subsample for nutrients, DON and Chlorophyll a was taken. From this single bottle, the content was divided into 730.5-l polycarbonate bottles and one bottle was sacrificed as time zero. During the partitioning, two control bottles were prepared by screening the incubation sample through a 193-mm mesh net to remove the copepods. The incubation bottles were suspended on a surface of bay, incubated and then processed in the same manner as the experiment in 1996. In October 1997, seawater prescreened with a 94-mm mesh net was preincubated for 6 h with
15 1
NH4 in 234-l polycarbonate bottles. After preincubation, copepods were added to one bottle as the grazing and the other unchanged as the control. Seawater from each bottle was divided into 431-l polycarbonate bottles and one bottle among the four bottles was sacrificed as time zero. After partitioning, the procedures used in the 1996 experiments were employed. In all the experiments except for in August, incubation temperature was maintained by circulating seawater and the bottles were gently shaken at 0.5–2 h intervals to keep the contents well mixed. At the end of experiments, the incubation bottles were processed in the same manner as the time zero bottles except that the control bottles were not prescreened. The GF / F filters to collect POM were precombusted at 4508C for 3 h and all bottles were acid washed and rinsed thoroughly with distilled water. Vacuum filtrations were done at ,50 mm Hg to minimize disruption of the cells.
2.3. Chemical and isotopic analysis
1 2 2 32
The concentrations of NH , NO , NO4 2 3 and PO4 were determined with a Technicon autoanalyzer (Strickland and Parsons, 1972). DON concentrations were measured by the
´
wet oxidation method of Solorzano and Sharp (1980). To prepare the sample for the 1
nitrogen isotopic measurements of NH , the conventional steam distillation methods of4
1 1
Bremner and Keeney (1965) were used. A 25-ml sample of NH4 with a 1.5mmol NH4
spike as carrier was distilled and recovered in 5 ml of 0.01 N H SO . The recovered2 4
1
NH4 was concentrated to ,1 ml in a rotary evaporater and the concentrate was
15
T. Hasegawa et al. / J. Exp. Mar. Biol. Ecol. 244 (2000) 219 –238 223
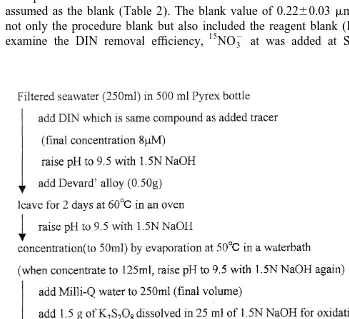
Samples for the determination of the nitrogen isotopic ratio of DON were prepared by the method described by Slawyk and Raimbault (1995) with some modification. Details of the method are described in Fig. 1. Some drops of 1.5 N NaOH solution were added, substituting for MgO, to raise the pH to 9.5. Further, vacuum evaporation (508C) was
1
applied to remove NH4 instead of the original diffusion procedure (Slawyk and Raimbault, 1995) to save the preparation time. A 500-ml pyrex bottle was capped with a silicone plug penetrated with a glass tube, this tube was connected to an aspirator and the content of bottle was concentrated to about 50 ml. To prevent the content from bumping at the beginning of the aspiration, the reduced pressure was regulated by using stopcock.
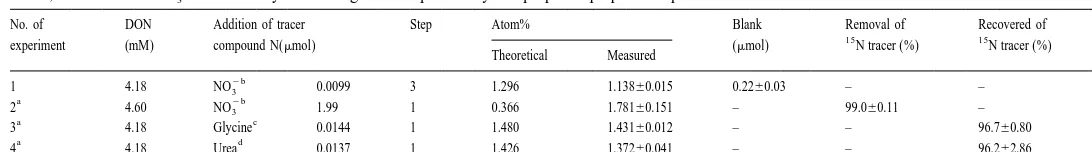
We examined the blank, DIN removal efficiency and DON recovery in our method,
15 2
and the results are presented in Table 2. To determine the blank value, NO3 was added at step 3. The difference between the theoretical and the measured isotopic ratio was assumed as the blank (Table 2). The blank value of 0.2260.03mmol (mean6SD) was not only the procedure blank but also included the reagent blank (Liu et al., 1996). To
15 2
examine the DIN removal efficiency, NO3 at was added at Step 1 and then the
15
224
T
.
Hasegawa
et
al
.
/
J.
Exp
.
Mar
.
Biol
.
Ecol
.
244
(2000
)
219
–
238
Table 2
15 2 15
Blank, removal of NO3 and recovery of N-organic compounds by the proposed preparation procedure
No. of DON Addition of tracer Step Atom% Blank Removal of Recovered of N
15 15
experiment (mM) compound N(mmol) (mmol) N tracer (%) N tracer (%) Theoretical Measured
2b
1 4.18 NO3 0.0099 3 1.296 1.13860.015 0.2260.03 – – 3
a 2b
2 4.60 NO3 1.99 1 0.366 1.78160.151 – 99.060.11 – 3
a c
3 4.18 Glycine 0.0144 1 1.480 1.43160.012 – – 96.760.80 3
a d
4 4.18 Urea 0.0137 1 1.426 1.37260.041 – – 96.262.86 3
a
The theoretical atom% were corrected for the blank obtained in experiment 1 (see text). b
99.1 atom%. c
99% atom%. d
T. Hasegawa et al. / J. Exp. Mar. Biol. Ecol. 244 (2000) 219 –238 225
removal efficiency was calculated from the difference between the theoretical (100% removal) and the measured isotopic ratio (Table 2). The same procedure was done using
15 15 15 2
N-glycine and N-urea instead of NO3 to check DON recovery (Table 2). Recovery
15 2
of the NO3 added in Step 1 was under 1% indicating that DIN was almost completely
15
eliminated in the first step (Table 2). Recovery of these N-organic compounds was
15
over 90% (Table 2). Calculation of the N abundance in the DON followed the
procedures of Slawyk and Raimbault (1995).
The nitrogen isotopic ratio of DON, particulate organic nitrogen (PON), copepods and 1
NH , organic carbon and nitrogen contents of POM and copepods were analyzed using4
a continuous flow mass spectrometer (Tracermass, Europa Scientific) equipped with a CN analyzer (Roboprep-CN, Europa Scientific) (Kanda et al., 1998). The POM on the GF / F filter was acidified with HCl vapor to remove carbonate. The copepods were lyophilized and their dry weights were determined on a Cahn microbalance (model 29)
15
prior to analysis. Sodium L-glutamate monohydrate (0.366 atom% N) and glycine
15
(1.66–4.51 atom% N) were used as the standard samples. Standard deviation for atom% of L-glutamate monohydrate (1 mmol N) is smaller than 0.0012 (N56).
Chlorophyll a was determined by the fluorometric method of Strickland and Parsons (1972) as modified by Suzuki and Ishimaru (1990), using a Turner Designs fluorometer.
2.4. Calculations
1 15
The regeneration rate of NH4 was determined by the N-isotope dilution method 1
(Blackburn, 1979; Caperon et al., 1979). The uptake rate of NH4 was determined using 21
the method of Glibert et al. (1982). The weight-specific net clearance rate, F, (ml mg
21 15 14
h ) was estimated using the method of Daro (1978), but N was substituted for C:
15
PON, respectively (final N concentration of each component2initial N
concen-15
tration of that component); P and C are the0 0 N atom% of PON and copepods at the 21
beginning of incubation, respectively; N is PON (0 mmol N l ) at the beginning of incubation; W is dry weight of the copepods added (mg); t is the duration of incubation (h) and V is volume (ml) of incubation. In August 1997, within 0.5 h of the experiment,
15
the amount of N in PON was about 65% of that at the end of incubation. The
following equation was then applied:
226 T. Hasegawa et al. / J. Exp. Mar. Biol. Ecol. 244 (2000) 219 –238
I5Nave3F3W/bodyN (3)
21
where bodyN is body N of copepods (mmol N l ) and Nave is the average PON (mmol 21
N l ) in the incubation period of each bottle and it is calculated as:
Nave5(Nf2N ) / ln(N /N )0 f 0 (4)
3. Results
3.1. Environmental and biological conditions
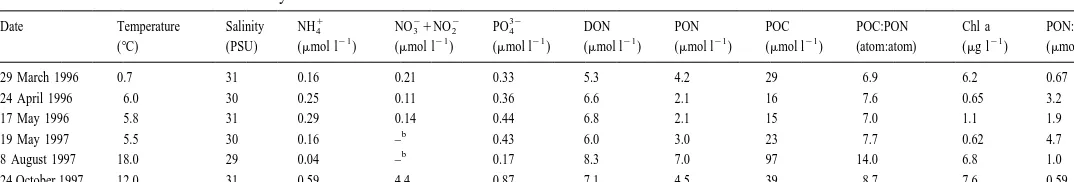
From March to October, surface water temperature at the station ranged from 0.7 to 188C while the salinity of the surface water remained at around 30 PSU (Table 3). The
1 21
NH4 concentration in the surface water was always less than 0.4mmol l , and it was the same for the nitrate1nitrite except for in October when the summer water
21
stratification was over. DON ranged from 5.3 to 8.3mmol l and represented the largest pool of dissolved nitrogen. In August, nutrients were lowest but DON showed the highest concentration. The N:P ratio of inorganic nutrients observed (0.24–6.4) was always lower than the Redfield ratio, suggesting nitrogen limited the conditions for the phytoplankton growth. Chlorophyll a was high in March 1996, October 1997 (usual blooming season) and August 1997 (Table 3). This seasonal tendency was also observed by Motoda et al. (1977) for Akkeshi Bay. Dominant phytoplankton were consisted of large diatoms such as Thalassiosira, Thalassionema, Skeletonema and Chaetoceros in the observed seasons. Changes in POM followed the concentrations of Chlorophyll a, being low in late spring and at the highest in August. The C:N ratio of POM varied from 6.9 in March 1996 to 14 in August 1997. The N:Chlorophyll a ratio showed an eight-fold change. A high N:Chlorophyll a ratio in April 1996 and May 1997 suggested dominance of particles other than phytoplankton (McCarthy and Nevins, 1986). Acartia used in these experiments were in the late copepodite stage to adult and was one of the dominant species of macrozooplankton in Akkeshi Bay except in April and May 1996 when nauplius of balanoid was the most dominant. The C:N ratio of copepods varied around 4 (Table 1). These ratios were quite low compared to the C:N ratio of surrounding POM.
15
3.2. N inventories and mass-balance
15
Table 4 summarizes the partitioning of N in the PON, DON and copepods together
15 1
with NH4 at the end of incubation. Except for the August 1997 experiment, which had
15 1
high Chlorophyll a concentrations and a longer incubation time, N in the NH4 fraction
15
at the end of incubation was still 70–90% of the initial N concentration (Table 4). In 1
August 1997 experiment, the rapid uptake of NH4 into the PON fraction was observed,
15
T
.
Hasegawa
et
al
.
/
J.
Exp
.
Mar
.
Biol
.
Ecol
.
244
(2000
)
219
–
238
227
Table 3
Environmental conditions inorganic nutrients, dissolved organic nitrogen, particulate organic nitrogen and carbon, chlorophyll a concentrations and their ratios in a
surface water of a station in Akkeshi Bay
1 2 2 32
Date Temperature Salinity NH4 NO31NO2 PO4 DON PON POC POC:PON Chl a PON:Chl a
21 21 21 21 21 21 21
(8C) (PSU) (mmol l ) (mmol l ) (mmol l ) (mmol l ) (mmol l ) (mmol l ) (atom:atom) (mg l ) (mmol /mg) 29 March 1996 0.7 31 0.16 0.21 0.33 5.3 4.2 29 6.9 6.2 0.67 24 April 1996 6.0 30 0.25 0.11 0.36 6.6 2.1 16 7.6 0.65 3.2 17 May 1996 5.8 31 0.29 0.14 0.44 6.8 2.1 15 7.0 1.1 1.9
b
19 May 1997 5.5 30 0.16 – 0.43 6.0 3.0 23 7.7 0.62 4.7
b
8 August 1997 18.0 29 0.04 – 0.17 8.3 7.0 97 14.0 6.8 1.0 24 October 1997 12.0 31 0.59 4.4 0.87 7.1 4.5 39 8.7 7.6 0.59
a
DON5Dissolved organic nitrogen, PON5particulate organic nitrogen, POC5particulate organic carbon, Chl a5chlorophyll a. b
228
T
.
Hasegawa
et
al
.
/
J.
Exp
.
Mar
.
Biol
.
Ecol
.
244
(2000
)
219
–
238
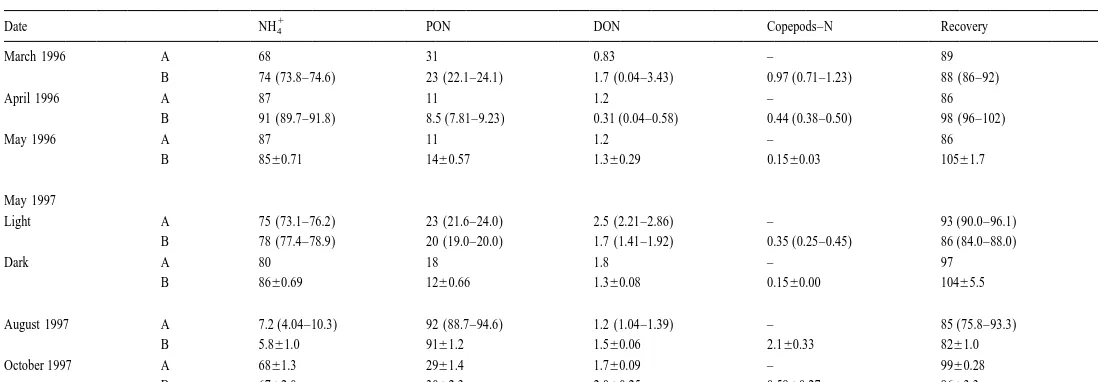
Table 4
15 15 15 15
The percentages of excess amount of N of each component to the total excess N (T N) after the incubation and recovery of added N in control and grazing a
bottles
1
Date NH4 PON DON Copepods–N Recovery N
March 1996 A 68 31 0.83 – 89 1
B 74 (73.8–74.6) 23 (22.1–24.1) 1.7 (0.04–3.43) 0.97 (0.71–1.23) 88 (86–92) 2
April 1996 A 87 11 1.2 – 86 1
B 91 (89.7–91.8) 8.5 (7.81–9.23) 0.31 (0.04–0.58) 0.44 (0.38–0.50) 98 (96–102) 2
May 1996 A 87 11 1.2 – 86 1
B 8560.71 1460.57 1.360.29 0.1560.03 10561.7 3 May 1997
Light A 75 (73.1–76.2) 23 (21.6–24.0) 2.5 (2.21–2.86) – 93 (90.0–96.1) 2 B 78 (77.4–78.9) 20 (19.0–20.0) 1.7 (1.41–1.92) 0.35 (0.25–0.45) 86 (84.0–88.0) 2
Dark A 80 18 1.8 – 97 1
B 8660.69 1260.66 1.360.08 0.1560.00 10465.5 3 August 1997 A 7.2 (4.04–10.3) 92 (88.7–94.6) 1.2 (1.04–1.39) – 85 (75.8–93.3) 2 B 5.861.0 9161.2 1.560.06 2.160.33 8261.0 4 October 1997 A 6861.3 2961.4 1.760.09 – 9960.28 3 B 6762.0 3062.3 2.060.25 0.5960.27 9663.3 3
a 1 1
T. Hasegawa et al. / J. Exp. Mar. Biol. Ecol. 244 (2000) 219 –238 229
the end of incubation (data not shown). In all the experiments, a measurable increase in
15
DO N as well as in the copepods fraction was observed, suggesting the transfer of
15 1 15
NH4 via phytoplankton into those components. Recovery of N in these experiments ranged from 82–105%.
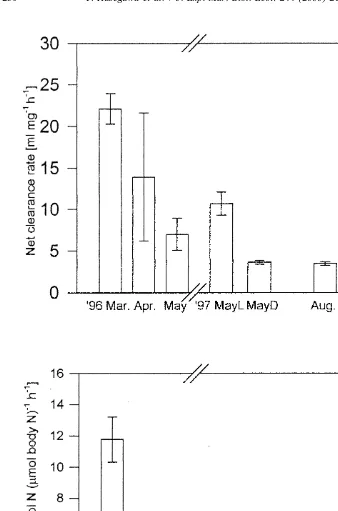
3.3. Clearance and ingestion rate of copepods
15
Weight-specific net clearance rates based on the rates of N incorporation into 21 21
copepods ranged from 3 (August 1997) to 23 ml mg h (October 1997) (Fig. 2a). Generally the rates were low when the POM concentrations in the surrounding water were low (April and May) and high when the POM concentrations were high (March and October), except for the experiment in August when the highest POM concentrations during the studying periods were recorded. On the other hand, the clearance rates had no distinct relationship with the water temperature at the bay. The ingestion rates in terms
21 21
of nitrogen ranged from 1.5 to 13 nmol N (mmol body N) h (Fig. 2b), which
corresponded to 4–32% of their body nitrogen per day. The ingestion rates showed a similar trend as the clearance rates, but the ingestion rate obtained in August deviated from this trend because of the high POM concentration of surrounding waters. In April and May, ingestion activity of copepods was low, when N:Chlorophyll a ratios of POM was apparently high compared to other the seasons (Table 3).
1 1
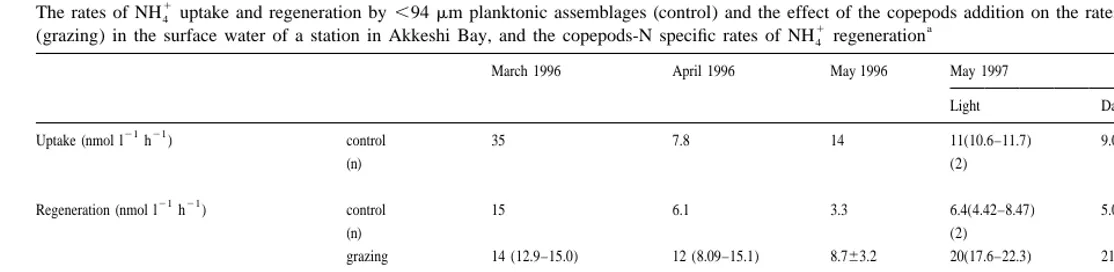
3.4. NH4 uptake and regeneration and copepods NH4 excretion
1 21 21
The NH4 uptake rates in the control bottles ranged from 7.8 to 45 nmol N l h , the high rates of which were obtained at the bloom condition (March and October)
1 21 21
(Table 5). The corresponding rates of NH4 regeneration (3.6–16 nmol N l h ) showed a similar trend, but were always lower than that of uptake rates, suggesting that
1
NH4 supply limits phytoplankton production. The difference between these two rates 1
decreased in April and May, indicating that the activities of NH4 producers such as 1 microzooplankton and bacteria become important compared to the uptake of NH4 by phytoplankton and bacteria.
With the addition of copepods to the incubation (grazing bottles), a significant 1
increase in NH4 regeneration rates was found except for in the March 1996 and October 1997 experiments (Table 5). For the experiment in October 1997, both in control and
15 1
grazing bottles, isotope dilution of NH4 during the incubation were not significant possibly due to short incubation time (3 h) and the rates were not calculated.
1
The calculated weight-specific NH4 excretion rate of copepods ranged from20.19 in 21 21
March 1996 to 5.7 nmol N (mmol body N) h in May 1997 (Table 5). It is not clear 1
why the effect of the copepods addition on NH4 regeneration was almost zero in March
15
1996, although a similar effect was reported by Glibert et al. (1992). Since the N 1 isotope dilution method was applied, the bias associated with the uptake of NH4 by plankton assemblages during the incubation can be corrected (Blackburn, 1979; Caperon
1
et al., 1979). In the August experiment, the NH4 uptake and regeneration rates could not 1
230 T. Hasegawa et al. / J. Exp. Mar. Biol. Ecol. 244 (2000) 219 –238
T
.
Hasegawa
et
al
.
/
J.
Exp
.
Mar
.
Biol
.
Ecol
.
244
(2000
)
219
–
238
231
Table 5
1 1
The rates of NH4 uptake and regeneration by,94mm planktonic assemblages (control) and the effect of the copepods addition on the rates of NH4 regeneration
1 a
(grazing) in the surface water of a station in Akkeshi Bay, and the copepods-N specific rates of NH4 regeneration
March 1996 April 1996 May 1996 May 1997 October 1997 Light Dark
21 21
Uptake (nmol l h ) control 35 7.8 14 11(10.6–11.7) 9.0 4564.4
(n) (2) (3)
21 21
Regeneration (nmol l h ) control 15 6.1 3.3 6.4(4.42–8.47) 5.0 1668.3
(n) (2) (3)
grazing 14 (12.9–15.0) 12 (8.09–15.1) 8.763.2 20(17.6–22.3) 2163.0 18614
(n) (2) (2) (3) (2) (3) (3)
21 21 21 b
Regeneration (nmol (mmol body N) h ) copepods-N 20.19 (20.48–0.11) 0.84 (0.48–1.20) 2.160.91 5.7 (5.54–5.83) 3.960.8 –
(n) (2) (2) (3) (2) (3)
a
Values are means and the ranges (N52) or6SE (N53,4). b
232
T
.
Hasegawa
et
al
.
/
J.
Exp
.
Mar
.
Biol
.
Ecol
.
244
(2000
)
219
–
238
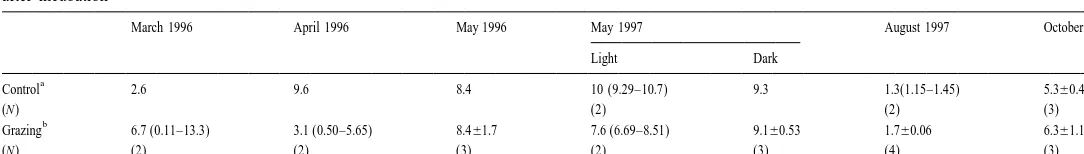
Table 6
15
The percentages of excess amounts of N in dissolved organic nitrogen (DON) to that of total organic nitrogen (TON) with (grazing) and without (control) copepods after incubation
March 1996 April 1996 May 1996 May 1997 August 1997 October 1997 Light Dark
a
Control 2.6 9.6 8.4 10 (9.29–10.7) 9.3 1.3(1.15–1.45) 5.360.48
(N) (2) (2) (3)
b
Grazing 6.7 (0.11–13.3) 3.1 (0.50–5.65) 8.461.7 7.6 (6.69–8.51) 9.160.53 1.760.06 6.361.1
(N) (2) (2) (3) (2) (3) (4) (3)
a
TON5Particulate organic nitrogen (PON)1DON. b
T. Hasegawa et al. / J. Exp. Mar. Biol. Ecol. 244 (2000) 219 –238 233 15
3.5. DO N dynamics in the control and grazing bottles
15
Since the addition of the copepods modified the N abundance of PON through
15 1 15
grazing and isotope dilution in the NH4 fraction (Table 4), a TO N normalized
15
change in the DO N was adopted to evaluate the effect of the copepods. Although the significance of the difference could not be statistically determined, the addition of
15
copepods stimulated relative N accumulation in the DON fraction in the experiments conducted in March 1996, August and October 1997 (Table 6). Ingestion rates of the copepods at the above experiments were significantly higher than compared to the other
21 21
experiments, 6–13 nmol N (mmol body N) h (Fig. 2b). In other months, the
15
addition of copepods either had no effect or repressed the relative DO N enrichment. Calculated ingestion rates in these months were also low (Fig. 2b).
4. Discussion
In this study, the nitrogen dynamics in coastal waters were addressed, especially those
15 1
of DON, by using NH4 as a tracer. There are several advantages in using this experimental approach, which includes simultaneous evaluation of copepods ingestion,
1
NH4 uptake and regeneration rates by planktonic assemblages within the same
15 15
enclosure. The production of DO N from PO N that was freshly synthesized from
15 1
NH4 was measured. Those DON are thought to constitute labile and / or semi-labile fractions of total DON in coastal waters, and may be an important nitrogen source for bacteria and sometime for phytoplankton (Tupas and Koike, 1991; Bronk and Glibert,
15
1993a; Tupas et al., 1994). In this discussion, the N methodology was first evaluated to assess the net clearance rates of copepods, since to our knowledge this is the first
15
reported application of N to that rate of copepods community. Then, together with the 1
estimated rates of clearance, ingestion and NH4 excretion rates by copepods, the effects of copepods on nitrogen dynamics, especially DON metabolisms in coastal planktonic assemblages, are discussed.
15
4.1. Evaluation of the net clearance rates of copepods with N
The net clearance rate of copepods was estimated by applying Daro’s model (1978)
15 14
but N was used instead of C. Daro employed short-term experiments to avoid
excretion of the tracer from phytoplankton and zooplankton (within 1–2 h). However,
15 1 3–24 h incubation was used in our experiments, it was found that most of the NH4
taken up by the POM fraction remained within this fraction for over 24 h, at least in the
15 1
August experiment which was assessed by the NH4 pulse labeled technique
(Hasegawa, unpublished data). Similar results were reported by Kanda et al. (1987) in the oligotrophic Pacific Ocean. The above results suggest that such a potential error
15
234 T. Hasegawa et al. / J. Exp. Mar. Biol. Ecol. 244 (2000) 219 –238
significant amounts of nitrogenous organic compounds is utilized as the respiratory substrates (Roman, 1983).
The assumption behind the calculation of the grazing rates in the proposed method is
15 1
that active NH4 assimilated phytoplankton is a primary diet for copepods as discussed by Daro (1978). Judging from low N:Chlorophyll a ratios and microscopic observations, large diatoms would be a major component of the POM in March, August and October in Akkeshi Bay (Table 3). In such situations, the above assumption would be applicable in calculating the copepods grazing rates. On the other hand, when copepods ingest
15
selectively on low N labeled diets such as microzooplankton, the calculated grazing rates would be low compared to actual rates. Low Chlorophyll a concentrations and high N:Chlorophyll a ratios in April and May suggested that PON other than phytoplankton become important foods for copepods (Table 3). The POM concentration and the calculated clearance rates in April and May were low, although a previous study showed that the increase in the clearance rate occurred under low food concentrations compensating the copepods demand in ingestion (Frost, 1972). Thus, low clearance rates
15
obtained by this method might be due to the effect of selective feeding on low N labeled POM. Despite the above possible biases of this methods, it is worthy to use this method to estimate net clearance rate, since this rate can be directly compared to the
1
other rates of copepods nitrogen metabolisms, such as NH4 excretion, in the same experiments.
1
4.2. NH4 dynamics and effects of copepods addition
1
The measured rates of NH4 regeneration by the ,94 mm planktonic assemblages 21 21
ranged from 3.3 to 15 nmol N l h (Table 5). Those rates are similar to the range of 1
reported rates of NH4 regeneration in coastal waters (Harrison et al., 1983; Tupas et al., 1
1994). The calculated rates of NH4 excretion by copepods ranged from 0.84 to 5.7 nmol 21 21
N (mmol body N) h (Table 5), except for in March 1996, and fell almost within the range of previous reports in Akkeshi Bay (Taguchi and Fukuchi, 1975; Motoda et al., 1977). Since the biomass of the macrozooplankton in spring in Akkeshi Bay was
21 1
reported to be ca. 20mg dry weight l (Motoda et al., 1977), the NH4 excretion rates by the ambient population of macrozooplankton was estimated to be 0.18–1.2 nmol N
21 21 1 1
l h . The NH4 excretion by macrozooplankton counts for 3–19% of the NH4
produced by ,94mm planktonic populations and a similar calculation indicated that the copepods contribution is also in the same range in other seasons. Miller and Glibert (1998) reported a remarkably similar contribution by macrozooplankton, that is the
1 1
excretion of NH4 by Acartia tonsa represents 0.9–10% of the total NH4 regeneration in their mesocosm experiments using the subestuary water of Chesapeake Bay. Although
1 15 1
the NH4 excretion rates by macrozooplankton obtained by the NH4 isotope dilution method using the natural waters may be underestimated to some extent (Glibert et al.,
1
1992; Miller et al., 1995), the contribution of macrozooplankton on the NH4 regenera-tion in the whole system would be rather minor in Akkeshi Bay. Previous studies on the nitrogen metabolism in the bay based on the measurements of primary production and
1
T. Hasegawa et al. / J. Exp. Mar. Biol. Ecol. 244 (2000) 219 –238 235
4.3. DON dynamics in the planktonic community
15
In the control bottles, amounts of DO N enrichment during the incubation, were
15 2
roughly correlated with those of PO N enrichment (r 50.44, N59) except for August
15
(Table 4). These data suggest that the N enrichment in DON would be primarily
15 15 15
controlled by the N enrichment in PON. The percentage of DO N to TO N at the end of incubation ranged from 1.3 to 11%, which is almost in same range of the reported dissolved organic carbon (DOC) release without copepods (Baines and Pace, 1991). Those obtained values may overestimate the actual DON release from plankton
15
assemblages, because N tracer recovered in the DON fraction in our experiments
15 1
contained bacteria which took up NH4 and passed through the GF / F filter. But this
15
bias was shown to be about 20–30% of total DO N by using a 0.2-mm filter to separate DON (Hasegawa, unpublished data).
The addition of copepods to the planktonic community of the ,94 mm size did not
15
always enhance the N accumulation in the DON fraction compared to control bottles but sometimes reduced the rates, although the significance of the difference could not be statistically determined. The observed results are in contrast to the effect of the copepods
1
addition to NH4 regeneration observed in the same incubation bottles, i.e., stimulation 1
of NH4 regeneration (Table 5). Although available data is limited, some trends of
15
consistency regarding the effect of the copepods addition on DO N dynamics in Akkeshi Bay can be seen. When both Chlorophyll a concentration in the water and the ingestion rates of copepods were high (March 1996, August 1997 and October 1997),
15
the enrichment of DO N during the incubation tended to be increase by the addition of copepods (Table 6, Fig. 2b). Under high Chlorophyll a conditions, the copepods would
15
primarily feed on the N tagged phytoplankton, which is consistent with the observed
15
high accumulation of N in copepods in those experiments (Table 4). The above food web structure would be favorable for the positive effect of the copepods’ activity on
15 15
DO N release to the ecosystems. Although the release mechanism of DO N by copepods could not be specified, if a higher assimilation efficiency for nitrogenous organic compounds in foods was assumed because of higher a C:N ratio of foods than that of copepods body, ‘sloppy feeding’ might be the most important process in those conditions (Lampert, 1978; Strom et al., 1997).
15
On the other hand, a negative effect of copepods on DO N accumulation tended to be associated with low ingestion rates by copepods (Fig. 2b). Trophic interaction and
15
coupled N dynamics within the food webs may explain the above observation. One of the key organisms that release DON in planktonic community is microzooplankton (Nagata and Kirchman, 1991; Strom et al., 1997) and one of the important micrograzer for phytoplankton in this bay is dinoflagellate (Tsuda, personal communication). If they
15
grazed on phytoplankton and release DO N significantly in the control bottle, the
15
236 T. Hasegawa et al. / J. Exp. Mar. Biol. Ecol. 244 (2000) 219 –238
changes in food web structure from bloom to post-bloom conditions would be an
15
explanation, i.e., observed difference in the effect of copepods on DO N dynamics. In this study, the effect of copepods was enhanced by adding about ten times higher concentrations of copepods compared to those of natural waters. Nevertheless, relative
15
accumulation of DO N in grazing bottles were not so significant or somewhat smaller than in controls. Although care is needed in extrapolating the present findings into the copepods metabolisms in the ambient Akkeshi Bay water, the following two points regarding the role of copepods metabolisms on the DON dynamics in Akkeshi Bay is expected. First, our findings suggests that copepods do not only release DON through their grazing activity, but also regulate DON dynamics through the trophic interactions.
15
Simultaneous estimation of N transfer to PON and copepods are consistent with the above view. Second, the role of copepods on DON production would be minor compared to ,94mm planktonic assemblages in Akkeshi Bay, that is typical eutrophic embayments at middle-latitude (Motoda et al., 1977). When a positive effect of the
15
copepods addition on relative DO N accumulation was found, sometimes the copepods
15 15
could release more N labeled DON than N assimilated into their body, if the
15 15
difference of relative DO N release between control and grazing bottles as the DO N
15
release by copepods was assumed. Even under those conditions, DO N release by
15
copepods normalized to ambient biomass are rather minor compared to DO N production by planktonic assemblages of ,94 mm and suggesting that ,94 mm plankton such as microzooplankton, bacteria and phytoplankton might be important for
15
DO N release (Table 6). Many studies revealed DON release by microzooplankton and phytoplankton (Nagata and Kirchman, 1991; Biddanda and Benner, 1997). Bacteria are also known to release DOM such as amino acids through the decomposition of organic aggregate (Smith et al., 1992). In our experiments, however, living particles such as
15 15
phytoplankton and bacteria need to be labeled by N tracer before to release DO N by bacterial decomposition. Because of this time lag, bacteria would not be so important as
15
DO N producers in these short experiments.
Acknowledgements
We thank M. Moroi, S. Hamano and H. Nakamura of the Akkeshi Biological Station, Hokkaido University, to logistic support. We also thank L. Tupas and T. Miyajima for their valuable comments. This study was supported by the grant-in-aid (67558192) from the Ministry of Education, Culture and Science. [RW]
References
15
Axler, R.P., Reuter, J.E., 1986. A simple method for estimating the N content of dissolved organic matter 15
(DO N) in N-cycling studies. Can. J. Fish. Aquat. Sci. 43, 130–133.
T. Hasegawa et al. / J. Exp. Mar. Biol. Ecol. 244 (2000) 219 –238 237 Banoub, M.W., Williams, P.J.L., 1973. Seasonal changes in the organic forms of carbon, nitrogen and
phosphorous in the English Channel in 1968. J. Mar. Biol. Assoc. UK 53, 695–703.
Biddanda, B., Benner, R., 1997. Carbon, nitrogen, and carbohydrate fluxes during the production of particulate and dissolved organic matter by marine phytoplankton. Limnol. Oceanogr. 42, 506–518.
1
Blackburn, T.H., 1979. Method for measuring rates of NH4 turnover in anoxic marine sediments, using a
15 1
N-NH4 dilution technique. Appl. Environ. Microbiol. 37, 760–765.
Bratbak, G., Heldal, M., Thingstad, T.F., Riemann, B., Haslund, O.H., 1992. Incorporation of viruses into the budget of microbial C-transfer. A first approach. Mar. Ecol. Prog. Ser. 83, 273–280.
Bremner, J.M., Keeney, D.R., 1965. Steam distillation methods for determination of ammonium, nitrate and nitrite. Anal. Chim. Acta 32, 485–495.
15
Bronk, D.A., Glibert, P.M., 1991. A N tracer method for the measurement of dissolved organic nitrogen release by phytoplankton. Mar. Ecol. Prog. Ser. 77, 171–182.
15
Bronk, D.A., Glibert, P.M., 1993a. Application of a N tracer method to the study of dissolved organic nitrogen uptake during spring and summer in Chesapeake Bay. Mar. Biol. 115, 501–508.
Bronk, D.A., Glibert, P.M., 1993b. Contrasting patterns of dissolved organic nitrogen release by two size
1 2
fractions of estuarine plankton during a period of rapid NH4 consumption and NO2 production. Mar. Ecol. Prog. Ser. 96, 291–299.
Caperon, J., Schell, D., Hirota, J., Laws, E., 1979. Ammonium excretion rates in Kaneohe Bay, Hawaii, 15
measured by a N isotop dilution technique. Mar. Biol. 54, 33–40. 14
Daro, M.H., 1978. A simplified C method for grazing measurements on natural planktonic populations. Helgol. Wiss. Meeresunters 31, 241–248.
Dortch, Q., 1982. Effect of growth conditions on accumulation of internal nitrate, ammonium, amino acids, and protein in three marine diatoms. J. Exp. Mar. Biol. Ecol. 61, 243–264.
Dugdale, R.C., Goering, J.J., 1967. Uptake of new and regenerated forms of nitrogen in primary productivity. Limnol. Oceanogr. 12, 196–206.
Fogg, G.E., 1983. The ecological significance of extracellular products of phytoplankton photosynthesis. Bot. Mar. 26, 3–14.
Frost, B.W., 1972. Effects of size and concentration of food particles on the feeding behavior of the marine planktonic copepod Calanus pacificus. Limnol. Oceanogr. 17, 805–815.
Fuhrman, J., 1987. Close coupling between release and uptake of dissolved free amino acids in seawater studied by an isotope dilution approach. Mar. Ecol. Prog. Ser. 37, 45–52.
Glibert, P.M., Lipschultz, F., McCarthy, J.J., Altabet, M.A., 1982. Isotope dilution models of uptake and remineralization of ammonium by marine plankton. Limnol. Oceanogr. 27, 639–650.
1
Glibert, P.M., Miller, C.A., Garside, C., Roman, M.R., McManus, G.B., 1992. NH4 regeneration and grazing: 15 1
interdependent processes in size-fractionated NH4 experiments. Mar. Ecol. Prog. Ser. 82, 65–74. Harrison, W.G., Douglas, D., Falkowski, P., Rowe, G., Vidal, J., 1983. Summer nutrient dynamics of Middle
Atlantic Bight: nitrogen uptake and regeneration. J. Plankton Res. 5, 539–565.
Jackson, G.A., Williams, P.M., 1985. Importance of dissolved organic nitrogen and phosphorus to biological nutrient cycling. Deep-Sea Res. 32, 223–235.
Kanda, J., Laws, E.A., Saino, T., Hattori, A., 1987. An evaluation of isotope dilution effect from conventional 15
data sets of N uptake experiments. J. Plankton Res. 9, 79–90.
Kanda, J., Sada, K., Koike, I., Yokouchi, K., 1998. Application of an automated carbon–nitrogen analyzer for elemental and isotopic analysis of samples retained on glass-fiber filters. Inter. J. Environ. Anal. Chem. 72, 163–171.
Lampert, W., 1978. Release of dissolved organic carbon by grazing zooplankton. Limnol. Oceanogr. 23, 831–834.
Liu, K.-K., Su, M.-J., Hsuen, C.-R., Gong, G.-C., 1996. The nitrogen isotopic composition of nitrate in the Kuroshio water northeast of Taiwan: evidence for nitrogen fixation as a source of isotopically light nirate. Mar. Chem. 54, 273–292.
McCarthy, J.J., Carpenter, E.J., 1983. Nitrogen cycling in near-surface waters of the open ocean. In: Carpenter, E.J., Capone, D.G. (Eds.), Nitrogen in the marine environment, Academic Press, New York, pp. 487–512. McCarthy, J.J., Nevins, J.L., 1986. Sources of nitrogen for primary production in warm-core rings 79-E and
238 T. Hasegawa et al. / J. Exp. Mar. Biol. Ecol. 244 (2000) 219 –238
Miller, C.A., Penry, D.L., Glibert, P.M., 1995. The impact of trophic interactions on rates of nitrogen regeneration and grazing in Chesapeake Bay. Limnol. Oceanogr. 40, 1005–1011.
Miller, C.A., Glibert, P.M., 1998. Nitrogen excretion by the calanoid copepod Acartia tonsa: results of mesocosm experiments. J. Plankton Res. 20, 1998.
Motoda, S., Kawamura, T., Nishizawa, S., 1977. Akkeshi Bay. In: Hogesu, K., Hanaoka, M., Hanaoka, T., Kawamura, T. (Eds.), Productivity of biocenoses in coastal regions of Japan, University of Tokyo Press, Tokyo, pp. 223–265.
Nagata, T., Kirchman, D.C., 1991. Release of dissolved free and combined amino acids by bactivorous marine flagellates. Limnol. Oceanogr. 36, 433–443.
Oviatt, C., Doering, P., Nowicki, B., Reed, L., Cole, J., Frithsen, J., 1995. An ecosystem level experiment on nutrient limitation in temperate castal marine environments. Mar. Ecol. Prog. Ser. 116, 171–179. Poulet, S.A., 1974. Seasonal grazing of Pseudocalanus minutus on particles. Mar. Biol. 25, 109–123. Roman, M.R., 1983. Nitrogenous nutrition of marine invertebrate. In: Carpenter, E.J., Capone, D.G. (Eds.),
Nitrogen in the marine environment, Academic Press, New York, pp. 347–383.
Roy, S., Harris, R.P., Poulet, S.A., 1989. Inefficient feeding by Calanus helgoandicus and Temora longicornis on Coscinodiscus wailesii: quantitative estimation using chlorophyll-type pigments and effects on dissolved free amino acids. Mar. Ecol. Prog. Ser. 52, 145–153.
Ryther, J.H., Dunstan, W.M., 1971. Nitrogen, phosphorus and eutrophication in the marine environments. Science 171, 1008–1013.
Sharp, J.H., 1983. The distributions of inorganic nitrogen and dissolved and particulate organic nitrogen in the sea. In: Carpenter, E.J., Capone, D.G. (Eds.), Nitrogen in the marine environment, Academic Press, New York, pp. 1–35.
Slawyk, G., Raimbault, P., 1995. Simple procedure for simultaneous recovery of dissolved inorganic and 15
organic nitrogen in N-tracer experiments and improving the isotopic mass balance. Mar. Ecol. Prog. Ser. 124, 289–299.
Smith, D.C., Simon, M., Alldredge, A.L., Azam, F., 1992. Intense hydrolytic enzyme activity on marine aggregates and implications for rapid particle dissolution. Nature 359, 139–141.
´
Solorzano, L., Sharp, J.H., 1980. Determination of total dissolved nitrogen in natural waters. Limnol. Oceanogr. 25, 751–754.
Strickland, J.D.H., Parsons, T.R., 1972. In: 2nd ed., A practical handbook of seawater analysis, Vol. 167, Fish. Res. Board. Can. Bul, p. 310.
Strom, S.L., Benner, R., Dagg, M.J., 1997. Planktonic grazing are a potentially important source of marine dissolved organic carbon. Limnol. Oceanogr. 42, 1364–1374.
Suzuki, R., Ishimaru, T., 1990. An improved method for the determination of phytoplankton chlorophyll using
N,N-dimethylformamide. J. Oceanogr. Soc. Japan 46, 143–194.
Taguchi, S., Fukuchi, M., 1975. Filtration rate of zooplankton community during spring bloom in Akkeshi Bay. J. Exp. Mar. Biol. Ecol. 19, 145–164.
Tupas, L., Koike, I., 1991. Simultaneous uptake and regeneration of ammonium by mixed assemblages of heterotrophic marine bacteria. Mar. Ecol. Prog. Ser. 70, 273–282.
Tupas, L., Koike, I., Karl, D.M., Holm-Hansen, O., 1994. Nitrogen metabolism by heterotrophic bacterial assemblages in Antarctic coastal waters. Polar Biol. 14, 195–204.