International Review of Economics and Finance 8 (1999) 433–453
Re-examining forward market efficiency
Evidence from fractional and Harris-Inder
cointegration tests
Taufiq Choudhry*
Southampton Management School, University of Southampton, Southampton SO17 1BJ, UK
Received 3 February 1998; accepted 19 August 1998
Abstract
This article investigates the forward market efficiency by testing the unbiased forward exchange rate hypothesis using nine currencies vis-a`-vis the U.S. dollar. The empirical tests are conducted using monthly data during the period between January 1985 and December 1996 and two different methods of cointegration tests, a fractional (GPH) test and the Harris-Inder test. The two cointegration tests are based on two different null hypotheses. Results provide ample evidence of cointegration between the spot and the forward rate, but little evidence of the unbiased rate hypothesis, which may be due to the nonstationary risk premium.
1999 Elsevier Science Inc. All rights reserved.
JEL classification:F30, F31
Keywords:Cointegration; ARFIMA; Mean-reversion; Forward premium
1. Introduction
Many studies investigate the foreign exchange market efficiency by looking at the relationship between the forward rate and the spot rate, especially the unbiased forward rate hypothesis. The unbiased forward rate hypothesis states that the forward exchange rate is an unbiased predictor of the corresponding future spot exchange rate.1 The unbiasedness of the forward rate is important for the construction of
macroeconomics models and for testing monetarist theories concerning the asset market approach to the determination of the foreign exchange rate (Bailey et al.,
* Corresponding author. Tel.:144-1703-593-966; fax:144-1703-593-844.
E-mail address: [email protected] (T. Choudhry)
1984). Current works usually study the unbiased forward rate hypothesis applying data in levels and the latest estimation methods such as cointegration that take nonsta-tionarity of the data into consideration (Phillips et al., 1996). This article provides a study of the unbiased rate hypothesis using nine currencies vis-a`-vis the U.S. dollar. This hypothesis is often investigated using the following regression:
st1k5 a01 a1ft1 et1k (1)
wherest1kis the log of the future spot rate k periods ahead, andftis the log of the
k-period forward rate. Acceptance of the null hypothesisH0: (a0,a1)5(0, 1) provides
evidence that the forward exchange rate is an unbiased predictor of the future spot rate.2This null hypothesis is based on the assumption that economic agents are risk
neutral and have rational expectations (Baillie & McMahon, 1989). The forward market is weak-form efficient and economic agents are risk neutral if the null is accepted and the residualet1kis a white noise.3Deviation from the stated hypothesis
is often attributed to a time-varying risk premium (Fama, 1984; Hakkio & Sibert, 1995).4However, as stated by Sibert (1989), market efficiency may be consistent with
risk averse investors requiring a premium on forward contracts. Sibert shows using a choice-theoretic, general equilibrium model of the risk premium that stochastic money supplies and endowments are enough to generate time-varying risk premium. In this framework, forward contracts are used as a method of sharing risk. Premia are related to the efficacy of such contracts as hedges against risk. Other explanations, such as expectation errors, institutional consideration, etc., have also been offered for the lack of solid empirical support for the unbiased hypothesis.
Furthermore, according to Frenkel (1977), semi-strong efficiency of the forward market may be examined by investigating whether the forward exchange rate summa-rizes all the relevant information. In an efficient market the forward rate (ft)
summa-rizes all the information concerning the expected value of st1k that is available at t.
One of the items of information available attis the stock of information available at t21. If the forward market is semi-strong efficient then the forward rate lagged one period (ft21) added as an explanatory variable in Eq. (1) should have insignificant
effect; in other wordsftshould summarize all the information including that contained
inft21.5The following regression may be used to test the semi-strong efficiency (Frenkel,
1977):
st1k5 a01 a1ft1 a2ft211 et1k (2)
Acceptance of the null hypothesisH0: (a0,a1,a2)5(0, 1, 0) provides further evidence
that the forward exchange rate is an unbiased predictor of the future spot rate implying a semi-strong efficient forward market.6Longworth (1981) provides a different form
of a semi-strong efficiency test in the forward exchange market; his test involves adding a lagged spot rate as an explanatory variable in Eq. (1). Thus, the Longworth (1981), semi-strong efficiency test may be presented
st1k5 a01 a1ft1 a3st1 et1k (3)
be equal to unity. In other words, acceptance of the null hypothesis (a0,a1,a3)5(0,
1, 0) provides evidence of the unbiased hypothesis and the semi-strong efficiency. Thus, a semi-strong efficient forward market implies that the coefficient on the lagged spot rate (a3) should have no significant effect on the future spot rate. Longworth
(1981) using Eq. (3) and the U.S.-Canadian exchange rates, was able to reject the forward market hypothesis. According to McFarland et al. (1994) results from previous research on whether the forward rate is an unbiased predictor of the future spot rate are inconclusive.7
As stated earlier, this article studies the unbiased rate hypothesis using Eqs. (1), (2), and (3) and nine currencies vis-a`-vis the U.S. dollar by means of a fractional cointegration (Geweke and Porter-Hudak or GPH) test and the Harris-Inder cointe-gration test. The forward market efficiency has also been investigated by applying the first difference of Eq. (1) (see Fama, 1984 and Barnhart & Szakmary, 1991). Using the spot and the forward rate in levels [as in Eqs. (1), (2) and (3)] rather than first difference has several advantages (Corbae et al., 1992). The first advantage is that a differenced model yields estimates that converge to the true parameter estimates at the rate T1/2 (where T is the sample size) rather than rate T for levels. Due to the
slower rate of convergence there is potential for spurious inference (Phillips & McFar-land, 1997). Second, while a stationary stochastic risk premium may exhibit stochastic correlation with difference regressors, the levels approach is not affected by such correlation since the order of nonstationary regressors dominates the order of the stationary risk premium. Furthermore, Phillips et al. (1996) found that the direct regression [Eqs. (1), (2), and (3)] has advantages when dealing with overlapping data.8
During the earlier period most of the studies analyzing Eqs. (1), (2), and (3) have applied the standard linear regression method.9As indicated by Granger and Newbold
(1986) the application of nonstationary variables in standard regression results in spurious estimation.10 In such a case, the application of the cointegration method is
more appropriate.11Cointegration mimics the existence of a long-run equilibrium to
which an economic system converges over time.12 To our knowledge no one has
studied the forward market efficiency using fractional cointegration or the Harris-Inder cointegration test.
2. The estimation procedures
2.1. Fractional integration and cointegration
The Autoregressive Fractionally-Integrated Moving Average (ARFIMA) model of Granger and Joyeux (1980) and Hosking (1981) is an extension of the Autoregressive Integrated Moving Average (ARIMA) models as set forth in Eq. (4):
F(L)(1 2L)dx
t5 Q(L)et (4)
whereLis the lag operator,etis a white noise, andd, the differencing operator, can
take on integer and non-integer values. If d 5 0 the series (xt) is a standard
nonstation-ary process (non-mean-reverting) if d 51. If 0,d ,1, the series is a fractionally-integrated process and is known as a long memory process.13In the case of a
fraction-ally-integrated process, an innovation has no permanent effect on the series, but its mean-reversion properties are persistent.
The study of a stationary long-run relationship between two or more nonstationary variables by means of the cointegration test has been widely applied in empirical economics and finance. Consider two time seriesx1tandx2tand letXtbe a 2x1 vector
of xit. In all standard cointegration test methods, such as those of Johansen (1988)
and Engle and Granger (1987),x1tandx2tare considered to be nonstationary in levels,
ord51, and the cointegrating linear combinationzt5 aXt(withaas the cointegrating
vector) of the orderI(d2b) with b51. For a possible cointegration betweenx1tand
x2t, it only requires the equilibrium errorztto be stationary, and therefore the integer
values of 0 and 1 fordzof the equilibrium error term (zt) are too restrictive. If 0 ,
dz,1, the equilibrium errorztwill be fractionally integrated but mean-reverting. In
this case the error term responds slowly to shocks so that deviations from equilibrium are more persistent. Allowance for fractional integration provides flexibility in model-ling of mean-reverting dynamics (Chou & Shih, 1997). Baillie and Bollerslev (1994a) indicate that the traditional assumption that the spot and the forward rates are cointe-grated of the formC(1, 1) may not be the proper presentation. A better representation may be the fractional cointegration of the formC(1, d) with 0 ,d , 1, so that all forward premia may have infinite variances but are nevertheless mean reverting.14
The fractional cointegration approach applied in this paper integrates the notions of the Engle and Granger (1987) cointegration and of fractional differencing of Granger and Joyeux (1980). In the first step the equilibrium error term from Eq. (1) ((2) and (3)) is obtained by means of ordinary least square (OLS) and then in the second step the stochastic structure of the error term is investigated. As shown by Yajima (1988) and Cheung and Lai (1993) the OLS estimate ofais consistent and converges at the rate of T12d if the elements of X
tare fractionally cointegrated, i.e., the error term zt
is fractionally integrated, 0,dz ,1.
The values ofdfor the error term are estimated using the GPH semi-nonparametric estimator based on the following OLS estimating equation (Eq. (5)):15
ln{I(wj)}5 b01 b1ln{4Sin2(wj/2)}1 ht (5)
withb15 2d, where I(wj) is the periodogram of xtat frequency wj, wj52pj/T(j5
1, . . . ,T21) andhare asymptotically i.i.d.16The number of low frequency ordinates
(n) used in this test is equal to n 5 Tm, where T is the number of observations.
variance of the estimate ofb1is given by the usual OLS estimator while the theoretical
asymptotic variance of et is shown to provide a more reliable confidence interval.
The GPH test is asymptotically normal, independently of the null hypothesis under consideration (Sephton, 1993). Thus, the GPH test can be applied to the residuals obtained from a cointegrating regression. As pointed out by Cheung and Lai (1993, p. 108) while testing for cointegration, the power advantage of the GPH test over the Augmented Dickey-Fuller test (ADF) test is particularly relevant for a sample size of 200 or less. They further indicate that the GPH test is more powerful than the ADF test in testing against ARFIMA alternatives. Critical values required for fractional cointegration tests are provided by Sephton (1993).17
2.2. Harris-Inder cointegration test
The traditional cointegration tests of Engle and Granger (1987), Johansen (1988) and also the fractional cointegration tests, such as the GPH test, are based on the null hypothesis of no cointegration. Harris and Inder (1994) using the Engle-Granger two-step method and the Kwiatkowski et al. (1992; KPSS) unit root test provide a test of cointegration where the null hypothesis is the presence of cointegration between the relevant variables.18 The merit of the null hypothesis cointegration test is more
visible in models where the variables are believed to be cointegrated, a priori (Harris & Inder, 1994). They advocate the use of tests of both null hypotheses, if no a priori beliefs on the presence or absence of cointegration are imposed.
The test advocated by Harris and Inder (1994) is basically an extension of the test proposed by Engle and Granger (1987) mixed with the KPSS unit root test. The Harris-Inder test is specified as
yt5xt9g01 dt1 et (6)
xt5xt211 ht (7)
dt5 dt211wt (8)
whereytis the dependent variable,xtis a vector of nonstationary independent variables
anddtis a random walk in the residuals of the cointegration Eq. (6). If Eqs. (6), (7)
and (8) are the true data-generating processes, then the presence of the random walk component in the residuals will enable ytand xtto be cointegrated. However, if the
variance of the random walk component (v2) is restricted to zero then the random
walk component reduces to a constant for allt.In that case, Eq. (6) will represent a cointegrating relationship between yt and xt with constant and stationary residuals.
As indicated by Harris and Inder (1994), testing the null hypothesis ofv250 against
the alternative null v2. 0 will test the null hypothesis of cointegration against the
alternative of no cointegration. Also, in the case of the Harris-Inder test, the first step is to estimate Eqs. (1), (2), or (3) by OLS to obtain the error term, and then the KPSS test is applied to check for unit root(s) in the residuals.19 In the case of the
that KPSS tests are also consistent against the stationary long-memory alternative. Harris and Inder (1994) provide the critical values required in this test.
3. The data and the results
Monthly forward and spot exchange rates from Australia, Canada, France, Ger-many, Hong Kong, Italy, Japan, South Africa, and the United Kingdom between January 1985 and December 1996 are used in the article.20For each country the
one-month forward exchange rate is applied. All exchange rates are expressed as currency per U.S. dollar except in the case of United Kingdom where it is dollars per pound sterling. All the data are obtained fromDatastreamand are applied in the log form.21
As required, before the actual cointegration tests logs of each variables were checked for unit root(s).22Results from the ADF test, the KPSS test and the GPH test indicate
all series to contain a unit root, i.e., d 51. These results are not provided in order to save space but are available on request. Unit roots in forward and spot exchange rates are not unique; several previous studies (such as the ones cited in endnote 10) also find similar results.
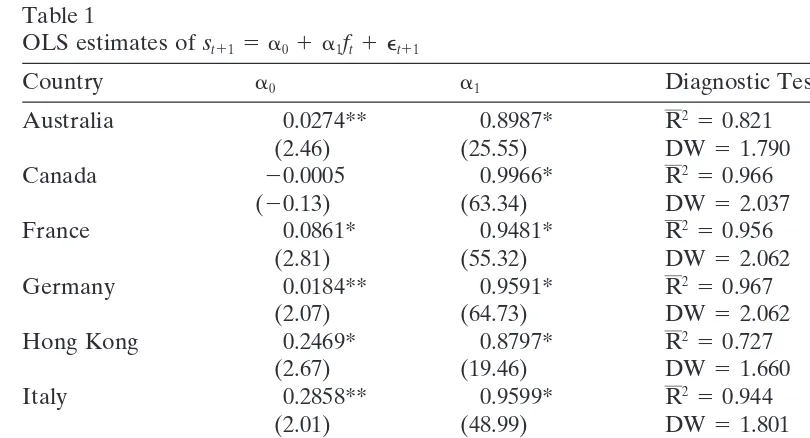
Table 1 presents the estimation of Eq. (1) by OLS and the estimated value ofd for the equilibrium error by the GPH test.23In all cases, except the United Kingdom,
the null hypothesisd51 is rejected (and the alternate nulld,1 is accepted) at the 5% level or above. In other words, for all currencies except the pound sterling results indicate evidence of fractional cointegration between the one-month forward rate and the spot rate. The size ofdis between 0.5 and20.5 in all eight cointegrating relation-ships, implying mean-reverting and covariance stationary residuals. Table 2 presents the results from the Harris-Inder test where the null hypothesis is the presence of cointegration. Three different lag lengths 0, 3 and 6 are applied in this test. Cointegra-tion at all three lags are indicated for Australia, France, Germany, Japan, South Africa and the United Kingdom. In four cases, Canada, Hong Kong, Italy and the United Kingdom, conflicting results are obtained from the GPH test and the Harris-Inder test.24 According to Harris and Inder (1994) if both the null of cointegration and no
cointegration are rejected then Type I error may have occurred in one of the tests. And if both null hypotheses are accepted, then at least one of the tests lacks power against the particular data-generating process.
Results from the F-test of the null hypotheses a1 5 1 and (a0, a1) 5 (0, 1) are
provided in Table 3. Results in Tables 1 and 2 show the coefficient on the forward rate to be significant in all tests. But the null of unit coefficient on the forward rate is rejected for all currencies except the Canadian dollar and the South African rand (Table 3). The null ofa050 anda151 is also accepted only in the case of Canada
and South Africa. In other words, the unbiased hypothesis is not rejected only in cases of Canada and South Africa. For the remaining currencies, the hypothesis is rejected at the 5% level or above. Our results provide some evidence for the weak-form forward market efficiency.
Table 1
OLS estimates ofst115 a01 a1ft1 et11
Country a0 a1 Diagnostic Tests d; H0: d51
Australia 0.0274** 0.8987* R250.821 0.141
(2.46) (25.55) DW51.790 (23.894)a
Canada 20.0005 0.9966* R250.966 0.253
(20.13) (63.34) DW52.037 (23.357)a
France 0.0861* 0.9481* R250.956 20.4617
(2.81) (55.32) DW52.062 (26.627)a
Germany 0.0184** 0.9591* R250.967 20.2023
(2.07) (64.73) DW52.062 (25.451)a
Hong Kong 0.2469* 0.8797* R250.727 0.3483
(2.67) (19.46) DW51.660 (22.955)b
Italy 0.2858** 0.9599* R250.944 0.2852
(2.01) (48.99) DW51.801 (23.241)a
Japan 0.1596* 0.9665* R250.980 0.2634
(2.78) (82.39) DW51.860 (23.340)a
South Africa 0.0090 0.9914* R250.973 20.4382
(0.62) (71.56) DW51.740 (26.521)a
U.K. 0.0451* 0.9156* R250.888 0.6714
(3.45) (33.58) DW51.804 (21.490)
* Implies significance at the 1% level. ** Implies significance at the 5% level.
aImplies rejection of the nulld51 at the 1% level. bImplies rejection of the nulld51 at the 5% level. t-statistics are in the parentheses.
DW5Durbin-Watson statistics.
Fractional cointegration critical values:23.198 (1%),22.245 (5%),21.791 (10%). Source: Sephton (1995).
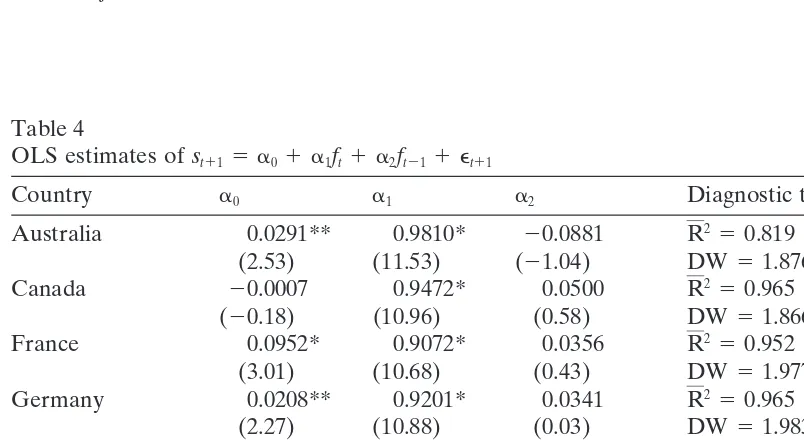
4 and 5. Testing Eq. (2), cointegration is confirmed in five out of the nine markets by means of the GPH test (Table 4). Cointegration is rejected for Australia, Canada, Italy and the United Kingdom. Results from the Harris-Inder test are quite similar to those using the GPH test (Table 5). Only the Hong Kong data provide a conflicting result; the Harris-Inder test fails to indicate a cointegrating relationship.25The
coeffi-Table 2
KPSS Test of the Residuals
Lags Australia Canada France Germany H Kong Italy Japan S Africa U.K.
0 0.212 0.380b 0.098 0.095 2.645a 0.331b 0.129 0.113 0.150
3 0.167 0.383b 0.100 0.096 1.640a 0.275c 0.110 0.087 0.136
6 0.178 0.396b 0.110 0.109 1.224a 0.278c 0.112 0.130 0.148
aImplies rejection cointegration at the 1% level. bImplies rejection cointegration at the 5% level. cImplies rejection cointegration at the 10% level.
Table 3
Unbiased forward rate hypothesis test
Null Hypotheses—FStatistics
Country H0:a151 H0: (a0,a1)5(0, 1)
Australia 8.294* 5.325*
Canada 0.047 0.800
France 9.162* 7.107*
Germany 7.615* 5.227*
Hong Kong 7.079* 5.436*
Italy 4.192** 4.212**
Japan 8.132* 5.017*
South Africa 0.387 0.196
U.K. 9.578* 6.697*
* Rejection of the null at the 1% level. ** Rejection of the null at the 5% level.
Table 4
OLS estimates ofst115 a01 a1ft1 a2ft211 et11
Country a0 a1 a2 Diagnostic tests d; H0:d51
Australia 0.0291** 0.9810* 20.0881 R250.819 1.0951
(2.53) (11.53) (21.04) DW51.876 (0.431)
Canada 20.0007 0.9472* 0.0500 R250.965 0.8208
(20.18) (10.96) (0.58) DW51.866 (20.813)
France 0.0952* 0.9072* 0.0356 R250.952 0.4149
(3.01) (10.68) (0.43) DW51.977 (22.653)c
Germany 0.0208** 0.9201* 0.0341 R250.965 0.3976
(2.27) (10.88) (0.03) DW51.983 (22.731)c
Hong Kong 0.1763*** 0.6644* 0.2498* R250.737 0.1956
(1.87) (7.34) (2.77) DW51.338 (23.647)b
Italy 0.3180** 1.0630* 20.1075 R250.942 0.7277
(2.20) (12.56) (21.29) DW52.016 (21.235)
Japan 0.1746* 1.0200* 20.0566 R250.979 0.2151
(2.97) (12.05) (20.68) DW52.000 (23.559)b
South Africa 0.0125 1.1070* 20.1200 R250.973 0.2768
(0.85) (13.07) (21.40) DW51.996 (23.279)b
U.K. 0.0523* 0.9892* 20.0885 R250.881 0.7379
(3.89) (11.80) (21.09) DW52.000 (21.188)
* Implies significance at the 1% level. ** Implies significance at the 5% level. *** Implies significance at the 10% level.
bImplies rejection of the nulld51 at the 5% level. cImplies rejection of the nulld51 at the 10% level. t-statistics are in the parentheses.
DW5Durbin-Watson statistics.
Table 5
KPSS test of the residuals
Lags Australia Canada France Germany H Kong Italy Japan S Africa U.K. 0 0.197c 0.421a 0.109 0.105 2.303a 0.317b 0.143 0.133 0.174c
3 0.175c 0.402a 0.107 0.103 1.290a 0.313b 0.134 0.119 0.174c
6 0.183c 0.414a 0.117 0.117 1.032a 0.319b 0.139 0.181c 0.180c aImplies cointegration at the 1% level.
bImplies cointegration at the 5% level. cImplies cointegration at the 10% level.
KPSS critical values: 0.5497 (1%), 0.3202 (5%), 0.2355 (10%). Source: Harris and Inder (1994).
cient on the lagged forward rate (ft21) is insignificant in all tests, except in the case
of Hong Kong (Tables 4 and 5). Once again the null hypothesis of the unbiased hypothesis is accepted only for Canada and South Africa (Table 6). But in the case of Canada we fail to find cointegration between the exchange rates. Thus, South Africa is the only country that provides evidence of a semi-strong efficient forward market. The null of a unit coefficient on the forward rate is accepted in all cases except for Hong Kong (Table 6).
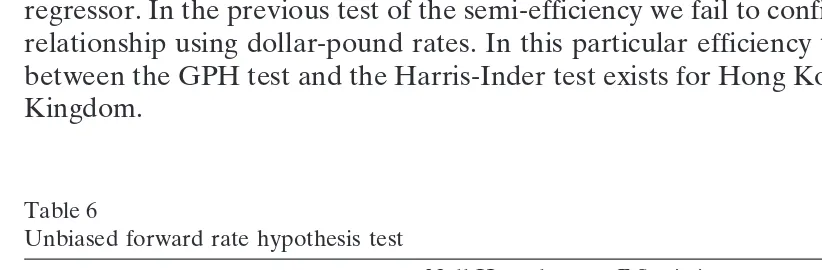
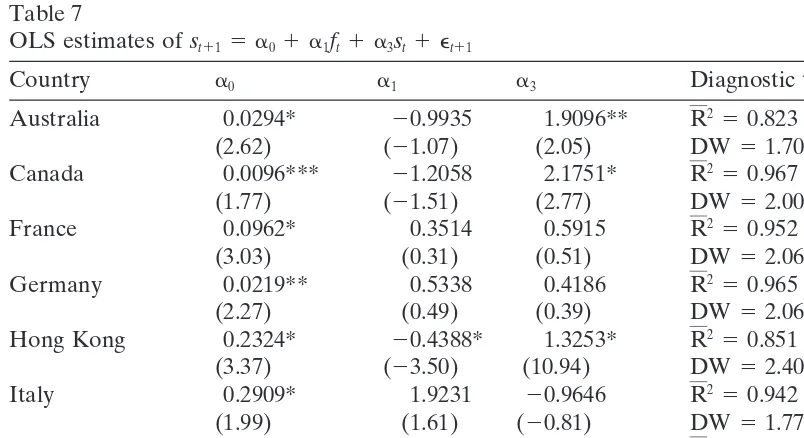
Results from Eq. (3) estimates are presented in Tables 7 and 8. As in the first test of semi-efficiency (Eq. (2)) cointegration by means of the GPH test is confirmed in the same five markets. The size of thedis also similar to that in the earlier test. The Harris-Inder test provides similar results, except for the United Kingdom. Cointegra-tion is found using the dollar-pound exchange rate and the lagged spot rate as a regressor. In the previous test of the semi-efficiency we fail to confirm a cointegrating relationship using dollar-pound rates. In this particular efficiency test, the difference between the GPH test and the Harris-Inder test exists for Hong Kong and the United Kingdom.
Table 6
Unbiased forward rate hypothesis test
Null Hypotheses—FStatistics
Country H0:a151 H0: (a0,a1,a2)5(0, 1, 0)
Australia 0.050 3.809**
Canada 0.373 0.699
France 1.193 5.201*
Germany 0.892 3.947*
Hong Kong 13.733* 6.263*
Italy 0.553 3.582**
Japan 0.056 4.065*
South Africa 0.207 0.806
U.K. 0.017 5.805*
Table 7
OLS estimates ofst115 a01 a1ft1 a3st1 et11
Country a0 a1 a3 Diagnostic tests d; H0:d51
Australia 0.0294* 20.9935 1.9096** R250.823 1.0959
(2.62) (21.07) (2.05) DW51.702 (0.435)
Canada 0.0096*** 21.2058 2.1751* R250.967 0.7411
(1.77) (21.51) (2.77) DW52.008 (21.174)
France 0.0962* 0.3514 0.5915 R250.952 0.4150
(3.03) (0.31) (0.51) DW52.063 (22.652)c
Germany 0.0219** 0.5338 0.4186 R250.965 0.4094
(2.27) (0.49) (0.39) DW52.063 (22.678)c
Hong Kong 0.2324* 20.4388* 1.3253* R250.851 0.1927
(3.37) (23.50) (10.94) DW52.406 (23.660)b
Italy 0.2909* 1.9231 20.9646 R250.942 0.7444
(1.99) (1.61) (20.81) DW51.77 (21.159)
Japan 0.1604* 21.4251 2.3906*** R250.979 0.2584
(2.73) (21.13) (1.90) DW51.950 (23.362)b
South Africa 0.0085 21.1353 2.1390** R250.973 0.1409
(0.585) (21.16) (2.16) DW51.741 (23.895)a
U.K. 0.0022* 0.9973* 0.0048 R250.999 0.8064
(2.67) (198.22) (0.99) DW50.544 (20.878)
* Implies significance at the 1% level. ** Implies significance at the 5% level. *** Implies significance at the 10% level.
aImplies rejection of the nulld51 at the 1% level. bImplies rejection of the nulld51 at the 5% level. cImplies rejection of the nulld51 at the 10% level. t-statistics are in parentheses.
DW5Durbin-Watson statistics.
Fractional cointegration critical values:23.834 (1%),22.860 (5%),22.371 (10%). Source Sephton (1995).
The coefficient on lagged spot rate (a3) is found to be positive in all cases but
significant in five cases. The coefficient on the forward rate (a1) is negative in five
cases but, among these negative coefficients, significant only in the case of Hong Kong. Longworth (1981) found similar results, i.e., negative coefficients on the forward rate and significant positive coefficients on the lagged spot rate. The null hypothesis
Table 8
KPSS test of the residuals
Lags Australia Canada France Germany H Kong Italy Japan S Africa U.K.
0 0.549a 0.278b 0.106 0.090 0.220b 0.333b 0.099 0.134 0.069
3 0.433a 0.289b 0.112 0.094 0.316b 0.280b 0.093 0.100 0.061
6 0.451a 0.288b 0.124 0.108 0.316b 0.282b 0.104 0.131 0.064
aImplies rejection of cointegration at the 1% level. bImplies rejection of cointegration at the 5% level.
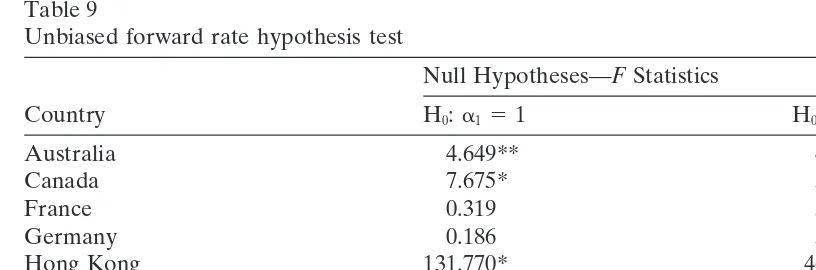
Table 9
Unbiased forward rate hypothesis test
Null Hypotheses—FStatistics
Country H0:a151 H0: (a0,a1,a3)5(0, 1, 0)
Australia 4.649** 4.924*
Canada 7.675* 3.137**
France 0.319 5.231*
Germany 0.186 3.939*
Hong Kong 131.770* 46.462*
Italy 0.595 3.224*
Japan 3.720*** 5.199*
South Africa 4.723* 1.719
U.K. 0.292 107.930*
* Implies rejection of the null at the 1% level. ** Implies rejection of the null at the 5% level. *** Implies rejection of the null at the 10% level.
of a unit coefficient on the forward rate is accepted only in France, Germany, Italy and the United Kingdom (Table 9). This result is quite different from the previous semi-strong efficiency test (Table 6). The null unbiased hypothesis is only found to be true for South Africa (Table 9). Thus, once again South African currency is the only currency that provides evidence supportive of the semi-strong efficiency.
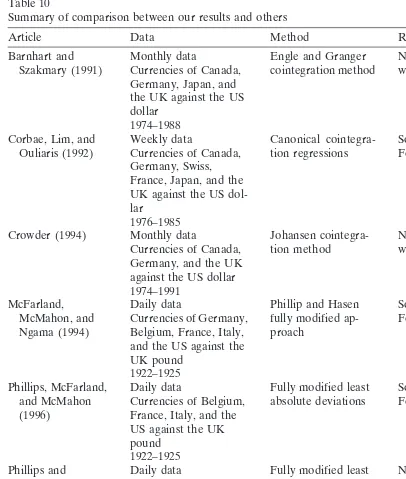
Table 10 provides a comparison between results presented in this article and results of other research articles that apply some form of cointegration procedure.26 As the
table indicates results presented are not identical in each article. Of course along with the estimation procedure the sample period and the data frequency are also not identical. Most results presented do provide some evidence of the forward rate effi-ciency. Lack of evidence is noted during the latest floating era. This article and the Corbae et al. (1992) article do help redeem the latest floating era.
4. Mean-reversion in forward premium
As suggested above, violation of the forward rate unbiasedness may be due to the existence of risk aversion on the part of the participants of the foreign exchange market. Risk averse participants require a premium on forward contracts that exposes them to exchange rate risk. Relying heavily on Crowder (1994, p. 556), the forward rate consists of the future spot rate, a risk premium (d) and a rational expectations forecast error (e).
ft5st111 dt111 et11. (9)
Furthermore, the future spot rate can be decomposed into current spot rate plus future depreciation.
Table 10
Summary of comparison between our results and others
Article Data Method Results
Barnhart and Monthly data Engle and Granger No evidence of the For-Szakmary (1991) Currencies of Canada, cointegration method ward rate hypothesis
Germany, Japan, and the UK against the US dollar
1974–1988
Corbae, Lim, and Weekly data Canonical cointegra- Some evidence of the Ouliaris (1992) Currencies of Canada, tion regressions Forward rate hypothesis
Germany, Swiss, France, Japan, and the UK against the US dol-lar
1976–1985
Crowder (1994) Monthly data Johansen cointegra- No evidence of the For-Currencies of Canada, tion method ward rate hypothesis Germany, and the UK
against the US dollar 1974–1991
McFarland, Daily data Phillip and Hasen Some evidence of the
McMahon, and Currencies of Germany, fully modified ap- Forward rate hypothesis Ngama (1994) Belgium, France, Italy, proach
and the US against the UK pound
1922–1925
Phillips, McFarland, Daily data Fully modified least Some evidence of the and McMahon Currencies of Belgium, absolute deviations Forward rate hypothesis (1996) France, Italy, and the
US against the UK pound
1922–1925
Phillips and Daily data Fully modified least No evidence of the For-McFarland Currency of Australia absolute deviations ward rate hypothesis (1997) against the US dollar
1984–1991
This paper Monthly data Fractional cointegra- Some evidence of the Currencies of Australia, tion and the Harris- Forward rate hypothesis Canada, France, Ger- Inder cointegration
many, Honk Kong, It- method aly, Japan, South Africa,
and the UK against the US dollar
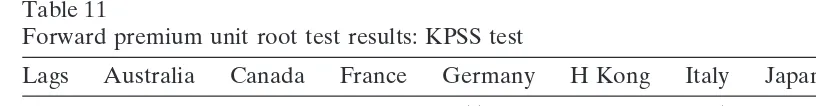
Table 11
Forward premium unit root test results: KPSS test
Lags Australia Canada France Germany H Kong Italy Japan S Africa U.K.
0 8.413* 2.192* 1.240* 4.551* 4.028* 0.859* 1.338* 2.585* 3.565*
3 2.450* 0.762* 0.393*** 1.330* 1.290* 0.292 0.479** 0.956* 0.115*
6 1.486* 0.499** 0.248 0.789* 0.908* 0.194 0.298 0.603** 0.692*
* Implies rejection of the null of stationarity at the 1% level. ** Implies rejection of the null of stationarity at the 5% level. *** Implies rejection of the null of stationarity at the 10% level.
KPSS critical value: 0.739 (1%), 0.463 (5%) and 0.347 (10%). Source Kwiatkowski et al. (1992).
Substituting Eq. (10) into Eq. (9), we get
ft2st5 Dst111 dt111 et11. (11)
Eq. (11) shows that the forward premium (ft2st) is the sum of the spot rate
deprecia-tion, risk premium and rational expectations error.27Given that the spot rate
deprecia-tion and the radeprecia-tional expectadeprecia-tion error are stadeprecia-tionary,28if the risk premium is covariance
stationary, then the forward premium must be stationary and the spot and the forward rate are cointegrated with the cointegrating vector of (1,21); consequently the unbi-ased hypothesis holds (Baillie & Bollerslev, 1994a).29
We conduct unit root tests (GPH and KPSS) to check for the stationarity of the forward premium (ft2st). Table 11 presents the results from the KPSS tests with 0,
3 and 6 lags. The KPSS test is applied without a trend, thus the null hypothesis is stationarity with a drift. The null is rejected at all lags length in six cases: Australia, Canada, Germany, Hong Kong, South Africa, and the United Kingdom. The null of stationarity is accepted using 3 and 6 lags in the case of Italy and using only 6 lags for France and Japan. Given the cointegration tests results and the unbiased test results, a nonstationary forward premium for Canada and South Africa and a stationary premium for Italy is quite surprising.30
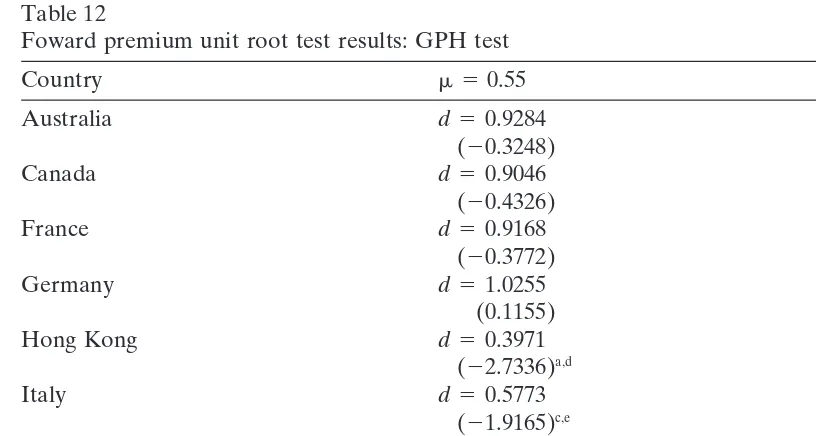
Baillie and Bollerslev (1994a) indicate that forward premium may be a long memory process; in other words, it may be a fractionally-integrated process, so that imposing a value of 0 and 1 fordmay be too restrictive. Baillie and Bollerslev, applying maximum likelihood estimations methods, find evidence indicating the forward premium to be fractionally integrated for several currencies. Table 12 shows results from the GPH tests of unit root in the nine forward premiums under consideration. Tests are conducted for two different values of m, i.e., 0.55 and 0.60. The hypothesis testing regarding the value ofd is based on two tests: a two-sided test where the null isd5
1 and alternate null isd ?1; and a one-sided test where the null is as befored 51
Table 12
Foward premium unit root test results: GPH test
Country m 50.55 m 50.60
Australia d50.9284 d50.8066
(20.3248) (21.0235)
Canada d50.9046 d50.6386
(20.4326) (21.9123)c,e
France d50.9168 d50.7122
(20.3772) (21.5227)
Germany d51.0255 d50.8293
(0.1155) (20.9033)
Hong Kong d50.3971 d50.5622
(22.7336)a,d (22.3166)b,e
Italy d50.5773 d50.6885
(21.9165)c,e (21.6482)a,e
Japan d50.6912 d50.7742
(21.4002) (21.1946)
South Africa d51.2064 d50.8240
(0.9359) (20.9312)
U.K. d50.8085 d50.7960
(20.8681) (21.0793)
aImplies rejection of the null of the one-sided test at the 1% level. bImplies rejection of the null of the one-sided test at the 5% level. cImplies rejection of the null of the one-sided test at the 10% level. dImplies rejection of the null of the two-sided test at the 1% level. eImplies rejection of the null of the two-sided test at the 5% level. t-statistics in parentheses.
Two-sided test H0:d51 and H1:d?1.
One-sided test H0:d51 and H1:d,1.
Two-sided critical values: 2.576 (1%), 1.960 (5%), and 1.645 (10%). One-sided critical values: 2.326 (1%), 1.645 (5%), and 1.282 (10%).
premium to be fractionally integrated when m is equal to 0.60. In both tests, the alternate null hypotheses are accepted. Results from Hong Kong and Italy show long memory forward premium using both values of m.31The difference in the KPSS and
the GPH tests results are quite considerable especially for Canada and Hong Kong.32
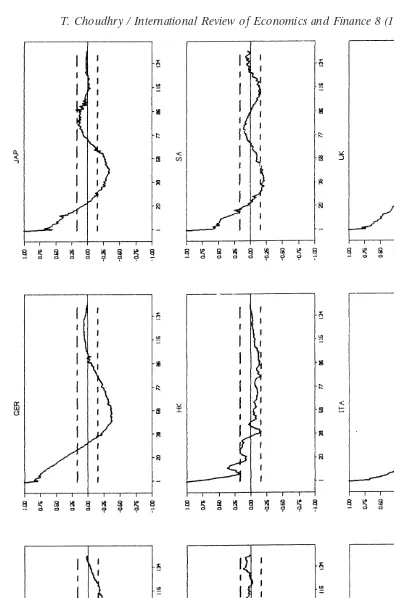
Fig. 1 shows the autocorrelation function of the nine forward premiums and the 5% confidence interval (two standard error). Interpretation from the figure is quite difficult but the forward premium from Australia, France, Germany, Japan and the United Kingdom seems to decay to zero quite slowly.
Fig.
1.
Autocorrelation
function
of
forward
provides evidence of the failure of the unbiased hypothesis during the 1920s due to the absence of rational expectations. Our results also indicate that the definition of the forward premium may very much dictate mean-reversion. Results provided in our article advocate the need for further research in this field.
5. Conclusions
This article investigates the weak-form and the semi-strong efficiency in the forward exchange market using nine currencies vis-a`-vis the U.S. dollar. Efficiency is investi-gated by means of cointegration between the spot rate and the forward rate, and the unbiased forward rate hypothesis. The empirical test is conducted using monthly data from January 1985 to December 1996 and two methods of cointegration test, a frac-tional (GPH) and the Harris-Inder. Results indicate ample evidence of cointegration between the spot and the forward exchange rates but little evidence of unbiased hypothesis is found. Only South Africa provides evidence of both the weak-form and the semi-strong efficiency, while only Canada indicates the weak-form efficiency. No other currency shows any sign of market efficiency. Nonstationary risk premium is considered to be one of the reasons behind the lack of unbiased hypothesis along with expectation errors, institutional consideration, etc. The risk premium is part of the forward premium along with covariance stationary spot rate depreciation and rational expectation errors. Stochastic structure of the forward premium may indicate the stochastic structure of the risk premium. Investigation of the stochastic structure of the forward premium indicates long-memory in cases of Canada, Hong Kong and Italy. Reasons other than nonstationary risk premium may be responsible for the lack of unbiased forward rate hypothesis in this article.
Acknowledgments
I thank two anonymous referees for their comments and suggestions. All remaining errors and omissions are my responsibility alone.
Notes
1. Detailed theoretical and mathematical outlines of the unbiased forward hypoth-esis are available in several books and articles, such as Baillie and McMahon (1989) and Gibson (1996). A detailed analysis is avoided here in order to save space.
2. Based on interest rate parity equilibrium and assuming uncovered interest arbitrage equilibrium Eq. (19) shows that
Et(st1k) 5ft, (19)
where Et is the expectations operator conditional on an information set
partici-pants have determined the forward rate,krandom shocks that were unpredict-able at time twill occur before the spot rate at timet1k is observed. Hence st1k 5ft1 ht, (29)
where E(ht) 50 and E(htht1j) 50 for j $k. On taking expectations at time
t21 throughout Eq. (29), Eq. (39) shows that
Et21(st1k 2ft) 50 (39)
so that an obvious test of the rational expectations, efficient market hypothesis would be to estimate the Eq. (49) model
st1k 5ft1 b9xt1 ht (49)
and to test the hypothesis that H0: b 5 0 versus H1: b?0 .
Under the null hypothesis, none of the variables in xthelps to further explain
st1kgiven that ftis already included in the formation set.
3. Based on Norrbin and Reffett (1996) the forward market efficiency requires three conditions. First, the future spot rate and the forward rate must be cointe-grated. Second, the coefficient on the cointegrating relationship for the forward rate must be unity. Third, the residual in the cointegrating regressions must be white noise.
4. Goodhart et al. (1992) show that rejection of the unbiased hypothesis may not be due to the risk premium but due to the domination of the forward exchange market by covered interest arbitrageurs. If the forward rate only reflects the difference between the domestic and foreign interest rates and the spot rate is (approximately) a random walk then the unbiased hypothesis will not hold. 5. See endnote 2 also.
6. Frenkel (1977) is unable to reject the null using 1920s data, and similar results are found by Bailey et al. (1984) using the current period data.
7. Citations of previous studies are avoided here in order to save space. See McFarland et al. (1994), Crowder (1994) and Phillips et al. (1996) for citations. 8. Barnhart and Szakmary (1991) and McCallum (1994) show the advantages of using a differenced equation. One major advantage of the differenced equation is that it directly tests the predictability of the forward exchange rate errors. 9. See Frenkel (1977), Bailey et al. (1984), and Baillie and McMahon (1989) for
citations.
10. Several studies find the spot rate and the forward rate to be nonstationary in levels. For example, see Corbae et al. (1992), McFarland et al. (1994), Crowder (1994), and Phillips et al. (1996).
12. Detailed analysis of the concept of cointegration can be found in several different articles and books.
13. For20.5,d,0.5 the process is both mean-reverting and covariance stationary. 14. Cheung and Lai (1993), Baillie and Bollerslev (1994b) and Chou and Shih
(1997) provide detail analysis of fractional cointegration.
15. A detailed analysis of the GPH test and the application of this test is provided in Cheung and Lai (1993). We follow the same procedure as Cheung and Lai. 16. According to Booth and Tse (1995) the main advantage of the GPH method is that it permits estimation ofdwithout knowledge ofpandqin ARFIMA (p, d,q). Furthermore, this method is robust for short-term dependence, conditional heteroscedastic effects, and variance shift.
17. Since the error term (zt) is not observed but obtained from minimizing the
residual variance of the cointegration regression the critical values derived from the standard distribution cannot be used directly to evaluate the GPH estimate ofd(Cheung & Lai, 1993; Sephton, 1993). Sephton (1993), using Monte Carlo experiments, generates estimates of GPH test sizes across a number of likely scenarios. The GPH test statistics are negatively skewed and non-standard. 18. Leybourne and McCabe (1993) also provide a very similar test.
19. The KPSS test for stationarity is based on the Lagrange Multiplier estimate of a regression of a variable on a constant (and possibly a trend). The test is calculated as
h 5 (
o
T
t51
St2)/(T2s2(k))
whereSt2is the partial sum process of the residuals from the stated regression,
and s2(k) is a consistent estimate of the error variance using the procedure
advocated by Newey and West (1987) that is based on a Bartlet window adjust-ment using the first k sample autocovariances.
20. Monthly data is applied because overlapping data such as daily or weekly may result in bias in the coefficients. Another advantage of using monthly data is that because of the overlapping data the error term in Eqs. (1), (2), and (3) can be expected to be serially dependent and possibly temporally heterogeneous (Phillips & McFarland, 1997). These problems do not arise when the contract period does not exceed the sampling interval, such as monthly data.
21. Application of the exchange rate in natural logarithms helps avoid the so-called Siegel (1972) paradox (Baillie & McMahon, 1989). Bailey et al. (1984) claim that the Siegel paradox arises when at least one currency can be shown to be biased for purely mathematical reasons. A detailed analysis of the Siegel paradox is provided in Baillie and McMahon (1989) and Sibert (1989).
24. Stationarity of the Eq. (1) residuals were also checked by means of the ADF tests, and all nine residuals were found to be stationary in levels. Thus, ADF tests indicate cointegration for all currencies. These results are available on request.
25. Once again results from the ADF tests indicate cointegration in all nine cases. These results are available on request.
26. Due to lack of space only a few of the (latest) published article results summary are presented.
27. The forward premium may be also defined as (ft2st)/st, based on the covered
interest parity condition ft/st5(11 rtd)/(11rtf)
where rtd and rtf are the domestic and the foreign interest rates. By a slight
rearrangement the covered interest parity can also be expressed as (ft2st)/st5(rtd 2rtf)/(11rtf) .
Since 1 1rtf is approximately equal to unity, the covered interest parity may
also be approximately (ft2st)/st5rtd2rtf.
28. In this study all nine spot rates indicate one unit root. Thus, the first differences of all spot rates are stationary.
29. Crowder (1992, 1994) finds nonstationary forward premium (ft2st) using several
different exchange rates.
30. We also investigated the presence of unit root(s) by means of the KPSS test in the forward premium defined as (ft2st)/st.The Italian and the South African
forward premium are found to be stationary in levels using 3 and 6 lags. The French and the Japanese forward premium are stationary using 6 lags only. The South African result is quite encouraging considering the unbiased hypothe-sis result. These results are available on request.
31. The GPH test is also conducted to check for long memory in (ft2st)/stdefinition
of the forward premium. Forward premiums of Hong Kong, Italy and the United Kingdom are found to have long memory using both values ofm. The Australian forward premium has long memory only when mis equal to 0.60. Once again the GPH and the KPSS tests provide conflicting results. These GPH results are available on request.
32. Increasing the value ofmto 0.65, the GPH test indicates a fractionally-integrated forward premium for South Africa and a nonstationary forward premium for Hong Kong. As indicated earlier, the choice ofmdoes have a significant effect on the result.
References
Baillie, R ., & McMahon, P. (1989).The Foreign Exchange Market: Theory and Economic Evidence.
Cambridge: Cambridge University Press.
Baillie, R., & Bollerslev, T. (1994a). The long memory of the forward premium.Journal of International Money and Finance 13, 565–571.
Baillie, R., & Bollerslev,T. (1994b). Cointegration, fractional cointegration, and exchange rate dynamics,
Journal Finance 49, 737–745.
Barnhart, S., & Szakmary, A. (1991). Testing the unbiased forward rate hypothesis: evidence on unit roots, co-integration and stochastic coefficients.Journal of Financial and Quantitative Analysis 26, 245–267.
Booth, G., & Tse, Y. (1995). Long memory in interest rate futures markets: a fractional cointegration analysis.Journal of Futures Markets 15, 573–584.
Cheung, Y., & Lai, K. (1993). A fractional cointegration analysis of purchasing power parity.Journal of Business and Economic Statistics 11, 103–112.
Chou, W., & Shih, Y. (1997). Long-run purchasing power parity and long-term memory: evidence from Asian newly industrialized countries.Applied Economics Letters 4, 575–578.
Corbae, D., Lim, K., & Ouliaris S. (1992). On cointegration and tests of forward market unbiasedness.
Review of Economics and Statistics 74, 728–732.
Crowder, W. (1992). Spot and forward exchange rates and the efficiency of foreign exchange markets, working paper. Arlington: University of Texas at Arlington.
Crowder, W. (1994). Foreign exchange market efficiency and common stochastic trends.Journal of International Money and Finance 13, 551–564.
Engle, R., & Granger, C. (1987). Cointegration and error correction: representation, estimation, and testing.Econometrica 55, 251–276.
Fama, E. (1984). Forward and spot exchange rates.Journal of Monetary Economics 14, 319–338. Frenkel, J. (1977). The forward exchange rate, expectations, and the demand for money: the German
hyperinflation.American Economic Review 67, 653–670.
Frenkel, J. (1980). Exchange rates, prices and money: lessons from the 1920s.American Economic Review, Papers and Proceedings 70, 235–242.
Geweke, J., & Porter-Hudak, S. (1983). The estimation and application of long memory time series models.Journal of Time Series Analysis 1, 221–238.
Gibson, H. (1996).International Finance: Exchange Rates and Financial Flows in the International Systems.
London: Longman.
Goodhart, C., McMahon, P., & Ngama, Y. (1992). Does the forward premium/discount help to predict the future change in the exchange rate?Scottish Journal of Political Economy 39, 129–140.
Granger, C., & Joyeux, R. (1980). An introduction to long memory time series models and fractional differencing.Journal of Time Series Analysis 1, 15–39.
Granger, C., & Newbold, P. (1986).Forecasting Economic Time Series(2nd ed.). San Francisco: Academic Press.
Hakkio, C., & Sibert, A. (1995). The foreign exchange risk premium: is it real?Journal of Money, Credit, and Banking 27, 301–317.
Harris, D., & Inder, B. (1994). A test of the null hypothesis of cointegration. In C. Hargreaves (Ed.),
Nonstationary Time Series Analysis and Cointegration(pp. 78–94). Oxford: Oxford University Press. Hosking, J. (1981). Fractional differencing.Biometrika 68, 165–176.
Johansen, S. (1988). Statistical analysis of cointegrating vectors. Journal of Economic Dynamics and Control 12, 231–254.
Kwiatkowski, D, Phillips, P, Schmidt, P., & Shin, Y. (1992). Testing the null hypothesis of stationary against the alternative of a unit root: how sure are we that economic time series have a unit root?
Journal of Econometrics 54, 159–178.
Lee, D., & Schmidt, P. (1996). On the power of the KPSS test of stationary against fractionally-integrated alternatives.Journal of Econometrics 73, 285–302.
Longworth, D. (1981). Testing the efficiency of the Canadian-U.S. exchange market under the assumption of no risk premium.Journal of Finance 36, 43–49.
McFarland, J., McMahon, P., and Ngama, Y. (1994). Forward exchange rates and expectations during the 1920s: a re-examination of the evidence.Journal of International Money and Finance 13, 627–636. McCallum, B. (1994). A reconsideration of the uncovered interest parity relationship.Journal of Monetary
Economics 33, 105–132.
Newey, W., & West, K. (1987). A simple, positive semi-definite, heteroskedasticity and autocorrelation consistent covariance matrix.Econometrica 55, 703–708.
Norrbin, S., & Reffett, K. (1996). Exogeneity and forward rate unbiasedness.Journal of International Money and Finance 15, 267–274.
Phillips, P., McFarland, J., & McMahon, P. (1996). Robust tests of forward exchange market efficiency with empirical evidence from the 1920s.Journal of Applied Econometrics 11, 1–22.
Phillips, P., & McFarland , J. (1997). Forward exchange market unbiasedness: the case of the Australian collar since 1984.Journal of International Money and Finance 16, 885–907.
Sephton, P. (1993). Fractional cointegration: Monte Carlo estimates of critical values, with an application, working paper. New Brunswick: Department of Economics, University of New Brunswick.
Sibert, A. (1989). The risk premium in the foreign exchange market.Journal of Money, Credit, and Banking 21, 49–64.
Siegel, J. (1972). Risk interest rates and the forward exchange. Quarterly Journal of Economics 89, 173–175.