1 2 3 4 5 6 7 8 9 10 11 12 13 14 15 16 17 18 19 20 21 22 23 24 25 26 27 28 29 30 31 32 33 34 35 36 37 38 39 40 41 42 43 44 45 46 47 48 49 50 51 52 53 54 55 56
1 2 3 4 5 6 7 8 9 10 11 12 13 14 15 16 17 18 19 20 21 22 23 24 25 26 27 28 29 30 31 32 33 34 35 36 37 38 39 40 41 42 43 44 45 46 47 48 49 50 51 52 53 54 55 56
ATMPH_113_16
O
r
igi
n
al
ar
ti
c
l
e
Access this article online
Quick Response Code: Website:
www.atmph.org
DOI:
the total 250 million people of Indonesia (60%) have participated in BPJS, which made it as the largest health insurer in the world.[5] This achievement should be balanced by providing the best quality services to patients either provided directly by BPJS or by its partners [Public Health Centre (PHC)]. One of indicators to measure the quality of PHC services is the satisfaction of patients/ service users of PHC.[6]
Methodology
It uses descriptive quantitative that describes the level of patients’ satisfaction by five dimensions of the quality
Introduction
Patient’ satisfaction is an output of health services, thus patient’s satisfaction is one of the goals of health quality of service improvement. Patients will be satisfied if the performance of health services equals or exceeds to their expectations. Meanwhile, patients will not be satisfied if the performance of health services is lower than the level of their expectation.[1-3] A public interest in using health services that have been organized by the agency of Social Care of Health Insurance [BPJS (Badan Penyelenggara Jaminan Sosial)] is very high, especially with the obligation of the entire population to participate in BPJS on January 1, 2019.[4] Nowadays, nearly 150 million of
The analysis of patients’ satisfaction of National Health Insurance in
some public health centers in Padang
Adila Kasni Astiena, Nur Afrainin Syah1
Faculty of Public Health of Andalas University, 1Faculty of Medicine Andalas University
Abstract
Background: National Health Insurance in Indonesia that is processed by Social Security Agency of Health or known as Badan Penyelenggara Jaminan Social (BPJS) has been conducted for 2 years. The Public Health Center (PHC) as the partner of BPJS should have satisfied the patients. The preliminary study showed that 5 of 10 informants were not satisfied by the service of PHC. Objectives: This research aims to determine the satisfaction of BPJS’ patients in some PHCs in Padang. Setting and Design: The design of this research is a Quantitative by observing the quality services and patients’ satisfaction, which is based on five dimensions proposed by Parasuraman and Zeithm: Reliability, Responsiveness, Assurance, Empathy, and Tangible. This study was conducted in PHCs in Padang from September to November 2015. The populations were all of BPJS’ patients who visited the PHCs of Padang. Samples were obtained by using cluster sampling selected from three PHCs with the total of 150 respondents. Statistical Analysis Used: The data were tested by using validity and reliability test and all of the data were valid and reliable. The data were displayed in univariate way to describe the quality and patients’ satisfaction as well as the priority to improve the quality and the satisfaction by using Cartesian Diagram. Result: The results of this study showed that from the 18 attributes of services, the patients’ satisfaction has been reached on two attributes, namely, "polite and friendly services” and “neatness and clean performance officers.” It is priority to improve four service attributes, that is, “speed of service,” “the ability of officers,” “attention,” and “equipment” for enhancing the quality of service
Key words: Public Health Centers, quality of PHC, patient’s satisfaction, BPJS (Social Care of Health Insurance)
Correspondence:
Dr. Adila Kasni Astiena, School of Public Health at Andalas University, Padang, Indonesia. E-mail: [email protected]
This is an open access article distributed under the terms of the Creative Commons Attribution-NonCommercial-ShareAlike 3.0 License, which allows others to remix, tweak, and build upon the work non-commercially, as long as the author is credited and the new creations are licensed under the identical terms.
For reprints contact: [email protected]
1
of health services, which are proposed by Parasuraman, Zheitmal, and Berry.[7] The study was conducted in September and November 2015. The research located in PHCs of Padang (Kuranji subdistrict) and samples were obtained by cluster sampling. All of PHCs are: PHC of Ambacang, PHC of Belimbing, and PHC of Kuranji and it is set based on quota sampling as many as 50 respondents.
This is in accordance with the decision of the Minister of Health No. 129 Year 2008,[8] in order to determine the sample in the study of patient’s satisfaction it has to constitute at least 50 people, and then the total number of respondents became 150 patients. The inclusion criterion was the patients who possessed BPJS card and have got service at the Health Center (in the second arrival). The exclusion criterion is if the patients refuse to be interviewed.
Patient’s satisfaction is measured by five indicators of health quality services (Tangibles, Responsiveness, Reliability, Assurance, and Empathy) and it is then compared with the patient's expectations at service performance.[9] The expectation level was measured by using a Likert’s Scale with the graduations: “Strongly Important (SI)” if scale is 5, “Important (I)” if scale is 4, “Neutral (N)” if scale is 3, “Unimportant (UN)” if scale is 2, and “Strongly Unimportant (SUN)” if scale is 1. The levels of performance of health services are: “Strongly Good (SG)” if scale is 5, “Good (G)” if scale is 4, “Neutral (N)” if scale is 3, “Not Good (NG)” if scale is 2, and “Strongly Not Good (SNG)” if scale is 1.
Data were collected by using a questionnaire consists of about 18 patients’ satisfaction questions.[10] The validity test used Pearson Product Moment and the reliability used Cronbach Alpha. The analysis of data used computer programs Microsoft Excel and SPSS. Data are presented in univariate in the form of patients’ satisfaction index as well as the priority of improving quality of health services by using Cartesian Diagram.
Result
Validity Test
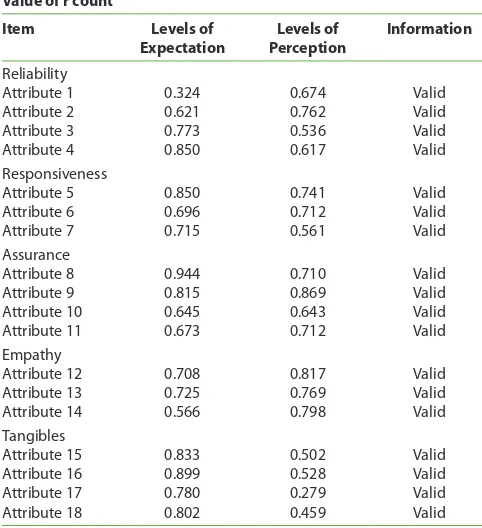
A datum collection tool (questionnaire) is stated to be valid if it is able to measure and can reveal the data that will be observed correctly (valid). The validity of this research was conducted by comparing the value of r count (a correlation of total item) with the value of r table. If the value of r count is greater than the value of r table, then the item is declared with a valid questionnaire. Conversely, if the value of r count is smaller than the value of r table, then the questions on the questionnaire will be declared invalid. The validity of test results can be seen in Table 1. From Table 1, it is known that each of the questions on each dimension that attributes to service quality has the bigger value of r count than the value of r table (0.159). Thus, each item dimension that attributes to service quality is declared “valid.”
Reliability Test
Data reliability test is intended to measure the consistency of the construction of the study attribute. Test equipment is stated reliable at estimation, whereas the measuring instrument (questionnaire) is measured repeatedly by different samples. It can be seen in Table 2. From Table 2, it can be seen that all questions of five dimensions of satisfaction were declared being reliable
Table 1: Results on Validity Test Questions of Item in Service Dimensions
Value of r count
Item Levels of
Expectation
Levels of Perception
Information
Reliability Attribute 1 Attribute 2 Attribute 3 Attribute 4
0.324
Attribute 5 Attribute 6 Attribute 7
0.850
Attribute 8 Attribute 9 Attribute 10 Attribute 11
0.944
Attribute 12 Attribute 13 Attribute 14
0.708
Attribute 15 Attribute 16 Attribute 17 Attribute 18
0.833
Source : A primer data which has been processed in 2015
Figure 1: A Framework Concept of the Research (adapted from Marshall and Murdoch[9]
TANGIBLES
RESPONSIVENESS
ASSURANCE RELIABILITY
EMPATHY
1 2 3 4 5 6 7 8 9 10 11 12 13 14 15 16 17 18 19 20 21 22 23 24 25 26 27 28 29 30 31 32 33 34 35 36 37 38 39 40 41 42 43 44 45 46 47 48 49 50 51 52 53 54 55 56
1 2 3 4 5 6 7 8 9 10 11 12 13 14 15 16 17 18 19 20 21 22 23 24 25 26 27 28 29 30 31 32 33 34 35 36 37 38 39 40 41 42 43 44 45 46 47 48 49 50 51 52 53 54 55 56 because it has the value of Cronbach Alpha that
exceeded 0.159.
Respondents’ Characteristics
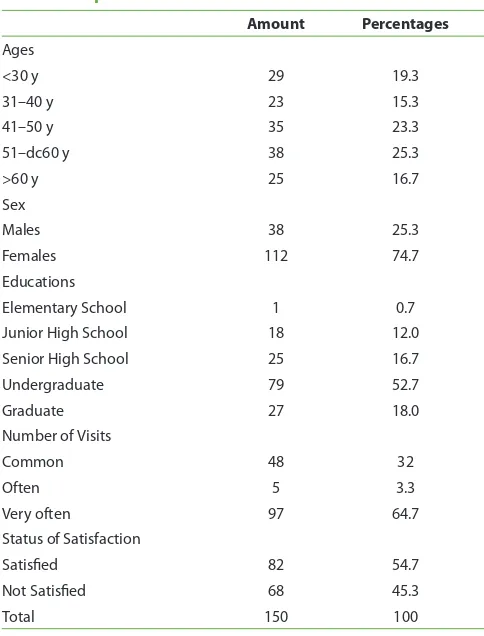
The respondents’ characteristics can be seen in Table 3. It describes that the main criterion of ages comes to the category of “51–60” years (25.3%), the main criterion of sex comes from “females” (74.7%), the main level of education goes to undergraduate (52.7%), the number of visits is “very often” (64.7%), and then the main status of satisfaction goes to “satisfied” (55%).
Table 2: Results on Reliability Test Questions in Dimensions of Services Quality
Amount Percentages
Ages
<30 y 29 19.3
31–40 y 23 15.3
41–50 y 35 23.3
51–dc60 y 38 25.3
>60 y 25 16.7
Sex 100,0
Males 38 25.3
Females 112 74.7
Educations 100,0
Elementary School 1 0.7
Junior High School 18 12.0
Senior High School 25 16.7
Undergraduate 79 52.7
Graduate 27 18.0
Number of Visits
Common 48 32
Often 5 3.3
Very often 97 64.7
Status of Satisfaction
Satisfied 82 54.7
Not Satisfied 68 45.3
Total 150 100
Table 3: Respondents Characteristics
Analysis and Discussion of Each Attribute Service
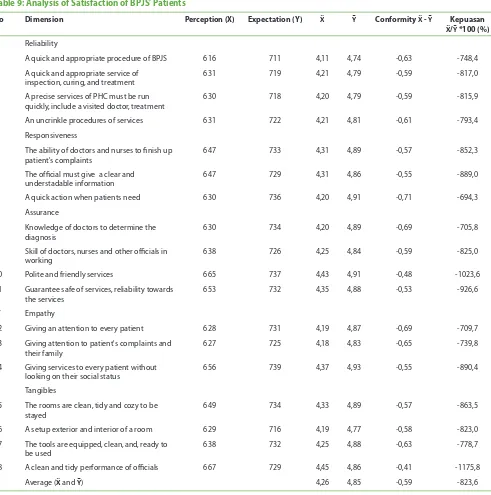
An analysis dimension of reliability (Reliability) can be seen in Table 4. From Table 4, it can be seen that in the dimension of reliability, the total value of services (2.508) is lower than expectations (2.870). An analysis of dimension of responsiveness (Responsiveness) can be seen in Table 5. From Table 5, it can be seen that in the dimension of responsiveness, the total value of services (1.924) is lower than expectations (2.198). An analysis of dimension of assurance (Assurance) can be seen in Table 6. From Table 6, it can be seen that in the dimension of assurance, the total value of services (2.586) is lower than expectations (2.929). An analysis of dimension of attention (Empathy) can be seen in Table 7. From Table 7, it can be seen that in the dimension of Empathy, the total value of services (1.911) is lower than expectations (2.195). An analysis of dimension of physical evidence (Tangibles) can be seen in Table 8. From Table 8, it can be seen that in the dimension of Tangibles, the total value of services (2.583) is lower than expectations (2.911). Then, an analysis of satisfaction of BPJS’ patients can be seen in Table 9. From Table 9, it can be seen that from the 18 attributes of quality of care of patients, only two attributes are capable of satisfying the patients, namely the polite and friendly service with appropriateness value -0,48 (90.2% if X/Y multiplied 100%) as well as the neatness and cleanliness of the performance of officers with appropriateness value -0,41 (91.5% if X/Y multiplied 100%) Meanwhile, other 16 attributes are considered unable to satisfy the patients.
Priority of Improvement of Patient’s Satisfaction
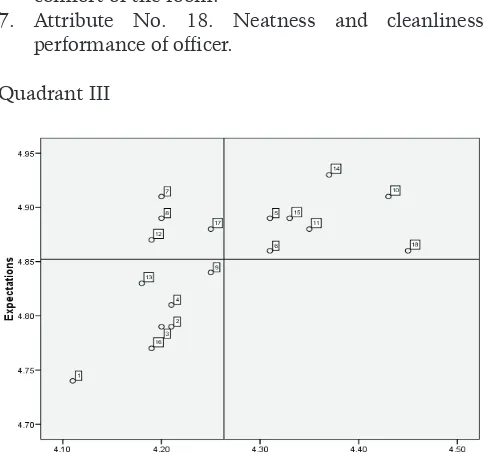
The priority of improvement of service quality and patients’ satisfaction in the future is shown in the Cartesian Diagram [Figure 2]. From the diagram, it can be explained that there is a relation between the vertical, Expectation curve and the horizontal,
Performance curve. The more the vertical curve rises, the more the expectation will be. In the same thing, the
No Attribute Alpha
Levels of Expectation Levels of Perception Information
1 Reliability 0,6136 0,6702 Reliable
2 Responsiveness 0,4987 0,5690 Reliable
3 Assurance 0,6549 0,6437 Reliable
4 Empathy 0,5277 0,5893 Reliable
1 2 3 4 5 6 7 8 9 10 11 12 13 14 15 16 17 18 19 20 21 22 23 24 25 26 27 28 29 30 31 32 33 34 35 36 37 38 39 40 41 42 43 44 45 46 47 48 49 50 51 52 53 54 55 56 1
2 3 4 5 6 7 8 9 10 11 12 13 14 15 16 17 18 19 20 21 22 23 24 25 26 27 28 29 30 31 32 33 34 35 36 37 38 39 40 41 42 43 44 45 46 47 48 49 50 51 52 53 54 55 56
Table 4: Level of Expectations and Services in Reliability Dimension
No Questions Expectations Total Performances Total
SI I N UN SUN SG G N NG SNG
1 2 3 4 5 1 2 3 4 5
1 A quick and appropriate procedure of BPJS
0 0 7 25 118 711 0 3 35 55 57 616
2 A quick and appropriate service of inspection, curing, and treatment
0 0 5 21 124 719 1 0 30 55 64 631
3 A precise services of PHC must be run quickly, include a visited doctor, treatment
0 0 8 16 126 718 0 4 24 60 62 630
4 An uncrinkle procedures of services 0 0 4 20 126 722 1 6 27 43 73 631
Total 0 0 24 82 494 2.870 2 13 116 213 256 2.508
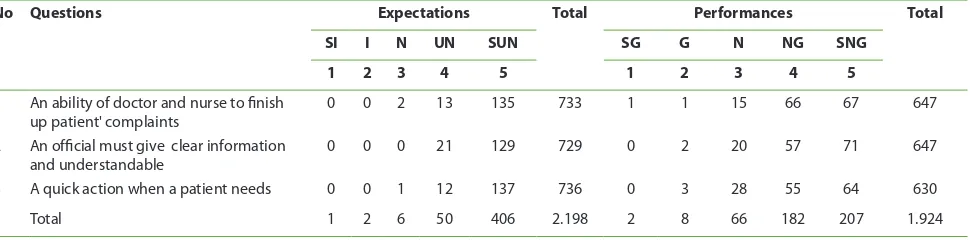
Table 5: Analysis of Dimension of Responsiveness (Responsiveness)
No Questions Expectations Total Performances Total
SI I N UN SUN SG G N NG SNG
1 2 3 4 5 1 2 3 4 5
1 An ability of doctor and nurse to finish up patient' complaints
0 0 2 13 135 733 1 1 15 66 67 647
2 An official must give clear information and understandable
0 0 0 21 129 729 0 2 20 57 71 647
3 A quick action when a patient needs 0 0 1 12 137 736 0 3 28 55 64 630
Total 1 2 6 50 406 2.198 2 8 66 182 207 1.924
Table 6: Analysis Dimension of Assurance (Assurance)
No Questions Expectations Total Performances Total
SI I N UN SUN SG G N NG SNG
1 2 3 4 5 1 2 3 4 5
1 Knowledge of doctor to determine the diagnosis
0 0 3 10 137 734 0 2 26 62 60 630
2 A skill of doctor, nurse and other official in working
0 1 3 15 131 726 0 1 22 65 62 638
3 A polite and friendly services 0 0 0 13 137 737 0 0 16 53 81 665
4 Safety guarantee and reliability toward the services
0 0 1 16 133 732 0 2 14 63 71 653
Total 0 1 7 54 538 2.929 0 5 78 243 274 2.586
Table 7: Analysis Dimension of Attention (Empathy)
No Questions Expectations Total Performances Total
SI I N UN SUN SG G N NG SNG
1 2 3 4 5 1 2 3 4 5
1 Giving a good attention to every patient 0 0 1 17 132 731 0 3 27 59 61 628
2 Giving an attention to patients complaints and their families
0 1 3 16 130 725 0 3 23 68 56 627
3 A service toward patient without looking on their social status
0 0 0 11 139 739 0 5 12 55 78 656
1 2 3 4 5 6 7 8 9 10 11 12 13 14 15 16 17 18 19 20 21 22 23 24 25 26 27 28 29 30 31 32 33 34 35 36 37 38 39 40 41 42 43 44 45 46 47 48 49 50 51 52 53 54 55 56
1 2 3 4 5 6 7 8 9 10 11 12 13 14 15 16 17 18 19 20 21 22 23 24 25 26 27 28 29 30 31 32 33 34 35 36 37 38 39 40 41 42 43 44 45 46 47 48 49 50 51 52 53 54 55 56
Table 8: Analysis Dimension of Physical Evidence (Tangibles)
No Questions Expections Total Performances Total
SI I N UN UN SG G N NG SNG
1 2 3 4 5 1 2 3 4 5
1 The rooms are clean, tidy and cozy to be stayed 0 0 1 14 135 734 0 1 17 64 68 649
2 A setup exterior and interior of a service room 0 0 5 24 121 716 0 2 25 65 58 629
3 Tools are equipped, clean and ready to be used 0 0 3 12 135 732 0 1 21 67 61 638
4 A clean and tidy performance of the official 0 0 1 19 130 729 0 0 10 63 77 667
Total 0 0 10 69 521 2.911 0 4 73 259 264 2.583
Table 9: Analysis of Satisfaction of BPJS’ Patients
No Dimension Perception (X) Expectation (Y) Ẍ Ῡ Conformity Ẍ - Ῡ Kepuasan Ẍ/Ῡ *100 (%) I Reliability
1 A quick and appropriate procedure of BPJS 616 711 4,11 4,74 -0,63 -748,4
2 A quick and appropriate service of inspection, curing, and treatment
631 719 4,21 4,79 -0,59 -817,0
3 A precise services of PHC must be run quickly, include a visited doctor, treatment
630 718 4,20 4,79 -0,59 -815,9
4 An uncrinkle procedures of services 631 722 4,21 4,81 -0,61 -793,4
II Responsiveness
5 The ability of doctors and nurses to finish up patient's complaints
647 733 4,31 4,89 -0,57 -852,3
6 The official must give a clear and understadable information
647 729 4,31 4,86 -0,55 -889,0
7 A quick action when patients need 630 736 4,20 4,91 -0,71 -694,3
III Assurance
8 Knowledge of doctors to determine the diagnosis
630 734 4,20 4,89 -0,69 -705,8
9 Skill of doctors, nurses and other officials in working
638 726 4,25 4,84 -0,59 -825,0
10 Polite and friendly services 665 737 4,43 4,91 -0,48 -1023,6
11 Guarantee safe of services, reliability towards the services
653 732 4,35 4,88 -0,53 -926,6
IV Empathy
12 Giving an attention to every patient 628 731 4,19 4,87 -0,69 -709,7
13 Giving attention to patient's complaints and their family
627 725 4,18 4,83 -0,65 -739,8
14 Giving services to every patient without looking on their social status
656 739 4,37 4,93 -0,55 -890,4
V Tangibles
15 The rooms are clean, tidy and cozy to be stayed
649 734 4,33 4,89 -0,57 -863,5
16 A setup exterior and interior of a room 629 716 4,19 4,77 -0,58 -823,0
17 The tools are equipped, clean, and, ready to be used
638 732 4,25 4,88 -0,63 -778,7
18 A clean and tidy performance of officials 667 729 4,45 4,86 -0,41 -1175,8
1 2 3 4 5 6 7 8 9 10 11 12 13 14 15 16 17 18 19 20 21 22 23 24 25 26 27 28 29 30 31 32 33 34 35 36 37 38 39 40 41 42 43 44 45 46 47 48 49 50 51 52 53 54 55 56 1
2 3 4 5 6 7 8 9 10 11 12 13 14 15 16 17 18 19 20 21 22 23 24 25 26 27 28 29 30 31 32 33 34 35 36 37 38 39 40 41 42 43 44 45 46 47 48 49 50 51 52 53 54 55 56
more the horizontal moves to the right, the more the performance will be.
The results on the interpretation of the pictures can be explained as follows:
Quadrant I
Attributes to service quality and satisfaction that are located in Quadrant I are
1. Attribute No. 7. The quick action when it is required by patients.
2. Attribute No. 8. The knowledge and abilities of the doctors to make a diagnosis of the disease.
3. Attribute No. 12. A special attention to every patient.
4. Attribute No.17. Completeness, readiness, and cleanliness of the tools used.
Quadrant II
Attributes that are located in Quadrant II are
1. Attribute No. 5. Doctors and Nurses have to act quickly in helping patient’s grievance.
2. Attribute No. 6. Officers provide a clear and easy to understand information.
3. Attribute No. 10. Services were polite and friendly. 4. Attribute No. 11. Security guarantee and trust to
services.
5. Attribute No. 14. Services to all patients regardless of social status.
6. Attribute No. 15. Cleanliness, neatness, and comfort of the room.
7. Attribute No. 18. Neatness and cleanliness performance of officer.
Quadrant III
Attributes that are located in Quadrant III are
1. Attribute No. 1. The procedure of admission BPJS’ patient is quick and accurate.
2. Attribute No. 2. Check-up services, mediation, and care are quick and accurate.
3. Attribute No. 3. Schedules of hospital services are carried out appropriately.
4. Attribute No. 4. Procedure of services is straightforward.
5. Attribute No. 9. The skill of doctors, nurses, and other personnels in working.
6. Attribute No. 13. Attention to the complaints of patients and their families.
7. Attribute No. 16. The arrangement of the exterior and interior of the room.
Quadrant IV
None of the attributes fall into this quadrant.
Discussion
Validity and Reliability Test
The study assesses patients' satisfaction using Questionnaire proposed by Supranto (2011).[10] Validity and reliability test is reconducted on the patients of BPJS in PHC of Kuranji. From the 18 questions, all the questions declared that it is valid and reliable. The validity question of the study shows that the questions really measured the satisfaction of BPJS’ patients and the results are consistent (reliable). Thus the measuring instruments that were used would test both its validity and reliability.
Patients’ Satisfaction in Public Health Centers in Padang as a whole
From Table 3, it is known that the numbers of respondents who are satisfied with the services of BPJS
in the PHCs (the indicator of satisfaction ≥ 90%, based
on Kepmenkes (Health Minister’s Decision) No. 129 Year 2008 is only 55% (83 respondents). In the same case, Wilantara (2015)[11] stated about the satisfaction of patients of BPJS on the first service in Lampung City, “It was found that only 32.5% of BPJS patients in PHCs who are satisfied and 55.2% of BPJS’ patients to doctors who were satisfied as well.”
1 2 3 4 5 6 7 8 9 10 11 12 13 14 15 16 17 18 19 20 21 22 23 24 25 26 27 28 29 30 31 32 33 34 35 36 37 38 39 40 41 42 43 44 45 46 47 48 49 50 51 52 53 54 55 56
1 2 3 4 5 6 7 8 9 10 11 12 13 14 15 16 17 18 19 20 21 22 23 24 25 26 27 28 29 30 31 32 33 34 35 36 37 38 39 40 41 42 43 44 45 46 47 48 49 50 51 52 53 54 55 56 health services at some dimensions, such as Reliability,
Responsiveness, Assurance, Empathy, and Tangible. On the other side, board insurance of BPJS has to give a good tool and infrastructure that include a training and development of skill to health workers in BPJS. Then, BPJS needs to give an understanding toward the member insurance of BPJS to adjust their expectation with PHC that has a function as a facilitator of health service on the first level.
Patient’s Satisfaction Based on five Indicators
The satisfaction of BPJS’ patients is assessed by using five indicators of patient’s satisfaction, namely,
Reliability, Responsiveness, Assurance, Empathy, and
Tangibles.
Reliability is the reliability of services, which services that are provided can be reliable to solve the health problems that are experienced by patients. In this study, the value of the patients' perception toward health officials’ services is lower than they expected. From the four attributes of satisfaction, none of them exceeded the value of patients’ satisfaction (the conformity value was less than 90%). Therefore, PHC should be able to improve the quality and patient satisfaction by
1. Establishing the procedures admission of patients quickly and accurately.
2. Check-up services, medications, and cares must be run quickly and accurately.
3. The schedule of hospital services must be carried out appropriately (a visited doctor, treatment, and rest).
4. The procedure of services has to be straightforward.
Responsiveness is a manifestation of the service quality of patients’ care in the form of quick responses of health officers in serving the patients. In this responsiveness, the average patients’ assessment of the quality services provided that the officers are less than they expected. From the three attributes of satisfaction, none of them exceeded the value of patients’ satisfaction (the conformity value is less than 90%). Therefore, PHC should be able to improve quality and patient satisfaction by
1. Improving the ability of doctors and nurses to be responsively resolving the patients’ complaints. 2. Health officers have to provide clear information. 3. Taking an action quickly when patients need.
Assurance or guarantee is the patient's belief in the service that is provided by health workers that are able to cure the illness. Supranto (2011)[10] stated that in the dimension of assurance, health workers must have knowledge, high skills, and be communicative
with patients. In this dimension, the average value of respondents' perceptions of the service performance of workers is lower than the patient's expectations. From the four of satisfaction attributes, one of them goes beyond patients’ satisfaction (conformity value is above 90%), the attribute “Polite and friendly service" has a value 90.2%. PHC can improve the quality and patients’ satisfaction by increasing the criteria, such as
1. Knowledge and ability of the doctors to make a diagnosis.
2. Skills of doctors, nurses, and other official services in working.
3. Security guarantee and trust to services.
Empathy is a service provided by health officer that contains the elements of attention to each patient and responsible for the safety and the comfort of patients. In this dimension, even the average perception of respondents on the performance of health workers is lower than their expectations. PHCs have to improve the quality and patient’s satisfaction by means of
1. Giving special attention to every patient.
2. Paying serious attention to the complaints of patients and their families.
3. Giving a service to all patients without looking on their social status.
Tangibles is the delivery of services, the physical elements that are involved in the health services, such as equipment, appearance of workers, and the room service: clean, neat, and tidy. In this dimension, the average perception of respondents on the performance of health workers is lower than the expectations. From the four of satisfaction attributes, one of them goes beyond the patient’s satisfaction score (grades suitability of 91.5%), which is “the neatness and cleanliness appearance of health workers”. PHC can improve services to this dimension by increasing
1. Cleanliness, neatness, and comfort of the room. 2. Structuring the exterior and interior of the room. 3. Completeness, readiness, and cleanliness of the
tools used.
Priority of Health Service Improvement
1 2 3 4 5 6 7 8 9 10 11 12 13 14 15 16 17 18 19 20 21 22 23 24 25 26 27 28 29 30 31 32 33 34 35 36 37 38 39 40 41 42 43 44 45 46 47 48 49 50 51 52 53 54 55 56 1
2 3 4 5 6 7 8 9 10 11 12 13 14 15 16 17 18 19 20 21 22 23 24 25 26 27 28 29 30 31 32 33 34 35 36 37 38 39 40 41 42 43 44 45 46 47 48 49 50 51 52 53 54 55 56
located in Quadrant I. These four attributes should be prioritized in order to improve the quality and patients’ satisfaction. The four attributes are “the quick action when patient needs, knowledge and capabilities of the doctors to make a diagnosis, a special attention to each patient as well as the completeness, readiness, and cleanliness of the tools used”. However, the PHC had successfully balanced the patients’ expectations on the attributes that were located in Quadrant II of Cartesian Diagram with seven attributes. Quadrant II refers to high expectations and high performance of officials’ services. These seven satisfaction attributes should be maintained in the future, namely,
1. Attribute No. 5. Doctors and Nurses have to act quickly in helping patient’s grievance.
2. Attribute No. 6. Officers provide clear information and it is easy to understand.
3. Attribute No. 10. Services are polite and friendly. 4. Attribute No. 11. Security guarantee and trust to
the services.
5. Attribute No. 14. Services to all patients regardless of social status and others.
6. Attribute No. 15. Cleanliness, neatness, and comfort of the room.
7. Attribute No. 18. Neatness and cleanliness performance of officers.
Quadrant III of Cartesian Diagram means the low expectations and the low performance of services. It means seven service attributes in this quadrant are not prioritized to be compared to the other quadrants. The interesting thing is none of the attributes of service fills the Quadrant IV (high performances, low expectations). This means that there is no excessive care of health workers.
Conclusions
On an average, based on the five dimensions of patients’ satisfaction, it was found that the numbers of respondents satisfied are 55% and dissatisfied are 45%. From the 18 attributes of quality service and patients’ satisfaction, there are two attributes that exceed the indicator of satisfaction (90%), namely, the polite and friendly service as well as tidiness and cleanliness of the officers, whereas 16 other attributes are not achieved.
Acknowledgements
The authors would like to acknowledge the Dean of School of Public Health Andalas University who has funded this research, the Head of Public Health Centers of Kuranji, Ambacang, and Belimbing, and staffs on facilitating researchers to collect the data and society who have helped the researchers during the process of data collection.
Financial support and sponsorship
Nil
Conflicts of interest
There are no conflicts of interest.
References
1. Lateef F. Patient expectations and the paradigm shift of care in
emergency medicine. J Emerg Trauma Shock 2011;4:163-67.
2. Berhane A, Enquselassie F. Patient expectations and their
satisfaction in the context of public hospitals. Patient prefer adherence 2016;10:1919-28.
3. Rao JK, Weinberger M, Kroenke K. Visit-speciic expectations
and patient-centered outcomes: a literature review. Arch Fam Med 2000;9:1148-55.
4. President of Indonesia [Internet]. Indonesian President Decree
Number 12 Year 2013 about National Health Insurance; 2013 Available from http://www.sjdih.depkeu.go.id/fulltext/2013/12TAHU N2013PERPRES.htm [Last accessed on 2016 Dec 6].
5. Social Security Organizing Agency of Indonesia – Health (BPJS
Kesehatan). BPJS Kesehatan Press Release. Available from https:// www.bpjs-kesehatan.go.id/[last accessed 2015 Dec 24].
6. Minister of Administrative and Bureaucratic Reforms of Indonesia
[Internet]. Minister of Administrative and Bureaucratic Reforms Decree Number 16 Year 2014 about Guidelines For Public Satisfaction Survey on The Implementation of Public Service; 2014 Available from http://
www.menpan.go.id/jdih/permen-kepmen/permenpan-rb/
ile/4336-permenpan-2014-no-016 [last accessed 2016 Dec 6].
7. Parasuraman A, Zheitmal VA, Berry LL. SERVQUAL: a multiple
item scale for measuring consumer perceptions of service quality. J Retailing 1998;64:12-40.
8. Minister of Health of Indonesia [Internet]. Minister of Health of
Indonesia Decree Number 129 Year 2008 about Minimum Service
Standards of Hospital; 2008. Available from http://pdk3mi.org/ile/
download/ [last accessed 2016 Dec 6].
9. Marshall G, Murdoch I. Service quality in consulting marketing
engineers. Int J Constr Mark 2001;3:41-9.[Last accessed on 2015 December 24].
10. Supranto J. The measurement of customers’ satisfaction level to raise the market share. Jakarta: Rhineka Cipta;2011.