IDENTIFICATION AND SEQUENCING BY NMR SPECTROSCOPY OF THE
CARBOHYDRATE MOIETY IN A SAPONIN FROM
Barringtonia asiatica
Rymond J. Rumampuk
Department of Chemistry, FKIP, Syiah Kuala University, Darussalam, Banda Aceh Indonesia
Husein H. Bahti, Soetijoso Soemitro, Ponis Tarigan
Department of Chemistry, Padjadjaran University, Bandung, Indonesia Anthony J. Herl, Lewis N. Mander
Research School of Chemistry, Australian National University, Canberra ACT, Australia
ABSTRACT
A trisaccharide chain in a saponin from the seeds of Barringtonia asiatica has been identified and sequenced as {[β-D-galactopyranosyl(1→3)- β-D-glucopyranosyl(1→2)]-β -D-glucuronopyranosyloxy} using a combination of homonuclear and heteronuclear correlation NMR spectroscopy. The 1H and 13C NMR signals of the sugar residues can be determined and distinguished from one other by use of the HMQC-TOCSY technique. Anomeric configurations were unambiguously assigned from the vicinal coupling constants 3JH-1,H-2 of the anomeric
protons. Inter-glycosidic linkage assignments were elucidated using HMBC.
Keyword: Barringtonia asiatica, carbohydrate, saponin, NMR
INTRODUCTION
Saponins are a group of natural products displaying a broad spectrum of biological activities1. They consist of three entities: an aglycone (sapogenin), sugars that are linked to the aglycone [1], and sometimes esters [2]. Structural determination of saponins is often challenging because of the large number of possible combinations of these three entities. Despite using very high fields, one dimensional 1H and 13C NMR spectra of saponins are often difficult to fully interpret [3], because of the overlap of resonances, especially in the (δ) 3.5 – 5 ppm regions of the 1H NMR spectra and the δ 60 – 80 ppm
(δ 90 – 112 ppm if the saponins have more than one sugar) regions in the 13C NMR spectra. Traditionally, the structural elucidation of saponins has required extensive derivatization and degradation studies [4]. For example, per-methylation using Hakomori’s method [5] followed by hydrolysis, allows identification of the methylated monosaccharides and thus the sugar present in the saponins.
Such studies although providing proof of the structure i.e. the inter-glycosidic linkages, consume large quantities of sample that in many cases is not available [6].
Furthermore such derivatization is not applicable to saponins possessing more than four sugar residues [7]. In addition, the degradation of saponins may give artefacts in the aglycone structure if the aglycone is sensitive to acid. Therefore, structural elucidation is better performed on the intact compound since the amounts of saponin isolated are often small, and to eliminate the possibility of artefact formation during degradation.
The basic problems in the study of the sugar moieties of saponins are determination of the number, sequence, and linkages of the sugar units; the anomeric configuration of glycosidic bonding, and the determination of the location of the sugar moiety on the aglycone. In a previous paper [8], we reported the isolation and structural elucidation of a new triterpenoid saponin (1)
from the seeds of Barringtonia asiatica. In
this saponin, the triterpene moiety was esterified at C-22 by a 2-methylbutyroyl residue and the sapogenin structure was assigned as 22-O
-(2-methylbutyroyloxy)-camelliagenin A (2).
In this paper, we wish to describe the application of multidimensional 1H and 13
121
Indonesian Journal of Chemistry
H
RO
O OH OH
O
(1)
(2) H
Gal Glc-A
Glc 1;3
1;2
22
3
R
EXPERIMENTAL SECTION
General Experimental Procedures.
The IR spectrum was determined using a Perkin-Elmer 1800 FTIR spectrophotometer. Optical rotation was measured in a 1 decimetre path cell with a Perkin-Elmer 241 polarimeter. The FABMS was measured in a 3-nitrobenzyl alcohol matrix on a VG Analytical ZAB-SEQ2 mass spectrometer. 1H and 13C NMR were recorded using a Varian INOVA instrument at 500 MHz (1H) and 125 MHz (13C). All of
the NMR data were measured in pyridine-d5
at 25 0C and chemical shifts are expressed in δ (ppm). 2D experiments were performed using standard INOVA programs.
Two step semi-preparative HPLC was performed on YMC-Pack ODS-AQ, 5μm 120Å 250 mm columns of 10 and 20 mm internal diameter, thermostatted at 40
0
C. The mobile phase was generated by
blending A: MeOH/THF/H2O/HOAc
(9/1/90/0.05), and B: MeOH/THF/HOAc (90/10/0.05) in a ratio of A:B 40:60 using a flow rate of 16 mL min-1 (step 1); and blending A: H2O/HOAc (100/0.05), B:
CH3CN/HOAc (100/0.05) in a ratio of A:B
55:45 using a flow rate of 4 mL min-1 (step 2). HPLC instrumentation consisted of two Waters 510 pumps, a Rheodyne 7125 injector fitted with a 4.4 mL sample loop, and a Waters 481 UV/visible detector fitted with a 2.3 mm path flow cell, monitoring absorbance at 210 nm. GC analysis was performed on an SGE 12 metre x 0.22mm i.d. BP-1 (100% polydimethylsiloxane) column with a 0.25 μm film in a Varian 3400 instrument. Carrier gas: helium, linear velocity 35 cm min-1; Split ratio: 50:1; Injector: 250 oC; FID: 325 oC; Column temperature program: 50 oC 2min hold then
10 oC min to 300 oC and 3 min hold.
Plant Material.
This plant was identified by Mr DJuandi of the Herbarium of Department of Biology, Bandung Institute of Technology, Indonesia, where a voucher specimen has been deposited.
Extraction and Isolation.
The crude saponin (4.35 g) was extracted as described previously [8,14], and subjected to RP-HPLC column using step 1 and 2 conditions respectively, to afford 1 (70 mg).
Compound 1:
White amorphous solid, 70 mg; [α]25
D –1.40 CH3OH; IR (KBr) v max 3427
(OH), 1709 (C=O), 1613 (C=C), 1100-1000 cm-1 (glycosidic linkages); 1H NMR (pyridine-d5, 500 MHz): aglycone δ 6.13
(1H, dd, J = 11.5; 5.5 Hz, H-22), 5.33 (1H,
br s, H-12), 4.58 (1H, br s, H-16, 3.66 (1H, d, J = 10.0 Hz, H-28), 3.49 (1H, d, J = 10.0
Hz, H-28), 3.25 (1H, dd, J = 11.0; 3.5 Hz,
H-3), 3.01 (1H, dd, J = 14.0; 3.5 Hz, H-18),
1.85; 1.25; 1.22; 1.07; 1.02; 0.84; 0.77 (each 3H, s, H3-27, 30, 23, 24, 29, 26, 25), other NMR data see the preceding paper [8]; sugars (1H and 13C NMR data see
Table 1), FABMS m/z 1081 [M+Na+H]+ and
1057 [M-1]–, anal. C 57.0%, H 7.6% calcd
for C53H86O21 + 2CH3OH + H2O, C 57.0%,
H 8.3%.
Degradation Experiments:
15.00, 16.85 min
RESULT AND DISCUSSION
The identity of the sugars present in
1 was established by treatment of the latter
with anhydrous methanolic HCl followed by per-trimethylsilylation. The GC profile of the products was compared with reference sugars treated under the same conditions and this indicated that galactose, D-glucose and D-glucuronic acid were present in approximately equal amounts. The D- configuration has been assumed for these sugars in keeping with Massiot and Lavaud’s assertion [2], “The enantiomers of these sugars are not found in plants, a fact used as a clue in the determination of these sugars”.
The first step in identifying the number of sugar residues present in 1
involved beginning with the anomeric proton and carbon resonances. The number of sugars can usually be determined by counting both the number of anomeric protons (δ 4.5 – 6.5 ppm) and carbons (δ 90 – 112 ppm) present in the 1-dimensional 1H and 13C NMR spectra [9]. In
this manner, one unit each of D-galactose, D-glucose and D-glucuronic acid as a carbohydrate trisaccharide [individual sugars are indicated by bold capital letters (A – C)] were identified in 1 based on their
characteristic proton and carbon signals (Table 1). Moreover, the presence of carbonyl resonance at δ 170.0 ppm and two hydroxymethyl resonances at δ 61.9 and 63.4 ppm (Table 1) further confirmed that the trisaccharide consists of an acid and two hexose sugars.
5.33 ppm, br s) in the anomeric region has been previously assigned to the vinylic proton (H-12) of the aglycone part of 1 [8].
Due to severe overlap in the δ 3.5 – 5 ppm regions of the 1H NMR spectrum of the sugar moiety of 1, only the H-1,H-2
connectivities from the anomeric protons can be unambiguously identified from a DQCOSY spectrum. Thus the full assignment of the spin systems of each individual sugar of 1 was derived from an
HMQC-TOCSY experiment [8]. The HMQC part leads to direct (one-bond) 1H – 13C correlations [10,11], and the TOCSY part was used to obtain correlations for all of the protons of an isolated spin network [12]. The application of this experiment to the three monosaccharides present in 1 are
discussed below. All NMR data are presented in Table 1 and the relayed correlations observed in the HMQC-TOCSY spectrum are presented in Table 2.
Residue A.___ The anomeric proton and carbon of residue-A show four cross-peaks
in the HMQC-TOCSY spectrum (Table 2) indicating the correlations between four carbons at δ 78.5, 77.7, 76.3, 72.4 ppm, which were later assigned to C-3, C-5, C-2, and C-4 respectively, with the anomeric proton at δ 5.64 ppm (1H, d, 7.5 Hz), and the correlations between four protons at δ
4.22, 4.15, 4.05, 3.80 ppm with the anomeric carbon at δ 103.8 ppm. Those protons were assigned to H-3, H-4, H-2, and H-5 respectively. The four cross-peaks of the anomeric proton indicated the presence of a large vicinal coupling among ring protons due to a trans diaxial
orentation, suggesting a gluco
configuration.
Table 1. 1H and 13C NMR data (δ in ppm) for sugars of 1. The 13C chemical shifts of boundary
carbons in subtituted residues are italicied.
*overlapping signals; a : may be interchangeable
Glu-A Glu Gal H and C
Position
s δC δH δC δH δC δH
1 105.1 4.92 103.8 5.64 105.1 5.31
2 78.9 4.42 76.3 4.05 72.9 4.48*
3 87.7 4.34 78.5 4.22 75.3 4.14
4 71.8 4.46a 72.4 4.15 70.1 4.45
a
5 77.3 4.48* 77.7 3.80 77.3 4.16
123
Indonesian Journal of Chemistry
Table 2. Relayed correlations of the sugar moiety of 1. One-bond correlations are shown bold.
Residue-3A
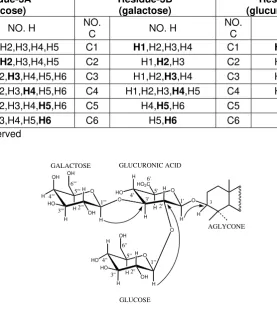
Figure 1. Key HMBC correlations for the trisaccharide moiety of 1.
Further correlation occurred between the methylenic protons AH-6 (A
stands for residue-A, H-6 for the methylenic
group at position 6) at δ 4.30 and 4.44 ppm with C-5, C-4, and C-3, as well as H-5, H-4, H-3 (Table 2), indicated that this residue was a hexose sugar. Meanwhile, the 3
J H-1,H-2 for this residue was 7.5 Hz, indicating a β
-anomeric configuration. Therefore,
residue-A was assigned as β
-glucopyranose.Residue B. __ In the
HMQC-TOCSY spectrum (Table 2), the anomeric proton and carbon of residue-B show only
three cross-peaks, thus indicating the existence of small 3
JH-4,H-5 value and
suggesting a galacto configuration.
Moreover, the correlations occurred between the methylenic protons BH-6 at δ
4.33 and 4.42 ppm with BH-5, then BH-5
with BH-4 (Table 2), indicated that this
residue was a hexose sugar. Based on its
3
JH-1,H-2 of 8.0 Hz, this residue also had a β
-anomeric configuration. Thus, residue-B
was assigned as β-galactopyranose.
peaks through the anomeric proton and carbon in its 2D HMQC-TOCSY spectrum were observed (Table 2). In this case, the full assignment of this residue was identified by comparing its NMR data with that in the literature [13,14], which indicated a glucuronopyranosidic acid residue. Moreover, the 3
JH-1,H-2 of 7.5 Hz of this
residue again supports the β configuration and this residue was assigned as β -glucuronopyranosidic acid.
Determination of linkages.__ The final step
1.
2.
4.
5.
6.
7.
8.
9.
10.
11.
12.
13.
14. anomeric protons are shown in Figure 1,
and the inter-residue correlations are easily identified since 1H and 13C resonances of each sugar moiety have been unambiguously assigned previously. The anomeric proton of residue-A (glucose) at δ
5.64 ppm shows a correlation to C-2 (δ 78.9 ppm) of residue-C (glucuronic acid), and
the anomeric proton of residue-B
(galactose) at δ 5.31 ppm shows a
correlation to C-3 (δ 87.7 ppm) of
residue-C, thus identifying a branched trisaccharide
segment with glucose and galactose as two terminal sugars. This segment was further
determined to be {[β
-D-galacto-pyranosyl(1→3)- β-D-glucopyranosyl (1→2)]-β-D-glucurono-pyranosyloxy} as shown in Figure 1. This trisaccharide moiety is further linked to C-3 of the aglycone as indicated by a cross-peak between the anomeric proton of residue-C
at δ 4.92 ppm with C-3 (δ 89.4 ppm) of
22-O-(2-methylbutyroyloxy)-camelliagenin A
aglycone (Figure 1).
ACKNOWLEDGEMENT.
This work was supported by the Research School of Chemistry (RSC), Australian National University (ANU), Canberra ACT 0200, Australia. The authors are grateful to Mr Chris Blake of the ANU University NMR Centre who ran all of the NMR spectra, to Mrs Jenny Rothschild of the RSC Mass Spectroscopy Unit and to the RSC Microanalytical Unit for their assistance
REFERENCES
Hostettmann, K. and Marston, A.
Chemistry and Pharmacology of Natural Products : Saponins, (Eds) Cambridge
University Press, 1995, pp 232-304. Massiot, G. and Lavaud, C. Structural elucidation of saponins, in Studies in Natural Products Chemistry, ed.
Atta-ur-Rahman, 1995, 15, 187-224.
Bonnet, P.A.; Roumestan, C.
Carbohydr. Res. 1997, 302, 67-78.
Chen, S. and Snyder, J.K. General strategy for the structure determination of saponins : Molluscicidal saponins from Allium vineale, in Bioactive Natural Products. Detection, isolation, and structural determination, ed. Colegate,
S.M. and Molyneux, R.J. CRC Press, Boca Raton, Ann Arbor, London, Tokyo, 1993, 349-399.
Hakomori, S. J. Biochem. (Tokyo),
1964, 55, 205-208.
Qiu, S.X.; Cordell, G.A.; Kumar, B.R.; Rao, Y.N.; Ramesh, M.; Kokate, C.; Rao, A.V.N.A. Phytochemistry. 1999,
50, 485-491.
Mahato, S.B. and Nandy, A.K.
Phytochemistry. 1991, 30, 1357-1390.
Rumampuk, R.J.; Tarigan, P.; Herlt, A.J.; Mander, L.N. Presented at the International Seminar on Natural Products Chemistry and Utilization of Natural Resources. Universitas Indonesia–UNESCO, Depok, Indonesia, June 5-7, 2001.
Agrawal, P.K. Phytochemistry. 1992,
31, 3307-3330.
Bax, A. and Subramanian, S. J. Magn. Reson. 1986, 67, 565-570.
Lerner, L. and Bax, A. J. Magn. Reson.
1986, 67, 375-380.
Davis, D.G. and Bax, A. J. Am. Chem. Soc. 1985, 107, 2820-2821.
Ohtani, K.; Mavi, S.; Hostetmann, K.
Phytochemistry. 1993, 33, 83-86.
Mander, L.N.; Herlt, A.J.; Pongoh, E.; Rumampuk, R.J.; Tarigan, P. J. Nat. Prod. (submitted for publication).