151
Analysis on Allowable Catch Policy for Fisheries Resource Utilization
in Pasuruan, East Java
Wildan Alfarizi
1, Guntur
2, Amin Setyo Leksono
31Environmental Resources Management & Development Studies, Graduate Program Brawijaya University 2Faculty of Fisheries and Perikanan dan Ilmu Kelautan, Brawijaya University
3Faculty of Mathematics and Natural Science, Brawijaya University
Abstract
Lack of knowledge and information about fisheries activities, particularly the importance of sustainable management for marine fisheries (catching) is the underlying reason why fish resource potential has yet been managed and utilized well. The study is conducted to determine the number of sustainable fishing and the total allowable catches in Pasuruan, East Java. It also aims at describing status of fishery resources utilization and developing strategies for fishery resources management in Pasuruan, East Java. Walter-hilbron method is used to analyze model prediction of the stock and the status of fisheries utilization. Schaefer and Fox methods are used to calculate Maximum Sustainable Yiled (MSY) and Total Allowable Catch (TAC). The analysis was applied using fisheries data from 2004 to 2014. The strategies being developed and analysis towards importance of the strategy are analyzed using Focus Group Discussion (FGD). Based on Fox model, the MSY is 9,419.86 tons and TAC is 7,535.89. Based on the data, fisheries utilization in Pasuruan, East Java is categorized as overexploited. Most respondents in the Focus Group Discussion (81.74%) agree that strategies of fisheries resources utilization in Pasuruan, East Java is the suitable strategy for fishing ground-based fishing operation as well as fishing season management.
Keywords: management strategies, overfishing, sustainability, the status of utilization
INTRODUCTION
Indonesia has abundant natural resources. Unfortunately, such potentials have yet been maintained properly, responsibly or sustainably for the sake of Indonesian citizens. Lack of knowledge and information about the importance of sustainable and long-lasting utilization of natural resources are the causes of poor management of natural resources [1]. Even though Indonesia has ample natural resources, there has yet been a balance between aquatic resources from one place to another or between one type of aquatic resource and another. Overfishing is frequent phenomenon in Java Sea and Malaka Strait, while aquatic resource utilization in the eastern part of Indonesia has yet been maximized or below sustainable potentials level [2].
Approximately 208.35 km2 areas in Pasuruan consist of water with sustainable yield of ± 27,000 tons per year. Careful managememnt of aquatic resource in the area is of necessity. Accurate information about fish resource is pivotal for fisheries development planner especially fisheries development. Quantitative
Writer’s Correspondence:
Wildan Alfarizi
Email : [email protected] Alamat : Faculty of Fisheries and Marine Science
Brawijaya University.
information such as estimated potentials of fisheries resource is determined by several types of basic information such as survey from research ships or information obtained from periodic monitoring system especially catch–effort data, catching season and habitat of particular types of fish in their respective waters [3].
Fisheries resource in Pasuruan has huge potentials as it may support local economics. In order to realize the idea, accurate scientific information as consideration in developing plans about effective, efficient and sustainable fisheries resource maintenance and utilization in Pasuruan is needed. Purpose of the study is to find out the number of sustainable fishing and the total allowable catches in Pasuruan, East Java. Besides that, it also describes status of fishery resources utilization and developing strategies for fishery resources management and control in Pasuruan, East Java.
METHODOLOGY
152
Total Allowable Catch Analysis (Alfarizi, et al.)
strategy and evaluates the strategy through focus group discussions.
Data Collection Method
There are three approaches to determine policy for allowable catch in fisheries resources untilization in Pasuruan that is taking catch effort data from 2004 – 2014 from East Java’s fisheries statistical reports.
The goal of collecting catch effort data is to find out Maximum Sustainable Yield (MSY) and Total Allowable Catch (TAC). Schaefer and Fox method is used for MSY and TAC calculation. The following procedure is to calculate fishing equipment conversion by making catch and effort tables. The first table consists of information from the statistical data from Pasuruan from 2004 to 2014 [4]. On the other with Relative Fishing Power (RFP).
The process is continued by counting potential sustainable reserves using Walter-Hilborn method. The method is used to describe fisheries resource utilization status in Pasuruan. When the status of fisheries resource utilization has been determined, it can be used for fishing equipment conversion using Relative Fishing Power (RFP). The result of the three approaches can be used to develop strategies for fisheries resources amanagement and control in Pasuruan, East Java.
Developing alternative strategy and need analysis from several alternatives is carried out based on:
Identifying fisheries and non-fisheries potential capacity in Pasuruan
Identifying issues related to utilization, problems as well as potentials for fisheries resources in Pasuruan through observation and interview (distributing questionnaires).
Focus Group Discussion (FGD) with stakeholders working in fisheries or non-fisheries to analyze importance of alternative strategies being developed.
Data Analysis
Fishing equipment used as standard to calculate fisheries resource potentials for each species of fish is selected based on which fishing
equipment is the most dominant one to catch certain species of fish.
“Tembang” fish in Pasuruan is exploited using
gill net, “payang” and “bagan tancap.” Fishing management model refers to assumption that fishing equipment should be transferred into a standardized unit. In other words, when fishing equipment is converted into one unit of measurement, it is considered as standardized fishing equipment. The conversion method used the following equation:
towards total production of fish 𝑌𝑓𝑖𝑠ℎ = Average catch by fishing equipment
𝑓𝑖𝑖=1𝑛 = Average effort from standardized fishing
equipmnet (trip)
𝑅𝐹𝑃 =Y/f Y/ fii=1n
standardized equipment
where:
RFP = Type of fishing equipment
conversion index out using holistic approach or production method surplus that is Schaefer (1954) and Fox (1970)’s models to decide the best fit model that represents the actual level of tuna exploitation. Maximum Sustainable Yield Effort and Maximum Sustainable Yield can be obtained by the
Ymsy = Maximum Sustainable Yield
(Sustainable Yield Potentials) fmsy = Sustainable Yield Efforts
153
𝑌 = 𝑒𝑥𝑝𝑐𝑓−𝑏𝑓 (1)
𝑓𝑚𝑠𝑦 =𝑑1dan𝑌𝑚𝑠𝑦 =1
𝑑(𝑐 − 1) (2)
where:
c = Fox’s Intercept d = Fox’s Slope
In order to calculate utilization level of fisheries resources, the following formula is used:
JTB = 80% x Ymsy
Sustainable Reserve Potentials Prediction and Current Reserve Potentials
Based on Walter and Hilborn (1976) biomass from year t + 1, Bt + 1 can be predicted based on Bt added by growth of biomass for a year and subtracted by amount of biomass in the year and subtracted by amount of biomass produced by exploitation of efforts (f).
In general, the study is divided into two processes of data analysis. The first process [A] is to decide fisheries resource utilization status in Pasuruan (Picture 1), and the second process [B] is to develop strategy based on FGD and
respondent’s feedback using Likert scale (Picture 2).
Picture 1.Flow chart of predicting reserve process and fisheries resource utilization status in Pasuruan that involves calculating fishing efforts, fishing equipment conversion, sustainable potential reserves prediction and calculating total allowable catch.
Focus Group Discussion (FGD)
FGD is a type of discussion of which purpose is to obtain information about expectation, need, perspective, trust and experience participants need. In the study, participants refer to fisheries and non-fisheries stakeholders in Pasuruan. FGD
facilitates decision maker in making decision to understand attitude, belief, expression and keywords participants use related to theme of the study. In other words, FGD reveals some
reasons behind participant’s response.
Picture2. Flow Chart of developing alternative strategy for fishing resources utilization control FGD as well as analysis/ response towards the alternative strategy using Likert scale.
FGD Results Analysis
Information from FGD from three topics on the table is analyzed using the following principles:
1) Coding towards attitude and opinions of FGD participants who have similarities related to FGD topic,
2) Similar attitude towards topics of FGD, 3) Similar terms used including different opinion
towards term used by participants to understand each of the topic,
4) Making categorization towards attitude and opinion of FGD participants related to developing strategy for resource utilization control,
5) Analysis of each strategy for fisheries resource utilization in Pasuruan 6) Making report about FGD
Scale of Interest Measurement
Likert scale in this context is used to measure
154
Total Allowable Catch Analysis (Alfarizi, et al.)
developed based on type of data produced, which is ordinal data.
Analysis towards likert scale in the study is based on the strategy being developed. Analysis towards the result of Likert scale will use weight value table (table 1) and percentage table (table 2).
Table 1. Weight Value
Weight Value Scale
A 5 Strongly Agree
B 4 Agree
C 3 Neutral
D 2 Disagree
E 1 Strongly Disagree
Table 2. Percentage
Response Description
0% - 19.99% Strongly (Disagree, Very Poor) 20% - 39.99% Disagree or Poor
40% - 59.99% Neutral or Fair 60% - 79.99% Agree, Good, Like
80% - 100% Strongly (Agree, Very Good, Really Like)
Data from respondent’s response are then calculated by multiplying each point of response with the weight that has been determined based on the weight value table (table 3), using the following equations:
Total Score = ( Response x Strongly Agree Weight Value) + ( Response x Agree Weight Value) + ( Response x Neutral Weight Value) + ( Response x Disagree Weight Value) + ( Response x Strongly Disagree Weight Value)
In order to get interpretation result, one should find out the highest score (X) and the lowest score (Y) using the following formula:
Y = Highest score in Likert scale x total respondents (The highest score is 5) "Refer to Weight Value"
X = Lowest Score in Likert Scale x total respondents (The lowest score is 1) "Refer to Weight Value"
Therefore, analysis of respondent’s interpretation towards strategy to control marine fisheries resources utilization in Pasuruan equals to the result of Index % formula below and percentage of scores as conclusion using percentages in Table 1.
Index % = Total scoreY × 100
FINDINGS AND DISCUSSIONS Catching Production
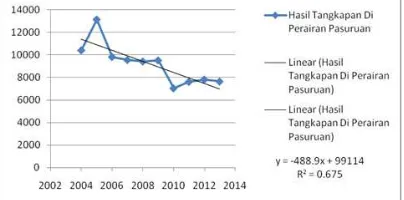
Catching production of fish in Pasuruan has been changing from 2004 to 2013. The highest production is in 2005 and the total catch is 13,139.3 tons. On the other hand, the lowest production is in 2010 with the total catch of 7,037.3 tons. In 2006, production of fish decreased 70% and came back up in 2010 by 61% and increased by 15% again in 2011. In 2013, it decreases up to 36% (Picture 3).
Picture 3.Production of Fish in Pasuruan
Based on calculation of fishing equipment conversion in Appendix 4 and Figure 4, it can be
seen that “payang” (a type of fishing equipment)
has the highest percentage of catch (43%) compared to other fishing equipment. Payang is established as standardized fishing equipment since its total CpUE is 0.018538 ton/trip. Since RFP of “payang” is 1, then RFP score of “bagan tancap” (a type of fishing equipment) is 1.97172 with 0.51 ratios that means the ratio equals one unit of “payang.” Since RFP of “payang” against
“insang hanyut” net (a type of fishing equipment)
is 1.80512, it means one unit of “paying” equals
to 0.55 unit of “insang hanyut” net in one fishing
trip yang artinya satu unit payang setara dengan 0,55. Furthermore, RFP of one unit of “payang”
against “insang tetap” net (a type of fishing
equipment) is 1.25050 that means one unit of payang equals to 0.8 unit of “insang tetap” net in one fishing trip. Meanwhile, RFP of one unit of
“paying” against “klitik” net is 0.627418 which
means one unit of “paying” equals to 1.59 unit of
155
Picture 4.Proportion of Four Type of Fishing Equipment in Pasuruan
Schaefer’s Model
Prediction for Maximum Sustainable Yield (MSY) and Total Allowable Catch (TAC) in one area can be used using Schaefer (1959)’s and Fox (1970)’s model. In this case, making prediction of fishing equipment dan total amount of catch in Pasuruan is pivotal since it is related to estimation from both models.
Based on output for Schaefer’s model (Figure 5) that is obtained from estimation result, it is found out that Multiple R score is 0.7596. It means correlation between effort and CpUE is pretty high. R Square isr 0.5769 that 58% of change or variance from effort can be explained based on CpUE change or variance, while the remaining 42% is explained by other variable. Based on linear regression analysis for Schaefer model, a or intercept is 0.03361 and b or slope is -2.8737 where a and b are constant in linear equation.
Picture 5. Correlation between Fishing Equipment and Schaefer’s Fishing Equipment Trip
Through comparison between intercept or “a” and x variable (a/2b), where “a” is 0.03361 and b is -2.8737, fMSY score is 584,929.94/trip. MSY is calculated using (a^2/4b) where “a” is 0.03361 times 0.03361 and then compared to four times
of “b.” The YMSY result based on the formula is
9,832.42 tons. YJTB score obtained from 80% of YMSY is 7,865.92 tons, while fJTB is obtained based on Y=af-bf² and the result (fJTB) is 323,341.31/trip.
Fox’s Model
Output for Fox’s model (Figure 6) is obtained
based on estimation of Fox’s model potentials
that results in Multiple R score of 0,78850. It means there is correlation between efforts and Ln CpuE. R Square (correlational coefficient) is 0.62174 with adjusted R Square of 0.80709. Correlational coefficient score of 0.62174 means 62% change or variance of effort can be explained by Ln CpUE, while the remaining 48% is explained by other variables. R Square functions to analyze the regression model since it can explain its correlation with other variables in percentages. Based on regression analysis using
Fox’s model, “c” or intercept is -3.13302 and “d” or slope is -1.70219 where “c” and “d” are constant in linear equation.
FMSY is obtained using (1/d). “D” is -1.70219
where score of “d” is slope of regression. Based on the comparison between one and -1.70219, the catch is 587,478.99/trip that indicates the
number of “paying” as standardized fishing trip in
optimum condition (fMSY). To obtain sustainable maximum yield (YMSY), the formula used is (fMSY)*exp(c-1). The result is 9.419,86 tons. TAC is obtained based on 80% of YMSY that is 7,535.89 tons, while fJTB is obtained using Y=af-bf² and the result of the equation is 323,341.31 /trip.
Picture 6. Correlation between Fishing Trip and Fox’s Model Fishing Trip
Sustainable Reserve Potentials (Be) of Fish in Pasuruan
156
Total Allowable Catch Analysis (Alfarizi, et al.)
closer to the real situation. The model is also known as non-equilibrium state model (Table 3).
Table 3. Non-equilibrium state Model Score Variable Walter-Hilborn
r = intrinsic growth of population rate k = carring capacity
q = catchability coeficien
Be = Sustainable reserve potentials
The scores are the result of calculation using Walter-Hilborn’s model. Intercept score dan X variable 1, 2 are the result of summary output. R, k, q scores can only be obtained from Walter-Hilborn’s model based on b0, b1 and b2 scores that equal to X variable 1,2.
Output for Walter-Hiborn’s model is estimation of Walter-Hilborn’s model in Appendix 8a. Th output is the basis for Multiple R score from linear regression in Appendix 8b that is 0.980145 where R Square is 0.960684 and R Square adjuster is 0.959451. Correlational coefficient score is 0.960684 that means 96% of change or variance can be explained using X1 and X2 variables’ change or varianvce while the remaining 4% is explained using other variables. When R Square is closer to 1, regression model can explain correlation between dependent variable (X) and independent variable (Y) more accurately that is stated in percentage compared to Schaefer and Fox ‘s model or Walter-Hilborn’s model of which prediction is better than Schaefer and Fox ‘s model.
Annual growth rate (r) is 102.50 obtained using Walter-Hilborn’s regression model. Carring capacity (k) is obtained using k=(b0)/(b1*b2) where b0 is 102.50/year, b1 is 2951.9 and b2 is 2.02622. Therefore, the annual growth rate of fish is 7.0359 while sustainable potential of fish is half of the carring capacitythat is 3,5179.
Level of fish utilization is the average of effort in the last five years divided by fMSY. The result of both calculations are multiplied by 100 and the level of fish utilization is 86%. Based on the level of fish utilization, status of fisheries utilization in Pasuruan can be categorized as fully exploited which means the resources in the area have exploited very close to MSY score and increasing amount of catch is highly unrecommended.
Sustainable Potentials Calculation and Total Allowable Catch
Sustainable potential is calculated using Schaefer, Fox and Walter-Hilborn’s method described in Tabel 4.
Table 4.Sustainable Potentials Data
No. Schaefer Fox Walter-hilborn MSY 9.830,9 9.419 31154.84 JTB 7.864,7 7.535 4.34404E-10
The goal of analysis based on information on Table 4 is to find out amount of sustainable potentials and total allowable catch in Pasuruan. The next procedure is to get information about utilization status by making comparison between data analysis of Table 5 and Tabel 6. The result is as follow:
Tabel 5. Comparison of Schaefer’s Data Analysis
Schaefer’s
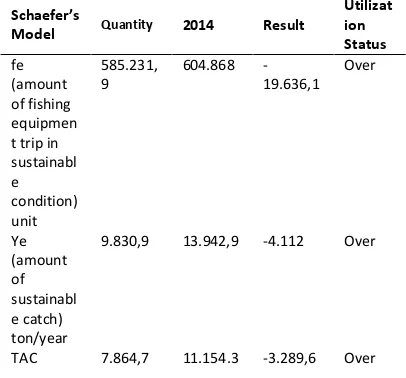
Schaefer’s model, fMSY (amount of sustainable fishing equipment) is 585,231.9 trip or smaller than the 2014 data of 604,868 trip. Based on fMSY, it can be concluded that fishing equipment utilization has exceeded the standard or overly exploited. YMSY (amount of sustainable catch) is 9,830.9 tons/year or lower than the 2014 data of 13,942.9 tons/year. Based on the data (yMSY), it can be concluded that fisheries utilization (catching) is overly exploited.
TAC is 7,864.7 or smaller than the 2014 data of 11,154.3 that means overfishing has been taken place in Pasuruan.
Table 6. Comparison of Fox’s Data Analysis Fox’s
Model
157 equipment utilization has exceeded the standard or overly exploited. YMSY (amount of sustainable catch) is 9.419 tons/year or smaller than the 2014 data of 13,942.9 tons/year. Based on the data (yMSY), it can be concluded that fisheries utilization (catching) is overly exploited. FurthermoreTAC is 7,535 or smaller than the 2014 data of 11,154.3 that means overfishing has been taken place in Pasuruan.
There has been catching equipment overcapacity that results in over fishing as mentioned in Table 12 and Table 13 about
Schaefer’s and Fox’s data analysis. Thus, developing strategy to manage and control fishing resources utilization in Pasuruan is pivotal. Minimum Sustainable Yiled (MSY) and Total Allowable Catch (CAT) should be the reference to carry out fishing utilization in Pasuruan.
Strategy for Fisheries Resource Utilization Control
Based on identification and analysis towards reserve prediction and status of marine fisheries resource utilization in Pasuruan, the researchers develop strategy to control fisheries resource utilization. The strategy is developed based on several issues listed as the results of interviews, filed observations and FGD.
FGD respondents are three groups the researchers assume have represented stakeholders in Pasuruan. The researchers believe that these respondents influence the growth of fishing industry in the area especially fisheries field. The first group consists of fishermen that represent people carrying out
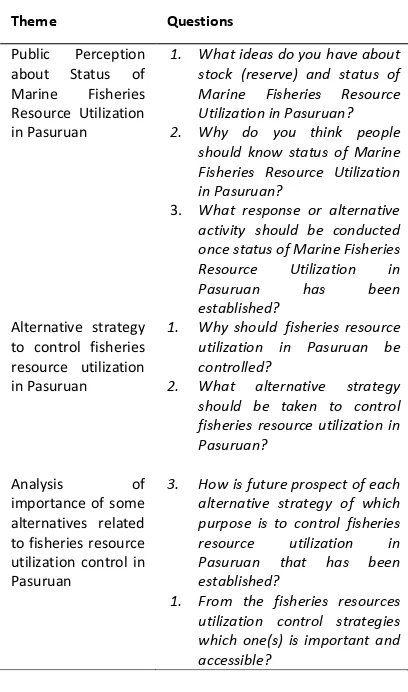
fishing activity. The second group is government officers who have authorization towards any policy and decision related to fishing industry and activities in Pasuruan. The third group consists of other fishing community groups and academics. The questions are related to the strategy being developed within the study and they refere to a set of guideline established prior to FGD. The questions are described in Table 7.
Table 7. Theme and Important Questions in Strategy
1. What ideas do you have about stock (reserve) and status of Marine Fisheries Resource Utilization in Pasuruan? 2. Why do you think people
should know status of Marine Fisheries Resource Utilization in Pasuruan?
3. What response or alternative activity should be conducted once status of Marine Fisheries Resource Utilization in Pasuruan has been established?
Alternative strategy to control fisheries resource utilization in Pasuruan
1. Why should fisheries resource utilization in Pasuruan be controlled?
2. What alternative strategy should be taken to control fisheries resource utilization in Pasuruan?
Analysis of importance of some alternatives related to fisheries resource utilization control in Pasuruan
3. How is future prospect of each alternative strategy of which purpose is to control fisheries resource utilization in Pasuruan that has been established?
1. From the fisheries resources utilization control strategies which one(s) is important and accessible?
Based on the identification, the strategies to control marine fisheries resource utilization in Pasuruan are as follow:
1. Establish fishing zone for fishermen who catch overly caught types of fish in order to prevent overfishing,
2. Recommend open-close system for particular season to buy some time for overly caught fish to lay their eggs and reproduce,
158
Total Allowable Catch Analysis (Alfarizi, et al.)
4. Renew marine production information that describes real life condition of fisheries resource as initial data to calculate marine fisheries reserve and utilization in Pasuruan.
The strategies are the analyzed to get response from the respondents to see the importance and significance of each strategy as described in Picture 7
Picture 7. Net Graph of Respondent Groups’ Opinions towards the Importance of Alternative Strategy for Marine Fisheries Resources Utilization in Pasuruan
Scale of Interest Measurement
Likert scale is used to measure respondents’ agreement or disagreement towards the alternative strategy being developed. Their responses start from [1] strongly disagree; [2] disagree; [3] neutral; [4] agree; to [5] strongly agree.
Likert scale is used to measure respondents’
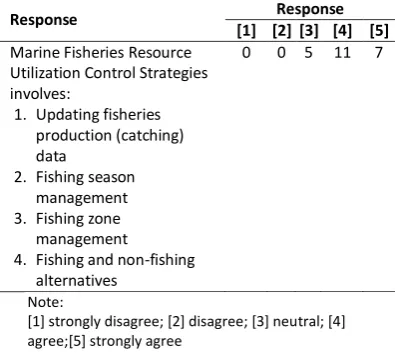
opinion in FGD. Besides Likert scale, weight value table is also used to measure respondents’ opinion. Calculation of FGD result percentage towards the entire alternative strategies is presented in Table 8.
Total Score = (7 x 5) + (11 x 4) + (5 x 3) + (0 x 2) + (0 x 1)= 94
Based on the total score, the interpretation is calculated as follow:
Y = 5 x 23 = 115
X = 1 x 23 = 23
Thus, respondents’ interpretations towards the strategy to control fisheries resource utilization are:
𝐼𝑛𝑑𝑒𝑥 % = 𝑇𝑜𝑡𝑎𝑙 𝑠𝑐𝑜𝑟𝑒𝑌 × 100
𝐼𝑛𝑑𝑒𝑥 % = 115 × 10094
𝐼𝑛𝑑𝑒𝑥 % = 81.74 (strongly agree)
The formula above shows that most of the
respondents agree with the alternative
strategies. The percentage is 81.75%. As a conclusion, the strategies can be implemented and function as reference for sustainable fisheries resource management in Pasuruan.
Table 8. Percentage of the Entire Alternative Strategies
Response Response
[1] [2] [3] [4] [5] Marine Fisheries Resource
Utilization Control Strategies involves:
1. Updating fisheries production (catching) data
2. Fishing season management 3. Fishing zone
management
4. Fishing and non-fishing alternatives
0 0 5 11 7
Note:
[1] strongly disagree; [2] disagree; [3] neutral; [4] agree;[5] strongly agree
CONCLUSION
Based on Fox’s model about analysis of total
catch (Y), MSY is 9,419.86 tons and TAC is 7,535.89 tons. In terms of fishing equipment, MSY is 578,747.99 trips and fTAC is 219,614.75 trips. Based on MSY, TAC and comparison between the data for 10 years and the 2014 data, overfishing has taken place in Pasuruan. As the consequence, MSY and TAC should be the reference prior to carrying out fishing activities. In other words, establishment of MSY and TAC is the strategy to control fisheries resources utilization. Supervision on the amount of catch and types of fishing equipment should also be conducted. One of the methods is to give limitation for fishing hours and areas. 81.74% of respondents of FGD give their approval towards the developed strategies.
ACKNOWLEDGMENT
159
REFERENCES
[1]. Listriana, K. 2014. Mengembangkan Papua
Yang Kaya. Kementrian Kelautan Dan
Perikanan.
[2]. Adisanjaya,N. 2011. Potensi, Produksi Sumberdaya Ikan Di Perairan Laut Indonesia Dan Permasalahannya.
[3]. Purnomo, H. 2002. Analisis Potensi dan Permasalahan Sumberdaya Ikan Pelagis Kecil
Di Perairan Utara Jawa Tengah. Diponogoro
University. Semarang.
[4]. Department of Fisheries and Marine Resources. 2014. Potensi Perikanan