Experiential Learning using QlikView
Decatur, IL 62522, United States
Abstract
This paper reports on the use of QlikView business intelligence software for use in a Business Intelligence (BI) course within an undergraduate information systems program. The course provides students with concepts related to data warehousing, data mining, visualizations, and software tools to provide business intelligence solutions for decision making. The goal of the course is to balance both the technical and business skills students require when using business intelligence systems. Specific use of the software QlikView is outlined through an experiential project whereby students obtain, model, analyze, and interpret publicly accessible airline data. QlikView is a leading business intelligence software package that allows users to import data from a variety of sources to create visualization-based dashboards for reporting and analysis. The use of QlikView in this course addresses common challenges with using commercially available software in the classroom.
Keywords: business intelligence, data warehousing, teaching, qlikview, experiential education
1. INTRODUCTION
As technology advances and electronic data become more prevalent, organizations are accumulating data in vast quantities through a variety of means. As this electronic data grows in volume (quantity), variety (varying attributes), and velocity (pace), organizations struggle to not only maintain the data, but to make strategic decisions grounded in their electronic archives. Managers and executives are scrutinized for their decisions and fact-based data supports those decisions as opposed to “going with the gut.” Business leaders need Business Intelligence (BI) for quick-and-easy access to information, to make timely and accurate decisions (Mrdalj, 2007). As BI becomes more pervasive in business, I.S. students require a different skill set. They need to understand how data is stored and be able to access and analyze it using a variety of tools (Watson, 2008). Business Intelligence makes
sense of transactional and operational data while leveraging external data sources to make informed decisions about the enterprise, thereby gaining a competitive advantage through means such as increased efficiency, improved customer service, and identification of new market opportunities.
improved teaching resources continues to be a challenge. Professors cite the need for real-world business problems and not just rote tutorials (Wixom et al., 2014). In addition, the configuration, training, and maintenance of these systems are also time consuming from the perspective of the faculty and consequently time consuming for students to become knowledgeable enough to be productive given an infrastructure-heavy, enterprise-level BI software package.
This paper presents the use of an emerging and accessible Business Intelligence software tool, QlikView, as a means of practicing fundamental and analytical skills for information systems majors likely to assume a role in system/business analysis or data management through an active learning environment that combines both theory and practice. According to QlikView’s website in August, 2014, the company boasts a customer base of 33,000 in over 100 countries (QlikTech International AB, 2014). QlikView provides an interface that encourages users to “follow the information scent” through visualization and ad-hoc querying (QlikTech International AB, 2011). The software allows students to experience organizing and managing large data sets through its in-memory technology on a desktop software platform. Due to a lower software learning curve, students are able to apply their skills with QlikView using publicly accessible data sources to solve real-world problems.
2. COURSE OBJECTIVES
Students taking this course are part of the information systems (I.S.) major that is situated within a business school curriculum. This course is an elective that supplements required courses in the I.S. major. Students in the I.S. program are grounded in the theoretical areas of programming, system analysis/design, relational databases, and networks while learning hands-on skills in both business and technology that prepare them for managing applications, data, networks, and systems in a wide variety of organizations. This course introduces and builds on the concept of data warehousing and modeling data for analysis rather than for transactional and operational processes. Most students have already had experience in modeling relational databases and writing structured query language (SQL) through previous coursework, although it is not a pre-requisite. This course provides students with a
hands-on experience in data warehousing, data analytics, and executive dashboards. In addition to the experiential case discussed in this paper, students complete a series of labs focused on data warehousing fundamentals and Extract-Transform-Load (ETL) processes through Microsoft Access. These exercises build technical and modeling skills in addition to follow-up analysis of results. The course concludes with a final project where students use their BI skills to assist a community client in finding insights with their data. The primary objectives of this course are as follows:
Understand the strategic importance of Business Intelligence and data analytics.
Design and develop a data warehouse based on data needs and user requirements.
Extract, transform, and load operational data into a data warehouse.
Build a Business Intelligence application for Dashboarding, Analysis, and Reporting.
Practice system design architecture and concepts.
Interpret data into informed decisions for recommendation.
Collaborate with a third-party client in teams to support organizational data needs.
3. USING QLIKVIEW FOR BUSINESS INTELLIGENCE
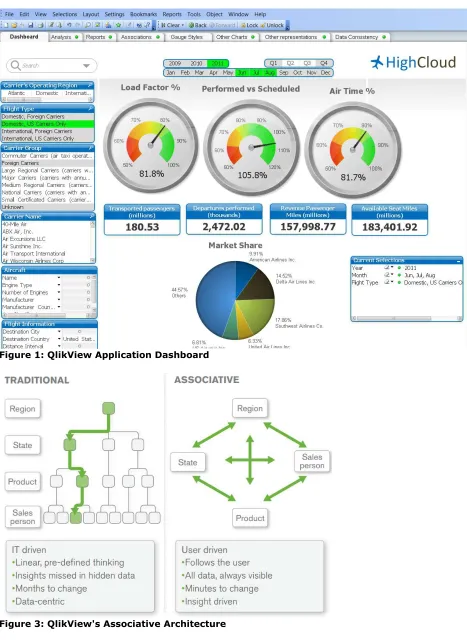
While several of the dashboard creation functions within the software are “drag and drop,” more advanced features require a syntax that is a blend of SQL and “Microsoft Excel-like” functions. Once the data is prepared and the model is established, the user has the capability of building dashboard applications using charts, graphs, multi-dimensional data analysis, and reports as seen in Figure 2 (Garcia & Harmsen, 2012). Hugh Watson (2008) suggests that these visual software tools are designed to be easy to use and that dashboards and scorecards are vital to an organization. QlikView’s unique model is achieved through an “associative architecture” that challenges the traditional BI drill-down model shown below in Figure 3 (QlikTech International AB, 2011). This allows the user to create connections through any key-pair relationship without having to follow a desktop software to qualifying higher education institutions for teaching purposes. QlikView also provides training resources and an online community to share in the practice with other faculty.
In evaluating other Business Intelligence software titles for use in this course, a common challenge was higher-barriers to entry. Other popular BI software like IBM Cognos and Oracle Business Intelligence required significant server infrastructure that were not affordable or accessible despite low-cost or no-cost academic agreements. For example, the Oracle Business Intelligence stack requires separate database, middleware, and application servers, in addition to software pre-requisites such as Java and operating system patches, to run properly, all which require a significant investment of planning and time to implement (See Figure 4). Even with newer cloud-based offerings as with IBM Cognos through their academic program, a significant amount of configuration time was necessary to have an environment ready for academic alliance resources has increased,
however, there remains a demand for stronger teaching resources.
QlikView’s desktop edition requires a small computer laboratory footprint, which allowed for faster setup time for the course. The software installed using a traditional installation wizard that took no more than 10 minutes per workstation. QlikView provides several free resources including videos and downloadable tutorials that allow students to learn, self-guided, on how to use the software application. Supplemental tutorials were used from “QlikView for Developers” by Miguel Garcia to build a more robust skill set beyond the beginner level and provide a connection between Business Intelligence principles and a new model for data analysis. In addition, QlikView allows for the processing of millions of rows of data using in-memory technology. This scalability allows for the introduction of Big Data concepts on a consistent platform for students. The software allows for the teaching of fundamental BI interpret the data rather than overcoming software-specific hurdles. While the course is currently aimed at information systems majors, it could be amended to appeal to a wider business school or non-business school audience.
4. USING AIRLINE DATA TO APPLY BI SKILLS
To gain a better understanding of QlikView beyond tutorials and prescribed lab exercises, students are given a case and tasked with determining factors that lead to delayed commercial airline flights. The premise is that a popular travel publication wants to assist its readers in how best to choose flights that have a higher probability of being on-time. Objectives for this case are to: 1) obtain data from an external source, 2) model the data in the form of a data warehouse, 3) construct dashboards for analysis and reporting, and 4) analyze and interpret the results.
Administration website comma-separated value (CSV) files along with corresponding look-up tables. Students are challenged with sifting through an external data source that contains several attributes classified in different manners, in addition to approximately 500,000 rows of data per month. Through this case, students learn how to handle large data sets and are simultaneously challenged with addressing uncertainty in the way of data quality.
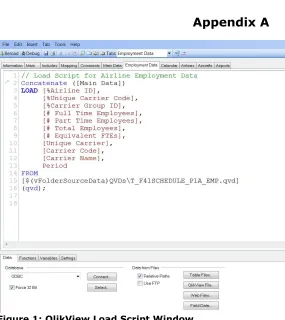
Once students have the data set downloaded, the data is modeled into a star-schema data warehouse for import into QlikView. Students use the provided data set and make decisions on how to align the data appropriately for analysis. Students then prepare for the extract-transform-load (ETL) process using QlikView’s load script feature. The load script is a text-based editor that includes a “builder-like” feature to allow the construction of load statement (See Figure 5). Through this process, students practice ETL skills to convert data into appropriate data types and transform data into appropriate fact-based and time-variant dimensions.
Once the data is transformed and loaded into QlikView, students build visualizations to represent the airline data in a myriad of ways, dashboards are complete, students then summarize their findings in a business-style report for the travel publication.
“A BI recruiter noted that [It’s hard to find] a good mix of technical and business skills. Too often, students are skewed too far one way or the other” (Wixom, 2011). This experiential project allows students to see the whole process from beginning to end while practicing with relevant data. In a student survey regarding the airline project, one student commented that they “learned that it was more efficient to reflected on the importance of ethics and critical thinking by saying, “the developer has the opportunity to make the data say what [he/she] wants. It reinforced the need for me to be unbiased and think about how I wanted to display the data.” Based on Kolb’s research in experiential learning, the experience provided students with opportunities for a concrete experience, abstract conceptualization, active experimentation, and reflection (1984). This assignment moved students from completing a list of prescribed steps to simulating real-world work; work they are now better prepared to execute after graduation. Wixom et. al’s (2014) work concludes that through real-world business problems, students can be better prepared to “hit the ground running”. Through this exercise, students apply their knowledge of data warehousing concepts in a technical setting through QlikView using real data while interpreting and reflecting upon their creation.
5. DISCUSSION AND CONCLUSIONS
The details of this paper make an important contribution to information systems educators in search of a maintenance, no-cost, low-learning curve software package that allows students to demonstrate the practice of data warehousing in combination with data analysis. The airline data exercise allows students to build on their learned BI skills with a real-world data set that goes beyond a software demonstration or step-by-step set of instructions. Course evaluations indicated that students found the software tool valuable in developing their ability to build data warehouses and create BI applications using real-world data. Because the software has lower barriers to entry and has a lower learning curve than infrastructure-heavy enterprise software packages, it is possible that this course could be made available for other business majors where analyzing and interpreting data for competitive advantage are valuable skills, such as in the disciplines of finance and marketing. Further work is necessary to evaluate the format of the course, analyze appropriate pre-requisites, and evaluate how it can be best delivered to a broader audience.
6. ENDNOTES
downloadable software application for either Windows 32-bit or 64-bit architectures. The program is installed on individual machines running Microsoft Windows 7 (support for Microsoft Windows 8 is available). There were no software conflicts or maintenance issues encountered once the software was installed. A free-trial is available at http://www.qlikview.com, although QlikView application files developed on the installed workstation will be invalid on other workstations. Each student had their own workstation in a computer lab for use of assignments and projects. 2. This class has been taught in the
aforementioned format for two years in the spring. The average number of students in this class is 9 per offering. The only pre-requisite for this course is Organizational Information Systems, a survey information systems course that all business majors take.
7. REFERENCES
Ayyagari, R. (2011), "Hands-on ERP Learning: Using OpenERP®, an Alternative to SAP®." Journal of Information Systems Education, Vol. 22, No. 4, Summer 2011, pp. 123-133.
Chaudhuri, S., Dayal, U., & Narasayya, V. (2011). “An Overview of Business Intelligence Technology.” Communications of the ACM. Vol. 54, No. 8, pp. 88-98. doi:10.1145/1978542.1978562
Garc a, M., armsen, B. (2012). QlikView 11 for Developers. Birmingham: Packt Publishing.
Kolb, D.A. (1984). The Process of Experiential Learning. In Experiential learning: experience as the source of learning and development Chapter 2). Retrieved from http://www.learningfromexperience.com/im ages/uploads/process-of-experiential-learning.pdf
Mrdalj, S. (2007). “Teaching an Applied Business Intelligence Course.” Issues in Information Systems, Vol. 8, No. 1, pp. 134-138.
Oracle Corporation (2014). Oracle® Fusion Middleware Installation Planning Guide 11g Release 1 (11.1.1.7.0). Retrieved from http://docs.oracle.com/cd/E28280_01/install .1111/b32474/start.htm#BABIAFAH
QlikTech International AB. (2011), “Business Discovery: Powerful, User-Driven BI: A QlikView White Paper.” Retrieved from http://www.qlik.com/us/explore/resources/ whitepapers/business-discovery-powerful-user-driven-bi
QlikTech International AB. (2014). QlikView Personal Edition (Version 11.2) [Software].
Available from
http://us-d.demo.qlik.com/download/
QlikTech International AB. (2014). “QlikView Customers”. Retrieved from http://www.qlik.com/us/explore/customers Research and Innovative Technology
Administration: Bureau of Transportation Statistics. (2014). On Time Airline Performance [Multiple Data Files]. Retrieved from “The Current State of Business Intelligence in Academia.” Communications of the Association for Information Systems, Vol. 29, Article 29, October, 2011, pp. 299-312.
Wixom, B., Ariyachandra T., David, D., Goul, M., Gupta, B., Iyer, L., Kulkarni, U., Mooney, J., Phillps-Wren, G., & Turetken, O., (2014). “The Current State of Business Intelligence in Academia: The Arrival of Big Data.” Communications of the Association for Information Systems., Vol. 34, Article 1,
Appendix A
Figure 1: QlikView Application Dashboard
Figure 4: Installing Oracle Business Intelligence Release 11.1.1.7.0 Using the Product Installer
Appendix B
Airline Analysis in QlikView
BackgroundCommercial airlines are constantly under scrutiny from the government and the public for the timeliness in takeoff and departure. The popular periodical Travel and Leisure has contracted you to build a business intelligence application to analyze the timeliness (or lack thereof) of domestic commercial airlines. They want to inform their readers of the best and worst carriers based on timeliness. Travel and Leisure is particularly interested to see if there are differences based on location and/or time (time of day, week, month, etc.) They would like to publish your findings in their upcoming issue. Your goal is to develop an appropriate data warehouse model and create a business intelligence application using QlikView to support the analysis of domestic commercial airline departure and arrival data from October through December, 2013.
Access to Data
Access to the appropriate data can be downloaded from the following website via the Research and Innovative Technology Administration: http://goo.gl/a1rnk. This table contains on-time arrival data for non-stop domestic flights by major air carriers, and provides such additional items as departure and arrival delays, origin and destination airports, flight numbers, scheduled and actual departure and arrival times, cancelled or diverted flights, taxi-out and taxi-in times, air time, and non-stop distance.
The website allows you to select which fields you want to download in your table. Definitions for those fields are available as well. Associated fields also contain necessary lookup tables to build your data warehouse using varying dimensions. All of the data from this source is downloadable in csv (comma separated value) format. You will need to import and
transform that data to build your fact and dimension tables for use in your QlikView application.
Requirements and Evaluation (75 points)
Through this project, you should be able to demonstrate the following:
Ability to access data from public sources in raw format and import into QlikView. (5 points)
Model an appropriate data warehouse using necessary facts and dimensions using a star schema approach. (20 points)
Transform data into the appropriate format for use in analysis. (5 points) Develop a business intelligence application using QlikView that consists of
appropriate charts, graphs, and tables that enables users to engage in business discovery for dashboarding, analysis, and reporting. (25 points)
Analyze the data through the developed QlikView application.
Appendix C
Book Resources for Educators
1. Business Intelligence (Strategic Management Collection) by Jerzy Surma. 2011. Business Expert Press. ISBN-13: 978-1606491850
2. QlikView for Developers by Barry Harmsen and Miguel Garcia. 2012. Packt Publishing. ISBN-13: 978-1849686068
Appendix D
Website Resources for Educators
1. QlikView Academic Program: http://www.qlik.com/us/company/academic-program
2. QlikView Software Download: http://us-d.demo.qlik.com/download/
3. QlikView Resource Library: http://www.qlik.com/us/explore/resources
4. Research and Innovative Technology Administration Airline Data Download: