68
Lucia Sri Istiyowati1 and Tiolina Evi2
1) Faculty of Information Technology, Perbanas Institute, Jakarta, Indonesia 2) Faculty of Business and Economic, Perbanas Institute, Jakarta, Indonesia
E-mail: [email protected], [email protected]
Abstract
Cooperative is basically an economic organization of the people who have the economic capacity, which is in motion is not only concerned with economic motives. In addition to form a company that requires a profit, the cooperative also has a social motive. This is reflected in the principles espoused. Cooperative is an organization that is familial and managed democratically. In this study the chosen type of credit union, a group of people who agree to raise capital by providing loans to members of its own with a decent interest rate and approved. As one of the requirements in order to be able to make loans to members of cooperatives are the members must have attended training organized by the cooperative board. The spread of the location and the bustle complicate members required to attend training. Development of technology and beneficiaries among members provide alternative learning solutions for members. For that we need to know whether members are ready to accept the training system based on information technology. The readiness of members in this case at CU Melati Kopdit Jagakarta landfill checked by sampling techniques. From preliminary research/beginning it seems that members of the CU Melati landfill Jagakarsa ready to accept the program of distance education (e-learning) for cooperative education.
Keywords: cooperative, credit, satisfaction, members, economy,e-learning
Abstrak
Koperasi pada dasarnya adalah sebuah organisasi ekonomi rakyat yang memiliki kemampuan ekonomi, yang dalam geraknya tidak hanya peduli dengan motif ekonomi. Selain bentuk perusahaan yang membutuhkan keuntungan, koperasi juga memiliki motif sosial. Hal ini tercermin dalam prinsip-prinsip yang dianut. Koperasi adalah organisasi yang bersifat kekeluargaan dan dikelola secara demo-kratis. Dalam penelitian ini dipilih jenis koperasi kredit (credit union), sekelompok orang yang setuju untuk meningkatkan modal dengan memberikan pinjaman kepada anggota sendiri dengan tingkat bu-nga yang layak dan disetujui. Sebagai salah satu syarat agar anggota dapat melakukan pinjaman pada koperasi adalah anggota tersebut harus telah mengikuti pelatihan yang diselenggarakan oleh pengurus koperasi. Tersebarnya lokasi dan kesibukan menyulitkan anggota untuk mengikuti pelatihan yang di-syaratkan. Perkembangan teknologi dan pemanfaatnya di kalangan anggota memberikan alternatif solusi pembelajaran bagi anggota. Untuk itu perlu di ketahui apakah anggota siap untuk menerima sistem pelatihan/pembalajaran berbasis teknologi informasi. Kesiapan anggota dalam hal ini di CU Melati Kopdit Jagakarta TPA diperiksa dengan teknik sampling. Dari penelitian pendahuluan/awal ini nampak bahwa anggota Kopdit CU Melati TPA Jagakarsa siap untuk menerima program pendidikan jarak jauh (e-learning) untuk pendidikan perkoperasian.
Kata Kunci: koperasi, kredit, kepuasan, anggota, ekonomi, e-learning
1. Introduction
Credit Union (CU) is a cooperative which is a financial service institution that specifically serves the financial and loan services. The defi-nition of a cooperative is an autonomous asso-ciation of persons who join voluntarily to meet the needs and aspirations of economic, social and cultural development through the same company that owned and democratically controlled [1].
Credit Union is a financial services
result is not only enjoyed by the company had only, but for the welfare of members.
Many cooperatives were disbanded because of fraud or diversion of management by mana-gers (e.g. money taken away/corrupted by the board). The principles of the cooperative are open and voluntary membership, democratic supervi-sion by members, members participation in eco-nomic activity, autonomy and independence, edu-cation or training and information, cooperation among cooperatives, and concern for the commu-nity [1].
Considering the importance of cooperatives as one of the financial institution in Indonesia and of the welfare of society, the satisfaction of mem-bers of the credit union services/credit union needs to be improved, since the suistanbility and the development of a cooperative is depending on participation of the members, in addition to good organization or management.
CU Melati was established in 1990 in Depok, with more than 3000 members in January 2014 and assets of approximately 27 billion ru-piah. Members scattered in various places[2] as shown in TABLE 1 which is incorporated in Place of Member (PoM), which amounts to approxi-mately 20 landfills. Work area includes the city of Depok and surrounding areas, as well as remote areas such as in Wonosari, Gunung Kidul, Yogya-karta. With a large enough number of members and scattered in different places, then surely ne-cessary relationship and good communication, excellent service, and other requirements that cooperatives can grow steadily and sustainability CU Melati chosen because the authors are the member of CU Melati.
TABLE 1
AMOUNT OF MEMBER BASED ON LANDFILLS
Landfill City Member
Jati Asih Bekasi 85
Marsudirini Bogor 57
Matahari Bogor 638
Mawar Bogor 97
Morisfoun Bogor 60
Salon Susan Bogor 60
Triguna Bogor 174
Lestari Bojong Gede 19
Maju Bersama Cicurug 9
Sukmajaya Cimanggis 133
Benji Depok 510
Cipanas Depok 85
Kartini Depok 46
Pancoran Mas Depok 442
Gunung Kidul Gunung Kidul 312 Jagakarsa Jakarta Selatan 253 Manunggal Roso Sukoharjo 42 Source RAT XIII Kopdit CU Melati, January 2014
Cooperative development was seen in the in-creasing number of members with a diversity of backgrounds of members, income, education or profession. With the development and diversity of member service satisfaction increasingly more difficult to achieve and required a wide range of services to achieve it.
One of the requirements for CU member is to follow the basic education of the members of the cooperative to be followed to obtain better facili-ties as a member of the cooperative. Basic educa-tion conducted during the two (2) days (Saturday and Sunday) at the beginning of a member, and become one of the prime conditions for obtaining loans. Not all members have the time to follow the education and this can sometimes be a barrier for members and prospective members of the cooperative to be active in the cooperative. To overcome this, we need a solution that can bridge the members and the cooperative so that all mem-bers can meet the requirements to obtain maxi-mum service from the cooperative. Information technology as an enabler, very strongly influence people's lives in various fields. Services are sup-ported by technology can improve customer satis-faction or stakeholders.
The number of Internet users grew signify-cantly to 22% from 62 million in 2012 to 74.57 million in 2013. According to some researches, MarkPlus Insight figures the number of Internet users in Indonesia will penetrate to 100 million in 2015. Respondents in the survey were 15-64 years old who regularly access the internet at least 3 hours a day, either through a smartphone, personal computer, laptop, netbook or tablet PC [3]. While social media, especially Facebook user in 2013 reached 50 million and is expected to be 70.6 million more in 2015[4].
This study aimed to find out about: 1) Readi-ness of CU members with e-learning, 2) Know-ledge of cooperative CU members on ICT (Information and Communication Technology) with e-learning. 3) Effect of readiness of members and members' knowledge about ICT with e-learning.
Fig 1. Reasearch Framework Member Readiness
(X1)
Member’s knowledge about
ICT (X2)
E–Learning
2. Research Method
The research is a quantitative research that aims to find out about:
1) Readiness of CU Melati Jagakarsa members towards e-learning,
2) Knowledge of cooperative members CU Melati Jagakarsa on ICT towards e-learning, and
3) Effect of member readiness and members' knowledge about ICT towards e-learning.
The hypothesis is as follows:
• Ho : There is no significant difference bet-ween the readi-nesses of member (X1) with e-learning (Y).
• Ho : There is no significant difference bet-ween the ICT knowledge of members (X2) with distance educa-tion (Y).
• Ho : There is no significant difference bet-bers (X2) with e-learning (Y).
• Ha : There is a significant relationship bet-ween the readi-ness of member (X1) and ICT knowledge of members (X2) with e-learning (Y).
Cooperative
The cooperative has the purpose to promote the welfare of members in particular and society in general as well as help build national econo-mic order in order to realize an advanced society, equitable and prosperous based on Pancasila and the 1945 Constitution so cooperative basically did not get any benefit, but members who receive benefits.
The role of cooperatives in the economic community of which is to increase incomes, create jobs, improve living standards and to spread income. Cooperative also has a role in the social sphere by spreading the spirit of voluntary, working together to build a more humane social order, a sense of brotherhood, kinship, also demo-cratic and peaceful society.
Cooperatives also have some kinds of coo-perative forms of production and consumption and also credit cooperative. This study focuses on the Credit Union which aims to provide services to members by providing cheap and easy credit. The members agreed to raise capital together to lend among themselves with reasonable interest
for a good purpose.
Credit unions intend to operate a non-profit business. In fact, the capital gains and profits of the members are the precise target to be achieved by all the credit unions. However, credit unions are not established merely to benefit the share-holders but also used for the purpose of democra-tic, social awareness and human development. Development and activities of the credit coope-rative movement in Indonesia has been driven by the principles of operation of credit cooperatives (Mission Statement) that is internationally recog-nized and mission statement developed by the credit cooperative movement in Indonesia.
Credit cooperative services aimed at impro-ving both the economic and social welfare of its members. If there are profits left over from the credit cooperative activities, net of reserve funds and pay dividends is limited on own capital as ap-plicable, then the rest is the right of all members in that no member benefit more while the other members there are losers. The excess was distri-buted to members in the form of interest or ear-nings according to the number of transactions they do with credit unions, or it could also be used to increase or hold the additional services needed members.
Relationships between members in the credit union is the relationship between members of a whole, certain parts or target groups within the members, including new members, young people, senior members, members by geographic area (villages or cities) or members who are not active within the credit cooperative. Cooperative Mana-gement shall have the authority to make decisions and show leadership that maintained an effective membership. Members also have the assumption that the credit union is a cooperative that runs a strong credit, able to survive and will serve their needs in the future. Therefore the satisfaction of members of credit unions are all concerned in this. Board undertakes the authority in whether or not a credit union providing cheap and easy credit to members. Then the board must establish and update the goals and policies to guide the deve-lopment of members, to approve programs and budgets, and to assess the effectiveness of the re-lationship of members or program development. Member satisfactions have a close relationship with quality. Quality gives an impetus to the members to establish strong ties with the credit union. In the long term bond, it allows credit uni-ons to carefully understand the expectatiuni-ons and needs of their members.
mem-berships that provides a satisfactory quality. How to achieve member satisfaction, namely: participa-tion of members to be part of all plans and pro-grams concerning members; based on the needs of members, members must regularly obtain the in-formation about credit unions, and cooperative management must communicate effecttively with members, including the development planning members as part of the regular budget process.
In a cooperative organization, the participa-tion of members becomes very important because basically members in cooperative have both roll i.e. as an owner and as a customer of the coopera-tive. This means the dependency on the participa-tion of members of the cooperative is very high because as owners, members should support the availability of facilities (material and non-mate-rial) for the implementation of cooperative organi-zations and businesses, while as customers, mem-bers should take advantage of the potential of cooperative efforts and services. Therefore, the participation of members in the organization and management of the cooperative effort is absolute-ly necessary.
Although the cooperative has provided eco-nomic services for the members, if members do not/do less participation in the cooperative activi-ties, then the service becomes less meaningful. Ropke in [5] explains that the existence of coope-ratives as self-help organizations greatly depends on the participation of its members. If the expla-nation is applied in cooperative, it is not exagge-rating to say that cooperative achievement will de-pend on the level of participation of its members. "Customer satisfaction is a full evaluation of al-ternatives that have been purchased which is at least equal or exceed customer expectations, while dissatisfaction arise if the results do not meet expectations" [5].
The focus on the quality of the cooperative member satisfaction can be defined simply as a situation where the cooperative credit members feel that the quality of the product exceeds the needs, desires, and their expectations, thus the satisfaction of the members will be high. On the other hand if the members feel that the quality of the product is lower or smaller than the needs, desires, and expectations, then satisfaction of members will get lower. Quality refers to every-thing that can give satisfaction to members. A product has a high quality if it is produced in accordance with the wishes of members and can be used or utilized properly.
E-learning
E-Learning can be defined as: "The use of electronic technologies to create learning experi-ences" [6]. According to Horton, there are some
kinds of e-leraning namely [6]:
1) Stand-alone courses: courses taken by a solo learner.
2) Learning games and simulations: Learning by performing simulated activities that requires exploration and leads to discoveries. 3) Mobile learning: Learn-ing from the world
while moving.
4) Social Learning: Learning through
interaction with a community of experts and fellow learner.
5) Virtual-classroom courses: online classes struc-tured much like a classroom courses, with reading assignments, presentations, discussions via fo-rums and other social media, and home-work.
According to Riyanto et al., E-Learning is a form of applied information technology in education in the form of virtual schools. E-learning can be more effective in stimulating students to explore knowledge [7].
Previous research studies related to the re-search include: Kataren states that the education of the cooperative credit union is proven to bring benefits and satisfaction for the members of the cooperative in terms of looking at the financial position, the financial risks and to prepare deci-sions that are based on the actual financial con-dition [8]. Kataren further states that there is a relationship between formal and non-formal education (cooperative education and entrepre-neurship) with the success of the business [8]. Lie states that, "Incorporating digital literacy in edu-cation involves methodology and design. As part of the methodology, tools such as Edmodo work effecttively as a bridge to cross over the digital divide and reach out to the digital native students. There is still room for im-provement in the use of technology tools in de-signing and delivering appropriate content to achieve what Prensky calls digital wisdom. Digi-tal literacy should make us not only smarter but also wiser." [9]
3. Results and Analysis
Characteristic of Respondents
The characteristics of a sample of respon-dents in this study are grouped according to age, gender, education and occupation. To clarify the characteristics of the respondents, the respondent data tables as described in TABLE 2, 3, 4, and 5 are provided:
By Gender
The overviews of respondent by gender is shown in TABLE 2.
RESPONDENTS BY GENDER
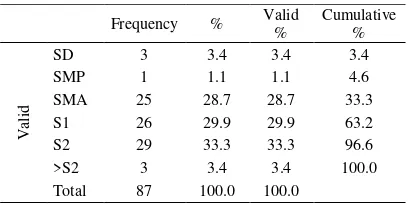
By Level of Education
The overview of respondent by level of education is as shown in TABLE 3.
TABLE3
RESPONDENTS BY LEVEL OF EDUCATIOAN
Frequency % Valid RESPONDENTS BY OCCUPATION
Freq. % Valid % Cumulative %
The instruments that are used in this research are as follow.
Validity Test
Validity test used to measure the validity of the questionnaire. A questionnaire is considered valid if the statements in the questionnaire could reveal something that can be measured by the
questionnaires. The validity of an item can be seen in the results statement SPSS output table item-total statistics. A variable is said to be valid when the r-count value which is the value of Correlated Item Total Correlation of r-table. R-value table can be obtained by df (degree of free-dom) = nk, where n is the number of respondents and k is the number of grains in a variable decla-ration. Alpha used in this study was 5%.
TABLE6
MEMBER READINESS TEST VALIDITY
Item r count r table Information
X1_1 0.743 0.178 Valid
X1_2 0.788 0.178 Valid
X1_3 0.768 0.178 Valid
X1_4 0,879 0.178 Valid
Source: Data processed in 2014
Based on the validity of the test results table readiness of members of the above, it is known that the entire item questions used in this study is valid, as indicated by the value of each item ques-tion has a value of Pearson Product Moment (rcount) positive and greater than the value of rtable.
TABLE7 Source: Data processed in 2014
Based on the validity of the test results table members' knowledge about ICT, it is known that the entire item questions used in this study is valid, as indicated by the value of each item question has a value of Pearson Product Moment (r count) positive and greater than the value of rtable.
TABLE8
Source: Data processed in 2014
Reliability Test
Reliability indicates the consistency and sta-bility of the score of a measuring instrument. A questionnaire can be said realiable or reliable if someone answers on the statement is consistent or fixed from time to time. Reliability test is inten-ded to determine the consistency of measurement variables. Reliable measurement instrument shows that the questionnaires are trusted and can produce reliable data as well. The reliability of a variable can be good if it has the value of Cron-bach's Alpha > 0.60.
TABLE9 RELIABILITY TEST RESULTS
Variables Cronbach
Alpha
Information
Members readiness (X1) 0.802 Reliable Member knowledge about ICT
(X2)
0.767 Reliable
Distance Education/e-Learning (Y)
0.861 Reliable
Source: Data processed in 2014
Based on testing in table 4 reliability test is known that all the variables have Cronbach Alpha greater than 0.60, so it can be concluded that the overall variable in this study is reliable.
Classical Assumption Test
The classical assumption tests that are used in this research are as follow.
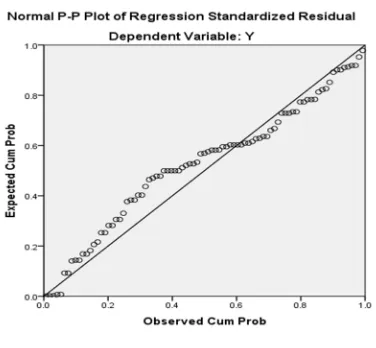
Normality Test
Fig 2. Normal PP Plot
Normality test is to see if the residual value is normally distributed or not. A good regression model is to have a residual value that is normally distributed. So normality test is not performed on each variable but the residual value.
Detection of normality of the data can be seen from the spread of points on the diagonal axis of the graph. In the graph shows the data
spread around the diagonal line and follow the direction of the diagonal line. Thus, the model in this study meets the test for normality.
Test Multicollinearity
Multicollinearity test aimed to see whether or not a high correlation between independent va-riables in a multiple regression model. If there is a high correlation between the independent varia-bles, the relationship between the independent va-riable on the dependent vava-riable will be disturbed.
TABLE10
TEST RESULTS MULTICOLLINEARITY COEFFICIENTS A
Model
Collinearity Statistics
Collinearity Statistics Tolerance VIF
1
(Constant)
X1 .264 3783
X2 .264 3783
Source: Output data from IBM SPSS Statistics 21.0 2014
From the analysis, obtained two independent variables (independent) in this study are its VIF under 10 and his tolerance close to 1. This means that there is no multicollinearity between the inde-pendent variables.
Test Autocorrelation
Autocorrelation is a state in which the corre-lation of residuals for the observation of one with the other observations arranged in time series. A good regression model requires the absence of autocorrelation problem.
TABLE11
AUTOCORRELATION TEST RESULTS MODEL SUMMARY
Model R Square R Adjusted R Square
Std. Error of the Estimate
Durbin-Watson
1 .860 A .740 .733 2.390 1,375
Source: Data output IBM SPSS Statistics 21.0 2014
How to test the autocorrelation can be done with the test Durbin Watson. Multiple linear re-gression equation free from autocorrelation if the value of the Durbin Watson count on SPSS output located in the area d (no autocorrelation) or the value calculated Durbin Watson honing 2. The output value of the results of SPSS by 1,375, based on the output of the above it can be seen that there is no auto-correlation.
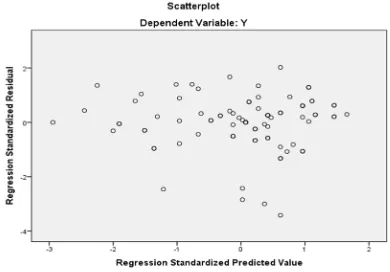
Heterokedastity Test
homoske-dastisitas.
From the Fig. 3, it is shown that there is no clear pattern, namely point spread, thus there is no heteroskedastisitas problem indicated.
Multiple Regression Test
Multiple regressions test is used to determine the direction and magnitude of the influence of the independent variables of more than one mem-ber and to measure the readiness and knowledge of the ICT (information and communication tech-nology) members on the dependent variable in the distance education (e-Learning).
TABLE12
RESULTS OF MULTIPLE LINEAR REGRESSION ANALYSIS
COEFFICIENTS A Model Unstandardized
Coefficients
Standa rdized Coeffi cients
t Sig.
B Std. Error
Beta
1
(Const.) 2,831 1,683 1682 .096 X1 .586 .200 .317 2928 .004 X2 .790 .149 .572 5285 .000 Source: Data output IBM SPSS Statistics 21.0 2014
Based on data analysis using IBM SPSS Sta-tistics 21.0 program, the regression equation is as shown in equation (1) as follows.
2,831 0.790 0.586 1 2 (1)
F Test (Unison Test)
F test is conducted to test whether all inpendent variables simultaneously affect the de-pendent variable with a confidence level of 95% (alpha 5%) or not. The null hypothesis (Ho) is reached by setting all the parameters in the model to zero, hence Ho: β1 = β2 = 0, which means there is no influence of independent variables on the dependent variable. Whereas in the alternative hy-pothesis (Ha) all parameters are not set to zero,
thus Ha: β1 ≠ β2 = 0 which means that there is influences of independent variables on the depen-dent variables simultaneously. Thus the p-value in Ho > 0.05, p-value of Ha < 0.05.
TABLE13 TEST RESULTS TEST FANOVAA
Model Sum of
Squares Df Mean Square F Sig.
1
Regression 1362.083 2 681 042
119 249
.000 B Residual 479 733 84 5711
Total 1841.816 86
Source: Data output IBM SPSS Statistics 21.0 2014
Based on the above analysis, it can be seen that there is influence of independent variables on the dependent variable. This can be seen in the Sig. labeled column, whose value is below 0,05 or more precisely 0,00, so Ha is received while Ho is rejected.
Based on the test results F (simultaneously), it can be seen that there is influence of the inde-pendent variables (the readiness of members and the ICT knowledge of members) on the dependent variable (distance education). It can be seen in the sig. column, where the value is below 0,05 or more precisely 0,000, so Ha is received, while Ho is rejected, can be seen in TABLE 13.
T test (Partial Test)
T test is intended to determine whether partially independent variables affect the depen-dent variable, with the following conditions: Ho:
β1 = 0, which means there is no influence bet-ween independent variables with the dependent variable. Ha: β≠ 0, which means that there is in-fluence between independent variables and the dependent variable individually. Thus the p-value in Ho > 0.05, p-value of Ha < 0.05.
Based on the data analysis using IBM SPSS Statistics 21.0, to produce sig value of 0.004 the readiness of member needs t value of 2.928. Meanwhile the value of the distribution table with an error rate of 5%, and df (nk) is equal to 1,988. Hence t (2.928) > ttable (1.988). This means the
rea-diness of member variables X1 has a positive
influence. It is also strengthened by the significant value of 0,004 (< 0,050) which means variable readiness member X1 has positive and significant
impact on distance education Y.
On the other hand, the knowledge of mem-bers of the ICT (Information and Communication Technology) produces sig value of 0.000 and t va-lue for this variable is 5.285. Meanwhile the vava-lue of the distribution table with an error rate of 5%, and df (nk) is equal to 1,988. Hence t (5.285) > ttable (1.988). This means that the variable
know-ledge of the members of the ICT X2 has a positive
influence. It is also strengthened by the significant Fig. 3. Regression Model. Source: output data from IBM
value of 0,000 (< 0,050) means that the variable knowledge of the members of the ICT X2 has
positive and significant impact on distance educa-tion Y. Source: Data output IBM SPSS Statistics 21.0 2014
The coefficient of determination (R2)
In multiple linear models, the influence of the independent variables on the dependent varia-bles is observed by looking for the total size of the coefficient of determination R2. If R2 is closer to 1, it can be said that it is the strongest model to explain the relationship of independent variables on dependent variables. Conversely, the closer R2 to zero, the weaker the influence of independent variables on the dependent variable is.
TABLE15
RESULTS COEFFICIENT OF DETERMINATION MODEL
SUMMARYB Source: Data output IBM SPSS Statistics 21.0 2014
Based on the analysis described in TABLE 15, it can be seen that the value of the adjusted R2
is 0.740 or 74.0%. It indicates that 74.0% which is the dependent variable of distance education can be explained by two independent variables, name-ly the readiness of members and the knowledge of members about ICT.
Correlation
Correlation test does not distinguish the types of variables (no dependent or independent variable). The relationship is expressed in terms of cor-relation coefficient. Correlation test aims to examine the relationship between two variables that does not show the functional relationship. The correlation coefficient has a value between -1 and +1. The nature of the correlation coefficient is plus (+) and minus (-).
Based on the results defined in TABLE 16, the readiness of members has a very strong corre-lation of 0.858 and ICT knowledge of members. The value p-value indicates the results on the sig. (2-tailed) column which is 0.000 (< 0.05). It means that there is correlation between the
readi-ness of members and ICT knowledge of members
TABLE16
CORRELATION ANALYSIS CORRELATIONS
X1 X2 Y
Source: Data output IBM SPSS Statistics 21.0 2014
The readiness of members variable has a very strong correlation and distance education (e-Learning) of 0.808. The p-value indicates the re-sults on the sig. (2-tailed) column of 0.000 (< 0.05). It means that there is correlation between the readiness of members and distance education.
The variable of ICT knowledge of members has a very strong correlation value of 0.844 with distance education. The p-value indicates the re-sults on the sig. (2-tailed) column of 0.000 (< 0.05). It means that there is correlation between ICT knowledge of members with distance educa-tion.
4. Conclusion
Research results of the readiness of members in the CU Melati Jagakarsa showed that the mem-bers are ready to carry out distance education or E-Learning in particular regarding the cooperative education. Members agree and believe that CU do and facilitate distance education.
From the result it can be concluded that the variable of ICT knowledge of the members has a positive influence. It means that the variable knowledge of the members of the ICT has posi-tive and significant impact on distance education in CU Melati Jagakarsa. It is very supportive when cooperatives organize distance education. Educational materials related to the cooperative concept can be provided on the cooperatives page. The CU member has a sufficient ICT knowledge and has a habit of using internet.
The variable of member readiness with the variable of ICT knowledge of members of toge-ther have a significant and positive effect on the variable distance education in CU Melati Jaga-karsa.
most of the members are adults who already have a job or their own livelihood. They usually prefer to learn independently and at leisure time they have.
References
[1] ACCU, “ACCESS: Auditor’s Manual, dalam Credit Union Solution Series Terj Bangkok.” Bangkok, 2009.
[2] “RAT XXIII,” CU Melati, Depok, Jan. 2014. [3] T. text provides general information S. as-sumes no liability for the information given being complete or correct D. to varying update cycles and S. C. D. M. up-to-D. D. T. R. in the Text, “Topic: Internet usage in In-donesia,” www.statista.com. [Online]. Avai-lable: http://www.statista.com/topics/2431/ internet-usage-in-indonesia/. [Accessed: 18-Sep-2015].
[4] “Indonesia: number of Facebook users 2012-2018 | Statistic,” Statista. [Online]. Availa-ble:
http://www.statista.com/statistics/304829/nu mber-of-facebook-users-in-indonesia/. [Accessed: 21-Sep-2015].
[5] H. Syahrudin, “Hubungan antara Manfaat Koperasi dengan Partisipasi Anggota,” Uni-versitas Padjajaran, Bandung, 2003.
[6] W. Horton, E-learning by Design, Second. Pfiffer, 2012.
[7] D. E. Riyanto, E. A. Sarwoko, and Kushar-tantya, “E-learning sebagai model proses pembelajaran berbasis Teknologi Informasi,” presented at the Semiinar Nasionatl SPMIPA, 2006.
[8] N. Kataren, “Faktor-Faktor yang Mempe-ngaruhi Keberhasilan Koperasi Credit Union dalam Pemberdayaan Masyarakat (Studi Ka-sus: Koperasi Credit Union Partisipasi Suka-makmur Kecamatan Sibolangit, Kabupaten Deli Serdang),” J. Harmoni Sos., vol. I, no. 3, Mei 2007.
[9] Anita Lie, "Social Media In A Content Course For The Digital Natives," TEFLIN
![TABLE 1 L million more in 2015[4].](https://thumb-ap.123doks.com/thumbv2/123dok/3426631.1765173/2.595.313.501.613.706/table-l-million-more-in.webp)