TeAM
YYeP
G
Digitally signed by TeAM YYePG
DN: cn=TeAM YYePG, c=US, o=TeAM YYePG, ou=TeAM YYePG, [email protected] Reason: I attest to the accuracy and integrity of this document
ANALYTICAL METHOD VALIDATION
AND INSTRUMENT PERFORMANCE
VERIFICATION
Edited by
CHUNG CHOW CHAN Eli Lilly Canada, Inc.
HERMAN LAM
GlaxoSmithKline Canada, Inc.
Y. C. LEE Patheon YM, Inc.
XUE-MING ZHANG Novex Pharma
ANALYTICAL METHOD VALIDATION
AND INSTRUMENT PERFORMANCE
VERIFICATION
Edited by
CHUNG CHOW CHAN Eli Lilly Canada, Inc.
HERMAN LAM
GlaxoSmithKline Canada, Inc.
Y. C. LEE Patheon YM, Inc.
XUE-MING ZHANG Novex Pharma
Copyright2004 by John Wiley & Sons, Inc. All rights reserved. Published by John Wiley & Sons, Inc., Hoboken, New Jersey. Published simultaneously in Canada.
No part of this publication may be reproduced, stored in a retrieval system, or transmitted in any form or by any means, electronic, mechanical, photocopying, recording, scanning, or otherwise, except as permitted under Section 107 or 108 of the 1976 United States Copyright Act, without either the prior written permission of the Publisher, or authorization through payment of the appropriate per-copy fee to the Copyright Clearance Center, Inc., 222 Rosewood Drive, Danvers, MA 01923, 978-750-8400, fax 978-646-8600, or on the web at www.copyright.com. Requests to the Publisher for permission should be addressed to the Permissions Department, John Wiley & Sons, Inc., 111 River Street, Hoboken, NJ 07030, (201) 748-6011, fax (201) 748-6008. Limit of Liability/Disclaimer of Warranty: While the publisher and author have used their best efforts in preparing this book, they make no representations or warranties with respect to the accuracy or completeness of the contents of this book and specifically disclaim any implied warranties of merchantability or fitness for a particular purpose. No warranty may be created or extended by sales representatives or written sales materials. The advice and strategies contained herein may not be suitable for your situation. You should consult with a professional where appropriate. Neither the publisher nor author shall be liable for any loss of profit or any other commercial damages, including but not limited to special, incidental, consequential, or other damages.
For general information on our other products and services please contact our Customer Care Department within the U.S. at 877-762-2974, outside the U.S. at 317-572-3993 or
fax 317-572-4002.
Wiley also publishes its books in a variety of electronic formats. Some content that appears in print, however, may not be available in electronic format.
Library of Congress Cataloging-in-Publication Data:
Analytical method validation and instrument performance verification / Chung Chow Chan. . .[et al.].
p. ; cm.
Includes bibliographical references and index. ISBN 0-471-25953-5 (cloth : alk. paper)
1. Drugs—Analysis—Methodology—Evaluation. 2. Laboratories—Equipment and supplies—Evaluation. 3. Laboratories—Instruments—Evaluation.
[DNLM: 1. Chemistry, Pharmaceutical—instrumentation. 2. Chemistry, Pharmaceutical—methods. 3. Clinical Laboratory Techniques—standards. 4. Technology, Pharmaceutical—methods. QV 744 A532 2004] I. Chan, Chung Chow.
RS189.A568 2004 610′.28—dc21
2003014141 Printed in the United States of America.
CONTENTS
Contributors vii
Preface ix
1 Overview of Pharmaceutical Product Development and Its
Associated Quality System 1
Chung Chow Chan and Eric Jensen
2 Potency Method Validation 11
Chung Chow Chan
3 Method Validation for HPLC Analysis of Related Substances
in Pharmaceutical Drug Products 27
Y. C. Lee
4 Dissolution Method Validation 51
Chung Chow Chan, Neil Pearson, Anna Rebelo-Cameirao, and Y. C. Lee
5 Development and Validation of Automated Methods 67
Chantal Incledon and Herman Lam
6 Analysis of Pharmaceutical Inactive Ingredients 85
Xue-Ming Zhang
7 Validation Study of JP Heavy Metal Limit Test 95
Yoshiki Nishiyama
vi CONTENTS
8 Bioanalytical Method Validation 105
Fabio Garofolo
9 Procurement, Qualification, and Calibration of Laboratory
Instruments: An Overview 139
Herman Lam
10 Performance Verification of UV–Vis Spectrophotometers 153
Herman Lam
11 Performance Verification of HPLC 173
Herman Lam
12 Operational Qualification of a Capillary Electrophoresis
Instrument 187
Nicole E. Baryla
13 LC-MS Instrument Calibration 197
Fabio Garofolo
14 Karl Fisher Apparatus and Its Performance Verification 221
Rick Jairam, Robert Metcalfe, and Yu-Hong Tse
15 The pH Meter and Its Performance Verification 229
Yu-Hong Tse, Rick Jairam, and Robert Metcalfe
16 Qualification of Environmental Chambers 243
Gilman Wong and Herman Lam
17 Equipment Qualification and Computer System Validation 255
Ludwig Huber
18 Validation of Excel Spreadsheet 277
Heiko Brunner
CONTRIBUTORS
Nicole E. Baryla, Ph.D., Eli Lilly Canada, Inc., 3650 Danforth Avenue, Toronto, Ontario M1N 2E8, Canada
Heiko Brunner, Ph.D., Lilly Forschung GmbH, Essener Strasse 93, D-22419 Hamburg, Germany
Chung Chow Chan, Ph.D., Eli Lilly Canada, Inc., 3650 Danforth Avenue, Toronto, Ontario M1N 2E8, Canada
Fabio Garofolo, Ph.D., Vicuron Pharmaceuticals, Inc., via R. Lepetit 34, I-21040 Gerenzano, Italy
Ludwig Huber, Ph.D., Agilent Technologies, Hewlett-Packard Strasse 8, 76337 Waldbronn, Germany
Chantal Incledon, GlaxoSmithKline Canada, Inc., 7333 Mississauga Road North, Mississauga, Ontario L5N 6L4, Canada
Rick Jairam, GlaxoSmithKline Canada, Inc., 7333 Mississauga Road North, Mississauga, Ontario L5N 6L4, Canada
Eric Jensen, Ph.D., Eli Lilly & Company, Indianapolis, IN
Herman Lam, Ph.D., GlaxoSmithKline Canada, Inc., 7333 Mississauga Road North, Mississauga, Ontario L5N 6L4, Canada
Y.C. Lee, Ph.D., Patheon YM, Inc., 865 York Mills Road, Toronto, Ontario M3B 1Y5, Canada
Robert Metcalfe, Ph.D., GlaxoSmithKline Canada, Inc., 7333 Mississauga Road North, Mississauga, Ontario L5N 6L4, Canada
viii CONTRIBUTORS
Yoshiki Nishiyama, Eli Lilly Japan KK, 4-3-3 Takatsukadai, Nishi-ku, Kobe 651-2271, Japan
Neil Pearson, Eli Lilly Canada, Inc., 3650 Danforth Avenue, Toronto, Ontario M1N 2E8, Canada
Anna Rebelo-Cameirao, Eli Lilly Canada, Inc., 3650 Danforth Avenue, Toronto, Ontario M1N 2E8, Canada
Yu-Hong Tse, Ph.D., GlaxoSmithKline Canada, Inc., 7333 Mississauga Road North, Mississauga, Ontario L5N 6L4, Canada
Gilman Wong, GlaxoSmithKline Canada, Inc., 7333 Mississauga Road North, Mississauga, Ontario L5N 6L4, Canada
PREFACE
For pharmaceutical manufacturers to achieve commercial production of safe and effective medications requires the generation of a vast amount of reliable data during the development of each product. To ensure that reliable data are generated in compliance with current Good Manufacturing Practices (cGMPs), all analyt-ical activities involved in the process need to follow Good Analytanalyt-ical Practices (GAPs). GAPs can be considered as the culmination of a three-pronged approach to data generation and management: method validation, calibrated instrument, and training. The requirement for the generation of reliable data is very clearly repre-sented in the front cover design, where the three strong pillars represent method validation, calibrated instrument, and training, respectively.
This book is designed to cover two of the three pillars of data generation. The chapters are written with a unique practical approach to method validation and instrument performance verification. Each chapter begins with general require-ments and is followed by the strategies and steps taken to perform these activities. The chapter ends with the author sharing important practical problems and their solutions with the reader. I encourage you to share your experience with us, too. If you have observations or problem solutions, please do not hesitate to email them to me at chung chow [email protected]. With the support of the Calibration & Validation Group (CVG) in Canada, I have set up a technical solution-sharing page at the Web site www.cvg.ca. The third pillar, training, is best left to indi-vidual organizations, as it will be indiindi-vidualized according to each organization’s strategy and culture.
The method validation section of this book discusses and provides guidance for the validation of common and not-so-common analytical methods that are used to support development and for product release. Chapter 1 gives an overview of the activities from the discovery of new molecules to the launch of new products in
x PREFACE
the pharmaceutical industry. It also provides an insight into quality systems that need to be built into the fundamental activities of the discovery and development processes. Chapters 2 to 5 provide guidance and share practical information for validation of common analytical methods (e.g., potency, related substances, and dissolution testing). Method validation for pharmaceutical excipients, heavy met-als, and bioanalysis are discussed in Chapters 6 to 8.
The instrument performance verification section of the book provides unbiased information on the principles involved in verifying the performance of instru-ments that are used for the generation of reliable data in compliance with cGMPs. The reader is given different approaches to the successful verification of instru-ment performance. The choice of which approach to impleinstru-ment is left to the reader based on the needs of the laboratory. Chapters 9 to 15 provide infor-mation on common analytical instruments used in the development laboratory (e.g., HPLC, UV–Vis spectrophotometers, and pH meters). Chapter 13 provides a detailed discussion of the LC-MS system, which is fast becoming a standard analytical laboratory instrument. Since a great portion of analytical data from the drug development process comes from stability studies, Chapter 16 is included to provide guidance to ensure proper environmental chamber qualification.
Computers have become a central part of the analytical laboratory. Therefore, we have dedicated the last two chapters to an introduction to this field of computer system and software validation. Chapter 17 guides quality assurance managers, lab managers, information technology personnel, and users of equipment, hard-ware, and software through the entire qualification and validation process, from writing specifications and vendor qualification to installation and to both initial and ongoing operations. Chapter 18 is an in-depth discussion of the approaches to validation of Excel spreadsheets, one of the most commonly used computer programs for automatic or semiautomatic calculation and visualization of data.
The authors of this book come from a broad cultural and geographical base of pharmaceutical companies, vendors and contract manufacturers and offer a broad perspective to the topics. I want to thank all the authors, co-editors, reviewers, and the management teams of Eli Lilly & Company, GlaxoSmithKline Canada, Inc., Patheon Canada, Inc., Novex Pharma, and Agilent Technologies who have contributed to the preparation of this book. In addition, I want to acknowledge Herman Lam for the design of the front cover, which clearly depicts the cGMP requirements for data generation.
1
OVERVIEW OF PHARMACEUTICAL
PRODUCT DEVELOPMENT AND ITS
ASSOCIATED QUALITY SYSTEM
C
HUNGC
HOWC
HAN, P
H.D.
Eli Lilly Canada, Inc.
E
RICJ
ENSEN, P
H.D.
Eli Lilly & Company, Indianapolis
1.1 INTRODUCTION
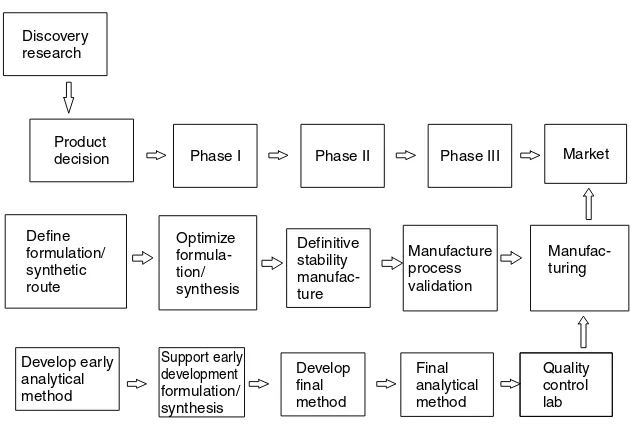
Pharmaceutical product development consists of a series of logical and system-atic processes. When successful, the final outcome is a commercially available dosage form. However, this process can become a long and complicated pro-cess if any of the steps lose their focus. The industry has undergone many changes over the years to increase focus on efficiency and efficacy of the devel-opment process. The overall cycle of pharmaceutical product develdevel-opment is summarized in Figure 1.1. The clinical study of drug development is the most obvious and best known to laypersons and scientists. However, many associated behind-the-scene activities are also actively pursued in a parallel and timely man-ner to ensure the success of pharmaceutical product development. Clinical and commercial success cannot be achieved without successful completion of these other activities. It is important to note that the clinical phase boxes in Figure 1.1 may not be aligned exactly chronologically with other development activities.
Analytical Method Validation and Instrument Performance Verification, Edited by Chung Chow Chan, Herman Lam, Y. C. Lee, and Xue-Ming Zhang
ISBN 0-471-25953-5 Copyright2004 John Wiley & Sons, Inc.
2 PHARMACEUTICAL PRODUCT DEVELOPMENT AND QUALITY SYSTEM
Product
decision Phase I Phase II Phase III
Define
Figure 1.1. Overview of the drug development process.
Historically, the time period for pharmaceutical drug product development is usually on the order of 10 to 15 years. However, with the ever-increasing com-petition between pharmaceutical companies, it is of utmost important to reduce the time utilized to complete the development process.
1.1.1 Discovery Research
In the discovery research phase of drug development, new compounds are created to meet targeted medical needs, hypotheses for model compounds are proposed, and various scientific leads are utilized to create and design new molecules. Thousands of molecules of similar structure are synthesized to develop a struc-ture –activity relationship (SAR) for the model. To reach this stage, large phar-maceutical companies rely on new technologies, such as combinatorial chemistry and high-throughput screening, which are cornerstones in drug discovery. The new technologies increase the choice of compounds that can be synthesized and screened. Various in vivo and in vitro models are used to determine the value of these new candidate compounds.
The sequencing of the complete human genome was completed in 2000 through the Human Genome Project, which was begun in 1995. Knowledge of the complete human genome will provide the basis for many possible targets for drug discovery through genomics, proteonomics, and bioinformatics.
1.1.2 Preclinical Phase
INTRODUCTION 3
undergo extensive testing to obtain initial safety and efficacy data in animal models. Upon completion of successful animal safety and efficacy evaluation, submission to appropriate regulatory bodies is made to gain approval to administer the first human dose in the clinical phase I trial.
1.1.3 Clinical Phases
The clinical phase I trial is used to assess the safety and, occasionally, the efficacy of a compound in a few healthy human volunteers. These studies are designed to determine the metabolism and pharmacological action of the drug in humans, the side effects associated with increasing doses, and if possible, to gain very early information on the drug’s effectiveness. Safety data from these trials will help determine the dosage required for the next phase of drug development. The total number of subjects in phase I studies is generally in the range 20 to 80.
Clinical phase II trials are conducted to evaluate the effectiveness of a drug for a particular indication or indications in patients with the targeted disease. These studies also help to determine the common short-term side effects and risks associated with the drug. Phase II studies are typically well controlled, closely monitored, and conducted in a relatively small number of patients, usually no more than several hundred.
Active Pharmaceutical Ingredient (API). In this early stage of drug devel-opment, only a small quantity of drug substance is needed. As development progresses into later stages, greater quantities of drug substance are needed and will trigger efforts to optimize the synthetic route.
Formulation Development. The formulation of the new drug product will be designed in conjunction with medical and marketing input. Excipients to be used will be tested for chemical and physical compatibility with the drug substance. The preliminary formulation design will be optimized at this stage.
Analytical Development of API and Drug Products. Early methods to sup-port synthetic and formulation developments are often developed in the form of potency assay, impurities/related substance assay, dissolution, Karl Fischer, iden-tity, chiral method, and content uniformity. These analytical methods are devel-oped and validated in a fast and timely manner to support all phase II studies.
4 PHARMACEUTICAL PRODUCT DEVELOPMENT AND QUALITY SYSTEM
Successful efficacy and safety data will guide the decision to proceed to clinical phase III in product development. In this stage, the new drug is administered to a larger population of patients using blinded clinical studies. These studies may demonstrate the potential advantages of the new compound compared with similar compounds already marketed. The data collected from this stage are intended to evaluate the overall benefit–risk relationship of the drug and to provide an adequate basis for labeling. Phase III studies usually include from several hundred to several thousand subjects and often include single- or double-blind studies designed to eliminate possible bias on the part of both physicians and patients. Positive data from this stage will trigger implementation of a global registration and commercialization of the drug product.
Impurities Level in New Drug Product. As the new drug product formulation progresses to this late stage of development, impurity profiles may differ from those of earlier formulations. The rationale for reporting and control of impurities in the new drug product is often decided at this stage as are recommended storage conditions for the product. Degradation products and those arising from excipient interaction and/or container closure systems will be isolated and identified. The impurity profile of the representative commercial process will be compared with the drug product used in development, and an investigation will be triggered if any difference is observed. Identification of degradation products is required for those that are unusually potent and produce toxic effects at low levels.
Primary and developmental stability studies help development scientists under-stand the degradation pathways. These studies are developed to get information on the stability of the drug product, expected expiry date, and recommended storage conditions. All specified degradation products, unspecified degradation products, and total degradation products are monitored in these studies.
Impurities in API. Treatment of the impurities in the API is similar to that for the new drug product. Impurities in the API include organic impurities (process and drug related), inorganic impurities, and residual solvents. Quality control analytical procedures are developed and validated to ensure appropriate detection and quantitation of the impurities. Specification limits for impurities are set based on data from stability studies and chemical development studies. A rationale for the inclusion or exclusion of impurities is set at this stage. The limits set should not be above the safety level or below the limit of the manufacturing process and analytical capability.
API Development. The synthetic route will be finalized and a formal primary stability study will be undertaken to assess the stability of the API.
QUALITY SYSTEM FOR THE ANALYTICAL DEVELOPMENT LABORATORY 5
1.1.4 Regulatory Submission
Successful completion of clinical phase III trial is a prerequisite for the final phase of drug development. The complete set of clinical, chemical, and analytical data is documented and submitted for approval by regulatory agencies worldwide. Simultaneous activities are initiated to prepare to market the product once reg-ulatory approval is received. As clinical phase III is still being conducted on a limited number of patients, postmarketing studies (phase IV) are often required by regulatory agencies to ensure that clinical data will still be valid. At this point, the company will initiate information and education programs for physi-cians, specialists, other health care providers, and patients as to the indications of the new drug.
1.2 QUALITY SYSTEM FOR THE ANALYTICAL DEVELOPMENT LABORATORY
As global regulatory requirements have become more similar as the result of deliberate harmonization, analytical methods for global products must be able to meet global regulatory requirements. Ideally, a method developed and vali-dated in the United States should not need to be revalivali-dated or require patchwork validation for use in Japan or Europe. The achievement of this objective is the responsibility of senior management and requires participation and commitment by personnel in many different functions at all levels within the establishment and by its suppliers. To achieve this objective reliably, there must be a com-prehensively designed and correctly implemented system of quality standards incorporating GMPs. It should be fully documented and effectively monitored. All parts of the quality systems should be adequately resourced with qualified personnel and suitable premises, equipment, and facilities. It is our intent in the second part of this chapter to give an overview of the extent and application of analytical quality systems to different stages of the drug development process.
1.2.1 Consideration for Quality Systems in Development
An important consideration in the development of quality systems in development is to ask the question: What business does development support? Develop-ment does not mean exclusively working to develop formulation or analytical methods; many activities are directly involved in support of clinical material production. Laboratory leadership has the responsibility to consider carefully the customers and functions of an analytical development department. As part of this consideration, several key questions are useful in defining the business and quality standards:
ž How does the larger organization view development?
ž How close to discovery is development?
6 PHARMACEUTICAL PRODUCT DEVELOPMENT AND QUALITY SYSTEM
ž Where are there major overlaps in activities and support?
ž What is the desirable quality culture for this organization?
ž Who are the primary customers of development’s outputs?
When a new molecule enters the development phase, in most cases only the basic information of the new chemical entity is known (e.g., molecular structure and polymorphic and salt forms). However, we do not know what will happen when it is formulated and stored at ordinary environmental conditions. In other words, there is a high degree of variability around what is “known” about the molecule and its behavior in a variety of systems. The basic task for development is to reduce this high variability by conducting a series of controlled experiments to make this information known and thus predictable. In fact, by the time a molecule reaches the significant milestone of launch into commercial activities, most of the behavior and characteristics of the molecule need to be known, predictable, and in control.
There are multiple paths to achieving the state when a product and a pro-cess are “in control.” A pictorial representation of this concept is shown in Figure 1.2. Simpler molecules may achieve a state of control (predictable state) early in the development process, while more complex molecules may retain a high state of “variability” until late in the process. The goal for development must be a development path that is documented and performed by qualified scientists, equipment, facilities, instruments, etc. Development paths that can be followed are varied, but the final outcome, when a project is transferred to manufacturing, is a product and a process that are in a well-characterized state of control.
1.2.2 GMPs Applied to Development
The original intent of the Good Manufacturing Practices (GMPs) was to describe standards and activities designed to ensure the strength, identity, safety, purity, and quality of pharmaceutical products introduced into commerce. Application of GMPs to development activities has evolved to the state where application of
Launch Development
systems
V
ariability
Manufacturing systems
QUALITY SYSTEM FOR THE ANALYTICAL DEVELOPMENT LABORATORY 7
the basic GMP principles is a common part of business practice for an increasing number of companies. However, the GMPs are silent on explicit guidance for the development phase in several areas. Thus, companies have been left to make their own determinations as to how to apply GMPs prior to commercial introduc-tion of products. More recently, the European Union (EU) and the Internaintroduc-tional Conference on Harmonization (ICH) have offered a variety of guidances in the development of API. The ICH Q7A GMP Guidance for APIs includes guidance for APIs for use in clinical trials. The EU Guideline Annex 13 provides much more specific guidance to the application of GMPs to investigational medicinal products. By extension, one can gain perspective on application of GMPs to the chemistry, manufacturing, and control (CM&C) development process since it is closely tied to the development, manufacture, and use of investigational medicinal products.
Regulatory bodies recognize that knowledge of the drug product and its ana-lytical methods will evolve through the course of development. This is stated explicitly in ICH Q7A: Changes are expected during development, and every change in production, specifications, or test procedures should be recorded ade-quately. The fundamental nature of the development process is one of discovery and making predictable the characteristics of the API or product. It is there-fore reasonable to expect that changes in testing, processing, packaging, and so on will occur as more is learned about the molecule. A high-quality sys-tem that supports development must be designed and implemented in a way that does not impede the natural order of development. It must also ensure that the safety of subjects in clinical testing is not compromised. The penultimate manufacturing processes must be supported with sufficient data and results from the development process so that the final processes will be supported in a state of control.
Processes that are created during development cannot achieve a full state of validation because the processes have not been finalized. Variation is an inherent part of this process, and it allows the development scientists to reach conclusions concerning testing and manufacturing after having examined these processes with rigorous scientific experiments and judgments. The goal for development is to arrive at a state of validation entering manufacturing.
If one looks at the various clinical stages of development, there is a ques-tion as to what practices should be in place to support phase I, II, or late phase III studies. An all-or-nothing approach to GMPs is not appropriate. There are certain fundamental concepts that must be applied regardless of the clinical phase of development. Examples of these include: (1) documentation, (2) change, (3) deviations, (4) equipment and utilities, and (5), training.
8 PHARMACEUTICAL PRODUCT DEVELOPMENT AND QUALITY SYSTEM
specific facility or product. The premise in this system is that activities in a phar-maceutical company can be organized into systems that are sets of operations and related activities. Control of all systems helps to ensure that the firm will produce drugs that are safe and that have the identity and strength and meet the quality and purity characteristics that are intended. The goal of this program’s activities is to minimize consumers exposure to adulterated drug products. A company is out of control if any of its systems is out of control.
The following six systems are identified to be audited in the FDA systems (GMP subparts are shown in parentheses):
Quality system (B, E, F, G, I, J, K) Facilities and equipment systems (B, C, D, J) Materials system (B, E, H, J) Packaging and labeling systems (B, G, J) Production system (B, F, J) Laboratory and control systems (B, I, J, K)
An analysis of the citations of each cGMP system reveals that two subparts are included in all the citations:Organization and Personnel (subpart B) andRecords
and Reports (subpart J). This analysis points to a fundamental precept in the
systems guidance. Having the right number of appropriately qualified personnel in place along with a strong documentation, records, and reports system are the foundation of success in implementation of cGMPs in a manufacturing operation. It therefore follows that the same principles apply to the development processes that lead to the successful implementation of manufacturing operations.
During the development process, it is important to control variables that affect the quality of the data that are generated and the ability to recreate the work. It is important to recognize that by its nature, the development process does not achieve a complete success rate. That is, many more molecules enter drug development than transit successfully to the market. Thus, it is reasonable to develop guidance and practices as to how much control and effort are put into key activities depending on the phase of development. For example, analytical methods used to determine purity and potency of an experimental API that is very early in development will need a less rigorous method validation exercise than would be required for a quality control laboratory method used in manufacturing. An early phase project may have only a limited number of lots to be tested; the testing may be performed in only one laboratory by a limited number of analysts. The ability of the laboratory to “control” the method and its use is relatively high, particularly if laboratory leadership is clear in its expectations for the performance of the work.
CONCLUSIONS 9
successful validation of a method to be used in support of a commercial product. The validation exercise becomes larger; more detailed, and collects a larger body of data to ensure that the method is robust and appropriate for use.
Similar examples apply to the development of synthetic and biochemical pro-cess for generation of API as well as experimental pharmaceutical products. These examples are familiar to scientists who work in the drug development business. Unexpected findings are often part of the development process. A suc-cessful quality system that supports this work will aid in the creation of an environment that ensures that this work is performed in an environment where the quality of the data and results are well controlled. Thus, one would expect strong emphasis on documentation systems and standards, employee training and qualification, equipment and instrument qualification, and utilities qualification. Controlling these variables provides a higher degree of assurance in the results and interpretation of results.
The culture around quality within the development business will make or break the success of the quality system of the business. It is important that the devel-opment process be described and mapped. The process should be documented and the process understood. The path that the development area will be taking begins with the decision to develop the molecule. Actions are needed to ensure that an appropriate quality system will be implemented and maintained. Financ-ing for the quality system should be given appropriate financial backup to ensure a functional system and not a minimal budget. The culture of the development area in the company should understand the full value of quality. It is wrong to focus solely on speed of development and work with the attitude of fixing quality issues as the process is developed while hoping that any problems that occur will never be found. Quality must include the willingness of development leadership to invest in systems and processes so that development can go rapidly.
It is important to recognize signs in the development laboratory which indicate that the quality system has been implemented successfully. The following list includes some of the observations that can be made easily if the quality system is functioning as intended.
1. Expectations are high for documentation and reports. This observation demonstrates the maturity of the scientists in the laboratory to think and practice good quality principles.
2. Processes for planning and conducting work are robust. 3. Project planning includes quality objectives.
4. The system is able to accommodate all types of molecules. 5. The development process is mapped and followed.
6. Leadership is actively involved.
1.3 CONCLUSIONS
10 PHARMACEUTICAL PRODUCT DEVELOPMENT AND QUALITY SYSTEM
2
POTENCY METHOD VALIDATION
C
HUNGC
HOWC
HAN, P
H.D.
Eli Lilly Canada, Inc.
2.1 INTRODUCTION
Assay as defined by the Japanese Pharmacopoeia is a test to determine the
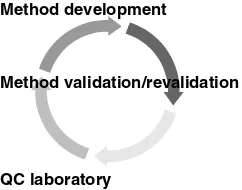
composition, the content of the ingredients, and the potency unit of medicine by physical, chemical, or biological procedures. This chapter focuses on validation of the potency assay by high-performance liquid chromatography (HPLC). Ana-lytical method development and validation involve a series of activities that are ongoing during the life cycle of a drug product and drug substance. Figure 2.1 summarizes the life cycle of an analytical method.
Analytical potency method development should be performed to the extent that it is sufficient for its intended purpose. It is important to understand and know the molecular structure of the analyte during the method development process, as this will facilitate the identification of potential degradation impurities. For example, an impurity of M+16 in the mass spectrum of a sample may indicate the probability of a nitrogen oxide formation. Upon successful completion of method development, the potency method will then be validated to show proof that it is suitable for its intended purpose. Finally, the method validated will be transferred to the quality control laboratory in preparation for the launch of the drug substance or drug product.
The method will be used in the manufacturing facility for the release of both drug substance and drug product. However, if there are any changes in the manufacturing process that have the potential to change the degradation pattern
Analytical Method Validation and Instrument Performance Verification, Edited by Chung Chow Chan, Herman Lam, Y. C. Lee, and Xue-Ming Zhang
ISBN 0-471-25953-5 Copyright2004 John Wiley & Sons, Inc.
12 POTENCY METHOD VALIDATION
Method development
Method validation/revalidation
QC laboratory
Figure 2.1. Life cycle of an analytical method.
of the drug substance and drug product, this validated method may need to be revalidated. This process of revalidation is described in more detail later in the chapter.
Whether it is a drug substance or a drug product, the final product will need to be analyzed to assess its potency or strength. The potency of a drug substance is typically reported as a percentage value (e.g., 98.0%), whereas a drug product is reported in terms of its intended concentration or label claim.
2.2 SCOPE OF CHAPTER
In this chapter we outline the general requirements for the HPLC potency method validation in pharmaceutical products. The discussion is based on method valida-tion for small-molecule pharmaceutical products of synthetic origin. Even though most of the requirements are similar for a drug substance, method validation for a drug substance is not discussed in detail in this chapter. The discussion focuses on current regulatory requirements in the pharmaceutical industry. Since the expectations for method validation are different at different stages of the product development process, the information given in this chapter is most suit-able for the final method validation according to International Conference on Harmonization (ICH) requirements to prepare for regulatory submissions [e.g., New Drug Application (NDA)]. Even though the method validation is related to HPLC analysis, most of the principles are also applicable to other analytical techniques [e.g., thin-layer chromatography (TLC), ultraviolet analysis (UV)].
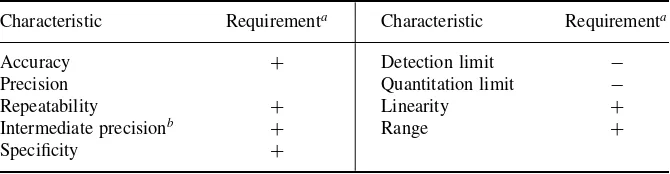
ICH Q2A [1] proposed the guidelines shown in Table 2.1 for the validation of a potency assay for a drug substance or drug product.
In this chapter we discuss the following topics regarding validation practices:
VALIDATION PRACTICES 13
Table 2.1. Guidelines for Drug Potency Assay
Characteristic Requirementa Characteristic Requirementa
Accuracy + Detection limit −
Precision Quantitation limit −
Repeatability + Linearity +
Intermediate precisionb + Range +
Specificity +
a+, Signifies that this characteristic is normally evaluated;−, signifies that this characteristic is not
normally evaluated.
bIn cases where reproducibility has been achieved, intermediate precision is not needed.
2.3 VALIDATION PRACTICES
Different approaches may be used to validate the potency method. However, it is important to understand that the objective of validation is to demonstrate that a procedure is suitable for its intended purpose. With this in mind, the scientist will need to determine the extent of validation required. It is advisable to design experimental work such that the appropriate validation characteristics be considered simultaneously to obtain overall knowledge of the capabilities of the analytical procedure.
2.3.1 Types of Quantitation
Quantitation by External Standard. This quantitation technique is the most straightforward. It involves the preparation of one or a series of standard solu-tions that approximate the concentration of the analyte. Chromatograms of the standard solutions are obtained, and peak heights or areas are plotted as a func-tion of concentrafunc-tion of the analyte. The plot of the data should normally yield a straight line. This is especially true for pharmaceuticals of synthetic origin. Other forms of mathematical treatment can be used but will need to be justified.
There are some potential instrumental sources of error that could occur using this quantitation technique. It is critical to have minimal variability between each independent injection, as the quantitation is based on the comparison of the sample and standard areas. However, the current autosamplers are able to minimize this variability to less than 0.5% relative standard deviation (RSD).
14 POTENCY METHOD VALIDATION
are plotted as a function of the concentration of the analyte. A plot of the data should normally yield a straight line.
Due to the presence of the internal standard, it is critical to ensure that the analyte peak be separated from the internal standard peak. A minimum of base-line separation (resolution >1.5) of these two peaks is required to give reliable quantitation. In addition, to quantitate the responses of internal standard accu-rately, the internal standard should be baseline resolved from any significant related substances and should have a peak height or area similar to that of the standard peak.
2.3.2 Standard Plots for Quantitation
In many instances in the pharmaceutical industry, drug products may be manu-factured in a variety of strengths (e.g., levothyroxine tablets in strengths of 50, 100, 150, 200, 500, and 750µg). To develop and validate these potency methods,
three strategies may be followed.
Single-Point Calibration. A method may be developed and validated using only one standard analyte concentration. The standard plot generated is used to assay the complete range of tablet strengths. This strategy should be adopted wherever possible due to the simplicity of standard preparation and minimal work for quantitation of the sample. However, this method will require different extraction and dilution schemes of the various drug product strengths to give the same final concentration that is in the proximity of the one standard analyte concentration.
Multiple-Point Calibration. Another strategy involves two or more standard con-centrations that will bracket the complete range of the drug product strengths. In this strategy it is critical that the standard plots between the two extreme concentration ranges be linear. Therefore, this is a valid calibration method as long as the sample solutions of different strengths are prepared within the con-centration range of the calibration curve. Its advantage is that different strengths can utilize different preparation procedures and be more flexible. Its disadvan-tage is that multiple weighing of standards at different concentrations may give a weighing error.
One Standard Calibration for Each Strength. The least favored method is to develop and validate using one standard concentration for each product strength. This situation will arise when the analyte does not exhibit linearity within a reasonable concentration range.
2.3.3 System Suitability Requirements for Potency Assay
VALIDATION PRACTICES 15
suitability, an integral part of analytical procedures, is based on the concept that
equipment, electronics, analytical operations, and samples constitute an integral system that can be evaluated. System suitability test parameters depend on the procedure being validated.
The following notes should be given due consideration when evaluating a system suitability sample.
1. System suitability is a measure of the performance of a given system on a given day within a particular sample analysis set.
2. The main objective of system suitability is to recognize whether or not system operation is adequate given such variability as chromatographic columns, column aging, mobile-phase variations, and variations in instru-mentation.
3. System suitability is part of method validation. Experience gained dur-ing method development will give insights to help determine the system suitability requirements of the final method. An example is the hydrolysis of acetylsalicylic acid to salicylic acid in acidic media. Separation of this degradation peak from the analyte could be one criterion for the system suitability of an acetylsalicylic acid assay.
4. A system suitability test should be performed in full each time a system is used for an assay. If the system is in continuous use for the same analysis over an extended period, system suitability should be reevaluated at appro-priate intervals to ensure that the system is still functioning adequately for its intended use.
5. System suitability should be based on criteria and parameters collected as a group that will be able to define the performance of the system. Some of the common parameters used include precision of repetitive injections (usually five or six), resolution (R), tailing factor (T), number of theoretical plates (N), and capacity factor (k′).
2.3.4 Stability Indicating Potency Assay
It is important to realize that the pharmaceutical regulators require that all potency assays be stability indicating. Regulatory guidance in ICH Q2A, Q2B, Q3B, and FDA 21 CFR Section 211 [1–5] all require the development and validation of stability-indicating potency assays. Apart from the regulatory requirements, it is also good scientific practice to understand the interaction of the drug with its physical environment. It is logical and reasonable that the laboratory validate methods that will be able to monitor and resolve degradation products as a result of the stability of the product with the environment. For drug substances, we may need to include synthetic process impurities.
16 POTENCY METHOD VALIDATION
also utilized for degradation studies. Usually, the target is to achieve 10 to 30% degradation. Creating more than 30% degradation will not be useful, due to the potential for secondary degradation. Secondary degradation occurs when the first degradation impurity degrades further. Furthermore, degrading the drug substance or drug product beyond 30% will not be meaningful, since this is unacceptable in the market place.
ICH Q2A suggested validation of the characteristics of accuracy, precision, specificity, linearity, and range for potency and content uniformity assay. A detailed discussion of each of these parameters is presented later in this chapter. Some examples of validation data are presented along with a brief critical dis-cussion of the data.
2.4 STRATEGIES AND VALIDATION PARAMETERS
The most important consideration for strategies of method validation is to design experimental work so that the appropriate validation characteristics are studied simultaneously, thereby minimizing the number of experiments that need to be done. It is therefore important to write some form of protocol to aid the planning process. Executing the experimental work without prior planning will be a disaster for the validation.
2.4.1 Linearity
The ICH defines the linearity of an analytical procedure as the ability (within a given range) to obtain test results of variable data (e.g., absorbance and area under the curve) which are directly proportional to the concentration (amount of analyte) in the sample. The data variables that can be used for quantitation of the analyte are the peak areas, peak heights, or the ratio of peak areas (heights) of analyte to internal standard peak. Quantitation of the analyte depends on it obeying Beer’s law and is linear over a concentration range. Therefore, the working sample concentration and samples tested for accuracy should be in the linear range.
Linearity is usually demonstrated directly by dilution of a standard stock solu-tion. It is recommended that linearity be performed by serial dilution of a common stock solution. Preparing the different concentrations by using different weights of standard will introduce weighing errors to the study of the linearity of the analyte (in addition to adding more work) but will not help to prove the linearity of the analyte. Linearity is best evaluated by visual inspection of a plot of the signals as a function of analyte concentration. Subsequently, the variable data are generally used to calculate a regression by the least squares method.
STRATEGIES AND VALIDATION PARAMETERS 17
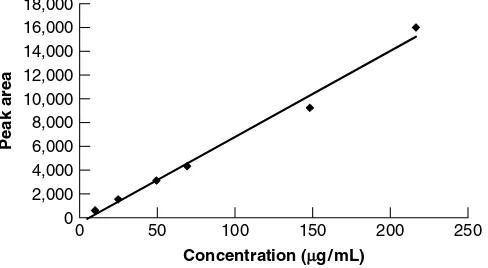
y-intercept should also be reported as required by the ICH. The slope of the regression line will provide an idea of the sensitivity of the regression and hence the method to be validated. The y-intercept will provide the analyst with an estimate of the variability of the method. For example, the ratio percent of the y-intercept with the variable data at nominal concentration are sometimes used to estimate the method variability. Figures 2.2 and 2.3 illustrate acceptable and nonacceptable linearity data, respectively.
2.4.2 Accuracy
The ICH defines the accuracy of an analytical procedure as the closeness of agreement between the values that are accepted either as conventional true val-ues or an accepted reference value and the value found. Accuracy is usually reported as percent recovery by assay, using the proposed analytical proce-dure, of known amount of analyte added to the sample. The ICH also rec-ommended assessing a minimum of nine determinations over a minimum of
Concentration
Response
10
0 2
15.00 10.00
5.00 0.00
4 6 8
Figure 2.2. Linearity with correlation coefficient greater than 0.997.
P
eak area
18,000 16,000 14,000 12,000 10,000 8,000 6,000 4,000 2,000 0
Concentration (µg /mL)
0 50 100 150 200 250
18 POTENCY METHOD VALIDATION
three concentration levels covering the specified range (e.g., three concentra-tions/three replicates).
For a drug substance, the common method of determining accuracy is to apply the analytical procedure to the drug substance and to quantitate it against a reference standard of known purity. For the drug product, accuracy is usually determined by application of the analytical procedure to synthetic mixtures of the drug product components or placebo dosage form to which known quantities of drug substance of known purity have been added. The range for the accuracy limit should be within the linear range. Typical accuracy of the recovery of the drug substance in the mixture is expected to be about 98 to 102%. Values of accuracy of the recovery data beyond this range need to be investigated.
2.4.3 Precision
The precision of an analytical procedure expresses the closeness of agreement
(degree of scatter) between a series of measurements obtained from multiple samples of the same homogeneous sample under prescribed conditions. Preci-sion is usually investigated at three levels: repeatability, intermediate preciPreci-sion, and reproducibility. For simple formulation it is important that precision be deter-mined using authentic homogeneous samples. A justification will be required if a homogeneous sample is not possible and artificially prepared samples or sample solutions are used.
Repeatability (Precision). Repeatability is a measure of the precision under the same operating conditions over a short interval of time. It is sometimes referred to as intraassay precision. Two assaying options are allowed by the ICH for investigating repeatability:
1. A minimum of nine determinations covering the specified range for the procedure (e.g., three concentrations/three replicates as in the accuracy experiment), or
2. A minimum of six determinations at 100% of the test concentration.
The standard deviation, relative standard deviation (coefficient of variation), and confidence interval should be reported as required by the ICH.
STRATEGIES AND VALIDATION PARAMETERS 19
Table 2.2. Repeatability at Different Concentration
Concentration
(Nominal Concentration 75µg/mL)
Replicate 14.8 29.6 44.5 74.5 149.1 223.7
1 97.9 98.3 97.6 98.3 98.7 98.6
2 98.0 98.4 97.5 98.2 98.2 98.5
3 98.2 98.5 99.6 99.1 98.1 99.0
4 97.9 98.8 99.1 98.8 97.7 98.8
5 98.4 98.5 97.8 99.0 98.0 99.2
6 99.1 98.6 98.4 98.3 98.1 98.7
Mean 98.3 98.5 98.3 98.6 98.1 98.8
% RSD 0.47 0.18 0.87 0.42 0.33 0.28
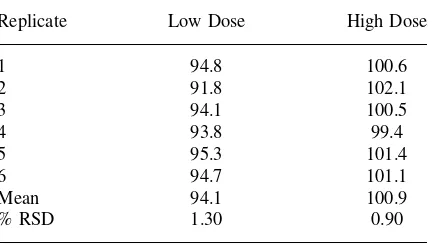
Table 2.3. Repeatability at High and Low Concen-trations
Replicate Low Dose High Dose
1 94.8 100.6
2 91.8 102.1
3 94.1 100.5
4 93.8 99.4
5 95.3 101.4
6 94.7 101.1
Mean 94.1 100.9
% RSD 1.30 0.90
Intermediate Precision. Intermediate precision is defined as the variation within the same laboratory. The extent to which intermediate precision needs to be established depends on the circumstances under which the procedure is intended to be used. Typical parameters that are investigated include day-to-day varia-tion, analyst variavaria-tion, and equipment variation. Depending on the extent of the study, the use of experimental design is encouraged. Experimental design will minimize the number of experiments that need to be performed. It is important to note that the ICH allows exemption from doing intermediate precision when reproducibility is proven. It is expected that the intermediate precision should show variability that is in the same range or less than repeatability variation. The ICH recommended the reporting of standard deviation, relative standard deviation (coefficient of variation), and confidence interval of the data.
20 POTENCY METHOD VALIDATION
and method transfer between different laboratories). To validate this character-istic, similar studies need to be performed at other laboratories using the same homogeneous sample lot and the same experimental design. In the case of method transfer between two laboratories, different approaches may be taken to achieve the successful transfer of the procedure. However, the most common approach is
thedirect method transfer from the originating laboratory to the receiving
labo-ratory. Theoriginating laboratory is defined as the laboratory that has developed and validated the analytical method or a laboratory that has previously been cer-tified to perform the procedure and will participate in the method transfer studies.
Thereceiving laboratoryis defined as the laboratory to which the analytical
pro-cedure will be transferred and that will participate in the method transfer studies. In direct method transfer it is recommended that a protocol be initiated with details of the experiments to be performed and acceptance criteria (in terms of the difference between the means of the two laboratories) for passing the method transfer. Table 2.4 gives a set of sample data where the average results obtained between two laboratories were within 0.5%.
2.4.4 Robustness
Therobustness of an analytical procedure is a measure of its capacity to remain
unaffected by small but deliberate variations in the analytical procedure param-eters. The robustness of the analytical procedure provides an indication of its reliability during normal use. The evaluation of robustness should be considered during development of the analytical procedure. If measurements are susceptible to variations in analytical conditions, the analytical conditions should be suitably controlled or a precautionary statement should be included in the procedure. For example, if the resolution of a critical pair of peaks was very sensitive to the percentage of organic composition in the mobile phase, that observation would have been observed during method development and should be stressed in the procedure. Common variations that are investigated for robustness include filter effect, stability of analytical solutions, extraction time during sample prepara-tion, pH variations in the mobile-phase composiprepara-tion, variations in mobile-phase composition, columns, temperature effect, and flow rate.
Table 2.5 shows examples of sample and standard stability performed on an analytical procedure. The two sets of data indicate that the sample and standard
Table 2.4. Results from Method Transfer between Two Laboratories
Runs Average %
Originating 12 100.7
laboratory
Receiving 4 100.2
STRATEGIES AND VALIDATION PARAMETERS 21
Table 2.5. Stability of Sample and Standard Solutions
% Initial
Day Sample Standard
1 100.2 99.8
2 100.0 99.8
3 99.9 100.2
4 — 99.5
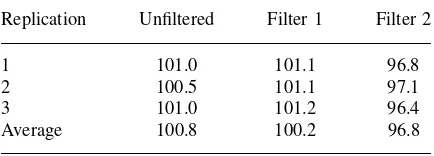
Table 2.6. Effect of Filter
Replication Unfiltered Filter 1 Filter 2
1 101.0 101.1 96.8
2 100.5 101.1 97.1
3 101.0 101.2 96.4
Average 100.8 100.2 96.8
solutions were stable for 3 and 4 days respectively. Table 2.6 gives some data on the effect of a filter on the recovery of the analytical procedure. In a filter study it is common to use the same solution and to compare a filtered solution to an unfiltered solution. For the unfiltered solution, it is common to centrifuge the sample solution and use the supernatant liquid for the analysis. The data set indicated that filter 1 would be recommended for the final analytical procedure.
2.4.5 Specificity
Specificity is the ability to assess unequivocally an analyte in the presence of
components that may be expected to be present. In many publications, selectivity and specificity are often used interchangeably. However, there are debates over the use of specificity over selectivity [6]. For the purposes of this chapter, the definition of specificity will be consistent with that of the ICH.
The specificity of a test method is determined by comparing test results from an analysis of samples containing impurities, degradation products, or placebo ingredients with those obtained from an analysis of samples without impurities, degradation products, or placebo ingredients. For the purpose of a stability-indicating assay method, degradation peaks need to be resolved from the drug substance. However, they do not need to be resolved from each other.
22 POTENCY METHOD VALIDATION
Analyte
Impurities
Sample solution
Impurity standard solution
Time (s)
200 280 360 440 520 600 680 760 840 920 1000
Response (mV)
50.000 80.000
77.000
74.000
71.000
68.000
65.000
62.000
59.000
56.000
53.000
Figure 2.4. Overlay chromatogram of an impurity solution with a sample solution.
experience with the analyte and the chemistry of the analyte, the scientist will be able to identify which of the impurities may be used as the critical pair.
2.5 POTENCY METHOD REVALIDATION
There are various situations during the life cycle of a potency method that require revalidation of the method.
1. During optimization of the formulation or drug substance synthetic process, significant changes may have to be introduced into the process. As a result, to ensure that the analytical method will still be able to analyze the poten-tially different profile of the drug substance or drug product, revalidation may be necessary.
2. The method was found to be deficient in some areas, such as precision and system suitability. This is especially important as the analytical laboratory gets more experience and more information as to the degradation profile of the sample as it progresses toward submission. If a new impurity is found that makes the method deficient, this method will need to be revalidated. 3. The composition and/or the final manufacturing process of a sample
ana-lyzed with the method have been modified after optimization.
COMMON PROBLEMS AND SOLUTIONS 23
2.6 COMMON PROBLEMS AND SOLUTIONS
In the following pages we summarize some of the common deficiencies of potency method validation. These common problems are grouped together into categories such as HPLC instrumentation, procedural steps, and miscellaneous errors.
2.6.1 HPLC Instrumentation Errors
Qualification of Instruments. The status of the qualification of HPLC and other equipment used for the analytical procedure must always be checked. This is a common error that can lead to reanalysis of the samples if discovered earlier, or repeating the entire experimental procedure if it was discovered after expiry of the sample solutions.
Vacuum Filtering of Mobile Phase. Vacuum filtering of the mobile phase should be avoided in a procedure that is very sensitive to the level of the organic in the mobile phase. Vacuum suction will evaporate the volatile organic portion during filtration (e.g., acetonitrile or methanol), and may lead to variation of the chromatography.
2.6.2 Procedural Errors
Expiry of Mobile Phase. Always check the expiry of mobile phase before use. This is one of the most common errors in an analytical laboratory.
Use of Ion-Pairing Reagents in Mobile Phase. It is usually recommended that if ion-pairing reagents are needed in a mobile phase, its concentration needs to be constant during a gradient run. Changes in ion-pairing concentration during an HPLC run will increase the likelihood of chromatographic variation between runs (e.g., retention time drifts and quantitation precision).
Quantitation of Salts (e.g., Hydrochloride and Sodium Salt). The quantitative result that is reported from the analysis of salts is usually reported with reference to the base of the analyte. The scientist will need to remember to incorporate a multiplier into the calculation to convert the salt data to the base data.
Stability of Standard and Sample Solutions. Appropriate stability of the standard and sample solutions will allow flexibility of the method to be used in a qual-ity control laboratory. For example, 4-day stabilqual-ity of the standard and sample solutions will allow investigation if problems arise during a weekend HPLC run.
24 POTENCY METHOD VALIDATION
Range in Validation of Linearity Is Smaller Than Precision and Accuracy. This error will invalidate the precision and accuracy data since the validation did not demonstrate the linearity of the analyte for the quantitation of precision and accuracy data.
2.6.3 Miscellaneous Errors
Validation Protocol. It is highly recommended to validate an analytical proce-dure using some form of validation protocol. Without a validation protocol, the scientist will have a tendency to vary the experiment during the course of the validation study. Getting into the habit of creating a validation protocol will also ensure that the scientist plans before starting the experiment.
Acceptance Criteria for Validation Parameter. It is highly recommended to set acceptance criteria prior to starting validation experiments. This will provide guidance to the validating scientist on the range of acceptability of the valida-tion results.
Documentation of Observation. It is very important to document all relevant observations during the experimental procedure. Observations are the most impor-tant information that can be used if an investigation is needed. Furthermore, observations that are documented provide evidence in the event of patent chal-lenge and other court cases.
Absorbance of Analyte. It is common to devise an experimental procedure that yields an analyte absorbance value of less than 1 absorbance unit. A high absorbance value (depending on the absorptivity of the analyte) is the result of a high concentration of the analyte. Too high a concentration of the analyte may overload the column and lead to nonlinearity.
2.7 SUMMARY OF POTENCY VALIDATION DATA
It is very useful to summarize all method validation data into a tabular format. The tabulated summary will give a quick overview of the validation data. Often, the analyst may be so involved during the actual validation work that some errors escaped detection. Table 2.7 is an example of how data can be recorded.
Table 2.7. Sample Validation Summary
ICH Validation
Characteristic Data Reported
Summary Validation Results
Accuracy The percent recovery assessed using a minimum of nine determinations over a minimum of three
concentration levels covering the range specified.
SUMMARY OF POTENCY VALIDATION DATA 25
Table 2.7 (continued)
ICH Validation
Characteristic Data Reported
Summary Validation Results
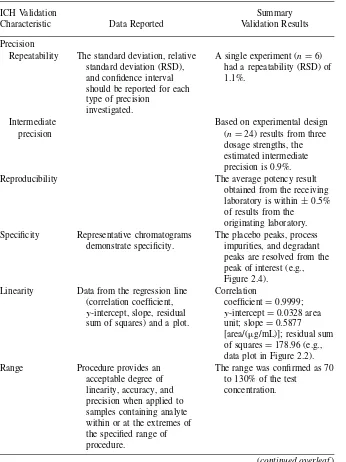
Precision
Repeatability The standard deviation, relative standard deviation (RSD), and confidence interval should be reported for each type of precision
investigated.
A single experiment (n=6) had a repeatability (RSD) of 1.1%.
Intermediate Based on experimental design
precision (n=24) results from three
dosage strengths, the estimated intermediate precision is 0.9%.
Reproducibility The average potency result
obtained from the receiving laboratory is within±0.5% of results from the peaks are resolved from the peak of interest (e.g., Figure 2.4).
Linearity Data from the regression line (correlation coefficient,
y-intercept, slope, residual sum of squares) and a plot.
Correlation data plot in Figure 2.2).
Range Procedure provides an
acceptable degree of linearity, accuracy, and precision when applied to samples containing analyte within or at the extremes of the specified range of procedure.
The range was confirmed as 70 to 130% of the test
concentration.
26 POTENCY METHOD VALIDATION
Table 2.7 (continued)
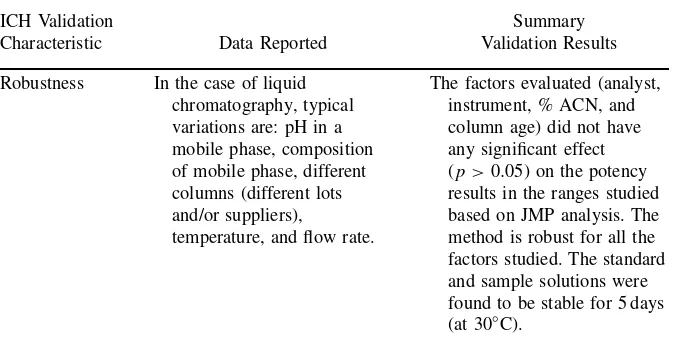
ICH Validation
Characteristic Data Reported
Summary Validation Results
Robustness In the case of liquid chromatography, typical variations are: pH in a mobile phase, composition of mobile phase, different columns (different lots and/or suppliers),
temperature, and flow rate.
The factors evaluated (analyst, instrument, % ACN, and column age) did not have any significant effect (p >0.05) on the potency results in the ranges studied based on JMP analysis. The method is robust for all the factors studied. The standard and sample solutions were found to be stable for 5 days (at 30◦C).
REFERENCES
1. ICH Harmonized Tripartite Guideline, ICH Q2A,Text on Validation of Analytical Pro-cedures, Mar. 1995.
2. CFR Part 211,Current Good Manufacturing Practice for Finished Pharmaceuticals. 3. ICH Harmonized Tripartite Guideline, ICH Q2B,Validation of Analytical Procedures:
Methodology, May 1997.
4. ICH Harmonized Tripartite Guideline, ICH Q3B, Impurities in New Drug Products, Oct. 1999.
5. Drugs Directorate Guidelines: Health Protection Branch, Health Canada,Acceptable
Methods, Ottawa, Ontario, Canada, 1994.
3
METHOD VALIDATION FOR
HPLC ANALYSIS OF RELATED
SUBSTANCES IN
PHARMACEUTICAL DRUG
PRODUCTS
Y. C. L
EE, P
H.D.
Patheon YM, Inc.
3.1 INTRODUCTION
In this chapter we outline the general requirements for analytical method valida-tion for HPLC analysis of related substances in pharmaceutical products. Most of the discussion is based on method validation for pharmaceutical products of synthetic origin. Even though most of the requirements are similar for other types of pharmaceutical drug products (e.g., biopharmaceutical drug products), detailed discussion of method validation for other types of pharmaceutical drug products is outside the scope of this chapter. The discussion focuses on current regulatory requirements in the pharmaceutical industry. Since the expectations for method validation are different at different stages of the product development process, the information given in this chapter is most suitable for final method valida-tion according to the ICH requirements to prepare for regulatory submissions (e.g., NDA). Even though the method validation is related to HPLC analysis, most of the principles are also applicable to other analytical techniques (e.g., TLC, UV).
Analytical Method Validation and Instrument Performance Verification, Edited by Chung Chow Chan, Herman Lam, Y. C. Lee, and Xue-Ming Zhang
ISBN 0-471-25953-5 Copyright2004 John Wiley & Sons, Inc.
28 METHOD VALIDATION FOR HPLC ANALYSIS OF RELATED SUBSTANCES
3.2 BACKGROUND INFORMATION 3.2.1 Definitions
Definitions for some of the commonly used terms in this chapter are given below.
ž Drug substance (active pharmaceutical ingredient): a pharmaceutical
active ingredient.
ž Related substances: impurities derived from the drug substance and
there-fore not including impurities from excipients. Related substances include degradation products, synthetic impurities of drug substance, and manufac-turing process impurities from the drug product.
ž Authentic sample: a purified and characterized sample of a related substance.
Unlike reference standards, authentic samples may not be of high purity. However, the purity of an authentic sample has to be determined before use. Authentic samples are used in method development to identify related substances in the analysis. In addition, they are used extensively to prepare the spiked samples in method validation.
ž Spiked sample: a sample added with a known amount of related substances,
prepared from authentic samples during method development or validation.
ž Control sample: a representative batch of drug substance (or drug product).
Typically, control samples are tested in all analyses to ensure consistency in method performance across different runs. Sometimes, they are used as part of the system suitability test to establish the run-to-run precision (e.g., intermediate precision, reproducibility).
ž Response factor: the response of drug substance or related substances per
unit weight. Typically, the response factor of drug substance (or related substance) can be calculated by the following equation:
Response factor= response(in response units) concentration(in mg/mL)
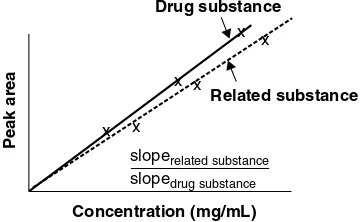
ž Relative response factor: the ratio of the response factor of individual related
substance to that of a drug substance to correct for differences in the response of related substances and that of the drug substance. It can be determined using the following equation:
Relative response factor= response factor of individual related substance response factor of drug substance
If a linearity curve (Figure 3.1) is constructed for both the related substance and the drug substance by plotting the response versus the concentration, the relative response factor can also be determined by