ScienceDirect
ScienceDirect
Aquatic Procedia 4 ( 2015 ) 925 – 932
2214-241X © 2015 The Authors. Published by Elsevier B.V. This is an open access article under the CC BY-NC-ND license (http://creativecommons.org/licenses/by-nc-nd/4.0/).
Peer-review under responsibility of organizing committee of ICWRCOE 2015 doi: 10.1016/j.aqpro.2015.02.116
INTERNATIONAL CONFERENCE ON WATER RESOURCES, COASTAL AND OCEAN
ENGINEERING (ICWRCOE 2015)
Flood Level Mitigation Study using 1-D Hydrodynamic Modeling
Raktim Haldar
a*, Rakesh Khosa
aaIndian Institute of Technology Delhi, New Delhi-110016, India
Abstract
The Lhasi Nadi is a tributary of the Andheri River, which is a tributary in the Chambal River basin, India. A specific part of the Lhasi catchment faces the risk of being flooded and this, in turn, restricts any industrial or residential development in the area. The present paper concerns with a study which aims to model the hydrodynamic transport of flood runoff in Lhasi and simulate, through numerical modeling, the maximum anticipated flood water levels that are likely to be realized at various locations along the course of river Lhasi corresponding to some identified extreme rainfall events having specified return periods. The study also aims at finding the specific reason for the occurrence of floods in the region and the possible measure to be taken so that there are no severe flood events in the coming future. The study proposes to use observed and indirect estimates of water levels at the Lhasi Railway Bridge site (a nearby location) following the flood event of July, 2000 as a benchmark for reference. In the process of study ArcGIS, SWAT (Soil and Water Assessment Tool) and MIKE (DHI) software packages have been used for the study. To understand the impact of bed geometry of Lhasi and flows in Andheri on the water surface profiles as they develop in Lhasi, hydrodynamic simulations of water surface profiles were derived for various flow scenarios and concluded in suggesting site specific preventive measures for the annual floods.
© 2015 The Authors. Published by Elsevier B.V.
Peer-review under responsibility of organizing committee of ICWRCOE 2015.
Keywords: Hydrodynamics, Modelling, Flood, River Training
* Corresponding author. Tel.: +91-11-2659-6366; fax: +91-11-2659-1117.
E-mail address: [email protected]
© 2015 The Authors. Published by Elsevier B.V. This is an open access article under the CC BY-NC-ND license (http://creativecommons.org/licenses/by-nc-nd/4.0/).
1.Introduction
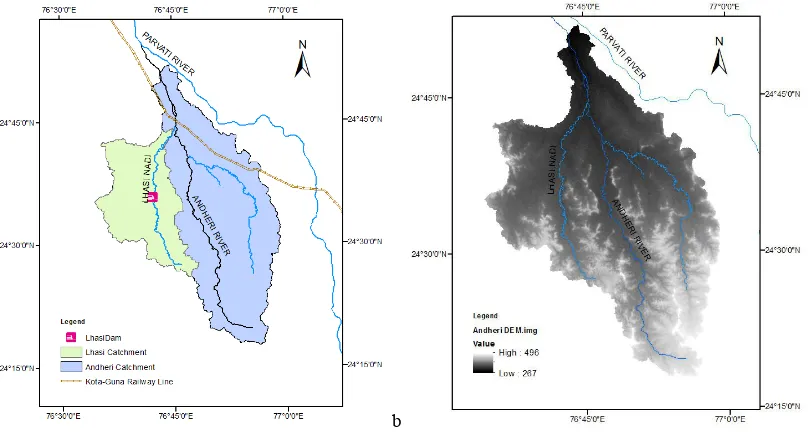
Hydrodynamic modeling has proven to be an economically sound and ecologically safe method for planning water resources development. Looking at the several advantages, both 1D and 2D modeling are done for different river systems, depending on the specific requirement of the study (Lin et al. 2006; Villazòn and Willems, 2009; Kadam and Sen, 2012). The Lhasi Nadi is a small tributary of the Andheri River, which in turn joins the Parvati River of the Chambal River system. The Lhasi Nadi lies in the state of Rajasthan and has a length of nearly 53km passing through the district of Baran. The river Andheri has its origin from the Guna district in Madhya Pradesh and merges into the Parvati River. Fig. 1(a) shows the two river basins of Lhasi and Andheri and the drainage network.
A thermal power plant was proposed to be constructed at a site which lies in the inundation plain of river Lhasi. Therefore, the problem statement was how to prevent the area from being flooded in the monsoons. The stream is a non-perennial one but its floodplain during the rainy season covers a huge area. The site lies just downstream of the point where the river is crossed by a bridge which carries the railway line.
Flood can be a serious problem for the thermal plant. Hence some solution had to be found for the problem. Protection from floods is generally provided by structural measures such as a reservoir, levees or a combination of both. It is wise to find a suitable measure for flood mitigation through modeling. Topographic data forms the basic requirement for hydrodynamic flood modeling. For this study Digital Elevation Model (DEM) received from Advanced Spaceborne Thermal Emission and Reflection Radiometer (ASTER) (Reuter et al. 2009) was used. The ASTER DEM has a spatial resolution of 30 meters. Fig. 1(b) shows the ASTER based DEM of the study basin.
A dam was proposed on the Lhasi Nadi so that the flow in the river can be regulated as well as stored. This paper illustrates the hydrologic and hydrodynamic model setup of the rivers Lhasi and Andheri which served as a prerequirement for the design of the thermal power plant.
a b
Fig. 1. (a) Catchment delineation of Andheri River and its tributary stream Lhasi Nadi; (b) Topography of the study region (ASTER DEM)
2.Analysing the Rainfall Data
Daily India Meteorological Department (IMD) gridded rainfall data 1° x 1° for the period 1951 to 2004 (Rajeevan et al. 2006) was analyzed for the basin area. Annual Maximum 1-day, 2-days, 3-days, 4-days and 5-days rainfall series was derived from the time series and investigated for magnitude vs exceedance probability relationship using standard hydrologic frequency analysis techniques. The extreme recorded rainfall values for durations ranging from 1-day upto a maximum of 5-days are presented in Table 1 along with the dates on which these extreme events occurred.
Table 1. Gridded maximum 1-day to 5-days rainfall values RAINFALL DURATION RAINFALL (MM) DATES
MAX 1-Day 230.9 21ST JULY, 2000 MAX 2-Days 302.5 20TH-21ST JULY, 2000 MAX 3-Days 351.7 8TH– 10TH AUGUST, 1985 MAX 4-Days 415.5 28TH– 31ST DECEMBER, 2001 MAX 5-Days 495.2 27TH– 31ST DECEMBER, 2001
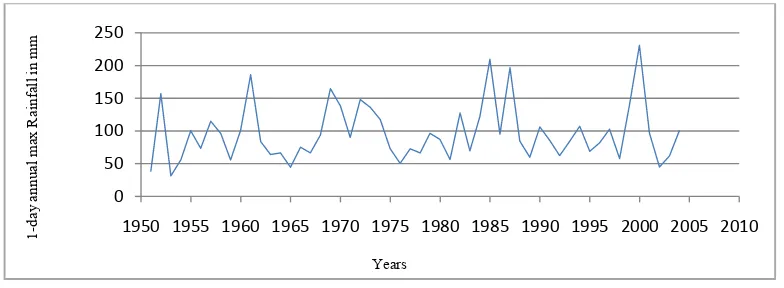
The series of Annual Maximum rainfall depths for the selected durations was investigated for possible presence of outliers that do not share observed characteristics of the rest of the rainfall values. The investigation did not reveal presence of these outliers in the data available for study. Following the screening study of the annual maximum rainfall, a detailed frequency analysis of the rainfall series was carried out by fitting various statistical distributions. The annual maximum 1-day series is plotted in Fig. 2.
Fig. 2. Annual 1-day maximum precipitation series for the Lhasi catchment
The study essentially establishes that the recorded extreme rainfall events of durations ranging from 1 day to 5 days have a return period of around 50 years and share similar characteristics as the rest of the data. Analysis shows that the statistical properties of the data are explained in adequate detail by Log Normal and PT-III distributions and to a somewhat lesser degree by GEV distribution.
Additionally, based on the examination of gridded rainfall data, critical periods were identified for detailed scrutiny. These periods correspond to periods when maximum 1-Day, maximum 2-Day, maximum 3-Day, maximum 4-Day and maximum 5-Day rainfalls have been recorded. These critical periods are given hereunder as follows:
Critical Period 1: 1st June, 2000 to 31st October, 2000 Critical period 2: 1st June, 2001 to 31st December, 2001
0
1950 1955 1960 1965 1970 1975 1980 1985 1990 1995 2000 2005 2010
1-3.Rainfall-runoff model using SWAT
The second part of the study consisted of the rainfall-runoff transformation which was possible through the ArcSWAT interface. The SWAT model (Arnold et al. 1998) is a long-term, continuous model for watershed simulation. It operates on a daily time step and is designed to predict the impact of management on water, sediment, and agricultural chemical yields in the stream. The model is physically based, computationally efficient, and capable of simulating a high level of spatial details by allowing the watershed to be divided into a large number of sub-watersheds. The model is one of the most popular globally used and accepted models and has been validated for several watersheds in India and abroad.
3.1. Data Requirement for Modelling
The data required for modeling the basin includes both (i) spatial data; as well as (ii) dynamic data.
3.1.1.Spatial Data
Spatial data required for the study area include:
x Digital Elevation Model
x Soil maps and associated soil characteristics (source: FAO Global soil)
x Land use (source: Global landuse)
3.1.2. Dynamic Data
The hydro-meteorological data pertaining to the river basin is required for modeling the catchment which has been taken from the IMD. In the absence of other daily weather data on solar radiation, wind speed and relative humidity, long term statistics have been used to generate these weather parameters.
3.2. SWAT Results for some selected sites on Lhasi and Andheri
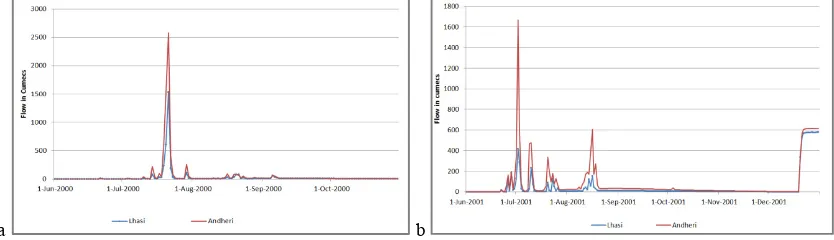
Daily runoff at various locations on the rivers Lhasi and Andheri was simulated for a 35-year period from 1st January, 1970 to 31st December, 2004. Fig. 3 (a) and (b) present a plot of the derived runoff simulations for the two rivers for the period 1st June, 2000 to 31st October, 2000 and for the period 1st June, 2001 to 31st December, 2001. These simulated flows have been used in the hydrodynamic study for which results are presented in the text that follows.
a
b
Fig. 3. SWAT model results for the period (a) 1st June, 2000 to 31st October, 2000; (b) 1st June, 2001 to 31st December, 2001
4.MIKE Model for hydrodynamic modeling
2009). The comparison of the cross-sections extracted from the ASTER DEM with the surveyed ones revealed a discrepancy of 6.1m in the invert levels at a reference cross section just downstream of the Railway Bridge. Appropriately, the DEM derived levels were raised uniformly by 6.1m in order to match the levels with those received from the surveyed data.
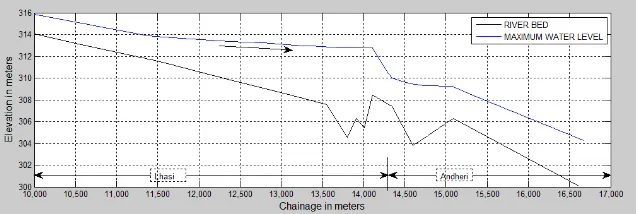
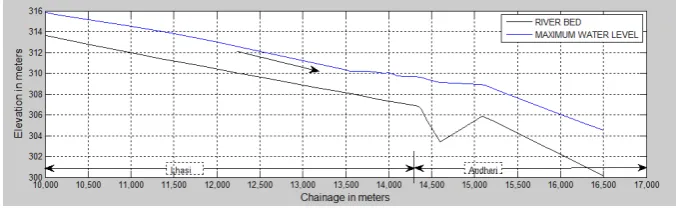
As a first step, the modeling parameters were tuned to recreate the scenario observed during past extreme rainfall events (identified above as critical period) that resulted in water profile in the river at the Railway Bridge crossing attaining a level of over 312.5m. For this purpose, the simulated time series of daily runoff, as derived for a total of 35 years at sites distributed across Lhasi and Andheri sub-basins, were used as input. Fig. 4 and 5 show the longitudinal view of maximum water levels simulated after model calibration for the years 2000 and 2001 respectively. In these figures, the x-axis shows the chainage in meters, starting with the value 10,000 m and ending around 16,600 m. The stretch from 10,000 to 14,300 m shows the stretch of 4,300 meters of the Lhasi reach before its joining the river Andheri. Whereas from chainage 14,300 to 16,600 m, next 2,300 meters) it is the portion of Andheri reach from confluence of Lhasi to its merging with river Parvati. The zero of the x-axis lies at an upstream point along the river Lhasi located at the Lhasi Dam.
Fig. 4. Hydrodynamic simulation of maximum water levels in river Lhasi (simulation period from 1st June, 2000 to 31st October, 2000)
Fig. 5. Hydrodynamic simulation of maximum water levels in river Lhasi (simulation period from 1st June, 2001 to 31st December, 2001)
Further scrutiny of results, as seen from Fig. 4 and 5, indicate the following:
x The bed profile of Lhasi dips below the bed level of Andheri just upstream of the site of confluence thereby suggesting a possible enhanced impedance to transport of flood runoff from Lhasi to Andheri.
x From the depicted water surface profiles, the water surface slope just upstream of the point of confluence is conspicuously lower suggesting possible backwater effects.
Fig. 6. Hydrodynamic simulation of maximum water levels in river Lhasi (simulation period from 1st June, 2000 to 31st October, 2000)
Fig. 7. Hydrodynamic simulation of maximum water levels in river Lhasi (simulation period from 1st June, 2001 to 31st December, 2001)
Examination of Fig. 6 and 7 reveal that the maximum water levels, as simulated by the hydrodynamic model for the scenario based on an assumed raised bed profile, are lower by almost 0.5m as compared with the simulations based on the bed profile as is it exists (i.e. without any intervention/alteration).
As a next step, the role of a possible enhancement in the conveyance of the reach of river Lhasi was also investigated. The strategy adopted for this purpose comprises of the following interventions:
(i) Adopt the raised bed profile as in the previous scenario.
(ii) Train the reach of Lhasi for a distance of 850m to a maximum width of 100m for the portion.
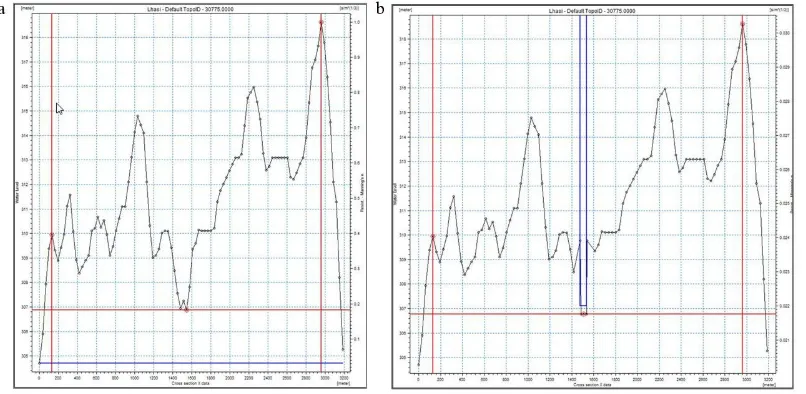
The results of the hydrodynamic simulation of water surface profiles for scenario based on this intervention is presented below in Fig. 8 and 9. The shape of the trained cross-sections is trapezoidal having a base of nearly 60 meters. One of the trained cross sections is shown in Fig. 10.
Fig. 9. Hydrodynamic simulation of maximum water levels in river Lhasi (simulation period from 1st June, 2001 to 31st December, 2001)
Results presented in Fig. 8 and 9 show remarkable improvement in terms of the impact that the proposed intervention has on the water surface profile. It is seen that the maximum water levels that result in response to both the adopted extreme rainfall events are restricted to less than 310m.
Fig. 10. Proposed modification in river cross section at location near the flood risk area (a) before modification (b) after modification
After making the two changes in the river morphology, a few additional scenarios of flow simulations were done in order to verify the highest flood levels possible in the vulnerable parts of the study area.
5.Conclusion
finding that training the river for a length of less than one kilometre would change the bed morphology in such a way that would help in mitigating the flood risk level of the zone.
Acknowledgements
We are grateful to Mr. Dipankar Mazumdar, Mr. D.K. Singh, Mr. R. K. Jain, Mr. G.V. Rao, Mr. Vivek Kapoor and Mr. Ravishankar from M/S Adani Power Rajasthan Ltd.; Mr. Chakresh Sahu, Mr. Nagraj Patil and Mr. Shobit Pipil from IIT Delhi and Mr. Prashant Kadam from DHI India for their valuable contribution and guidance. We also thank Dr. Deva Pratap from NIT Warangal and Dr. Dwarakish G S from NIT Karnataka for their useful suggestions.
References
Arnold, J.G., Srinivasan, R., Muttiah, R.S., Williams, J.R., 1998. Large area hydrologic modeling and assessment part I: Model development. Journal of the American Water Resources Association, 34(1).
DHI, M., 2009. A Modelling System for Rivers and Channels. Reference Manual. DHI Software.
Kadam, P., Sen, D., 2012. Flood inundation simulation in Ajoy River using MIKE-FLOOD. ISH Journal of Hydraulic Engineering, 18(2): 129-141.
Lin, B., 2006. Integrating one-and two-dimensional hydrodynamic models for flood simulation. River Basin Management: Progress Towards Implementation of the European Water Framework Directive: 369.
Rajeevan, M., Bhate, J., Kale, J., Lal, B., 2006. High resolution daily gridded rainfall data for the Indian region: Analysis of break and active monsoon spells. Current Science, 91(3): 296-306.
Reuter, H.I., Nelson, A., Strobl, P., Mehl, W., Jarvis, A., 2009. A first assessment of Aster GDEM tiles for absolute accuracy, relative accuracy and terrain parameters, Geoscience and Remote Sensing Symposium, 2009 IEEE International, IGARSS 2009. IEEE, pp. V-240-V-243. Villazón, M., Willems, P., 2009. The importance of spill conceptualizations and head loss coefficients in a quasi two-dimensional approach for