Supplement Article
Diet, growth, and obesity development throughout childhood
in the Avon Longitudinal Study of Parents and Children
Pauline M. Emmett and Louise R. Jones
Publications from the Avon Longitudinal Study of Parents and Children covering diet, growth, and obesity development during childhood are reviewed. Diet was assessed by food frequency questionnaires and food records. Growth data were collected by routine measurements, and in standardized clinics, body fatness was assessed by bioelectrical impedance and DXA (dual-energy X-ray absorptiometry) scans. Diets changed dramatically during the preschool period with an increase in the intake of free (added) sugars (12.3% rising to 16.4% of energy) that remained similar until adolescence. This was due to increased intake of energy-dense, nutrient-poor foods. Two periods of rapid growth were identified; infancy and mid-childhood (ages 7–11 y) and both were associated with obesity development. Diets with high energy density were associated with increasing fat mass from mid-childhood until adolescence. Genetic and dietary factors showed independent associations with increasing adiposity. At all ages studied, there were dietary inequalities related to maternal educational attainment that may influence inequalities found in obesity development. The Avon Longitudinal Study of Parents and Children has provided valuable insights into how disparities in diet and growth may affect the development of ill health in adulthood.
INTRODUCTION
A balanced diet in childhood is very important to en-sure optimum growth and development at a time of rapid growth. Poor diet has been associated with many adult health conditions, such as coronary heart disease, diabetes, and some cancers.1–3 Establishing and main-taining healthy eating habits is important because habits formed in early life are likely to continue into adult-hood.4 The Bogalusa Heart Study found that coronary atherosclerosis and essential hypertension can begin in childhood.5,6 Other work has shown that childhood fruit consumption may have a long-term protective effect on cancer risk in adulthood.7 Therefore, an understanding of how dietary habits develop during
childhood and adolescence would be informative, espe-cially for establishing critical points for intervention to prevent the development of later health problems.
Obesity is a chronic health condition that can man-ifest itself well before adulthood, and there has been a rapid rise in the prevalence of childhood obesity in re-cent years in the Western world.8–10There is evidence that rapid weight gain in early childhood is predictive of the development of obesity during childhood.11 It may be that early childhood is important because it is when particular dietary habits and sedentary behavior patterns become established.12 In later childhood and adolescence, promoting a healthy lifestyle with a bal-ance between diet and physical activity is essential to ar-rest obesity development.13 In particular, the World
Affiliation:P.M. Emmettis with the Centre for Child and Adolescent Health, School of Social and Community Medicine, University of Bristol, Bristol, United Kingdom.L.R. Jonesis with the School of Social and Community Medicine, University of Bristol, Bristol, United Kingdom. Correspondence:P. Emmett, Centre for Child and Adolescent Health, School of Social and Community Medicine, University of Bristol, Oakfield House, Oakfield Grove, Bristol, BS8 2BN, UK. E-mail: [email protected]. Phone:þ44-117-3310195.
Key words: ALSPAC, childhood diet, diet, energy density, fat mass, fruit and vegetables, growth, inequality, obesity, sugar. VCThe Author(s) 2015. Published by Oxford University Press on behalf of the International Life Sciences Institute.
Health Organization has identified the energy density of diets and their fiber content as important factors for determining obesity risk.1
The Avon Longitudinal Study of Parents and Children (ALSPAC) has collected comprehensive die-tary information and growth measures throughout childhood and has followed obesity development into adolescence. In this respect, it has a unique combina-tion of longitudinal data collected by hands-on standardized procedures, as well as from parental or self-completed questionnaires and routine community and health service assessments. This review aims to amalgamate the publications that used ALSPAC data and covered childhood diet, growth, and obesity devel-opment. It includes all published articles that examine food and nutrient intakes throughout the childhood of the cohort and those that relate diet and growth to obe-sity and other markers of health. The relationship of diet, growth, and obesity development with socioeco-nomic background (SEB) is explored. The diet and growth data were collected from the same children at set ages ranging from preschool to mid–secondary school age. Other reviews in the supplement of which this article is a part cover the pregnancy diet and the di-etary patterns in the ALSPAC. A review of the ALSPAC’s contribution to the understanding of infancy diet and growth is published elsewhere.14
LITERATURE AND STUDY METHODS
Literature
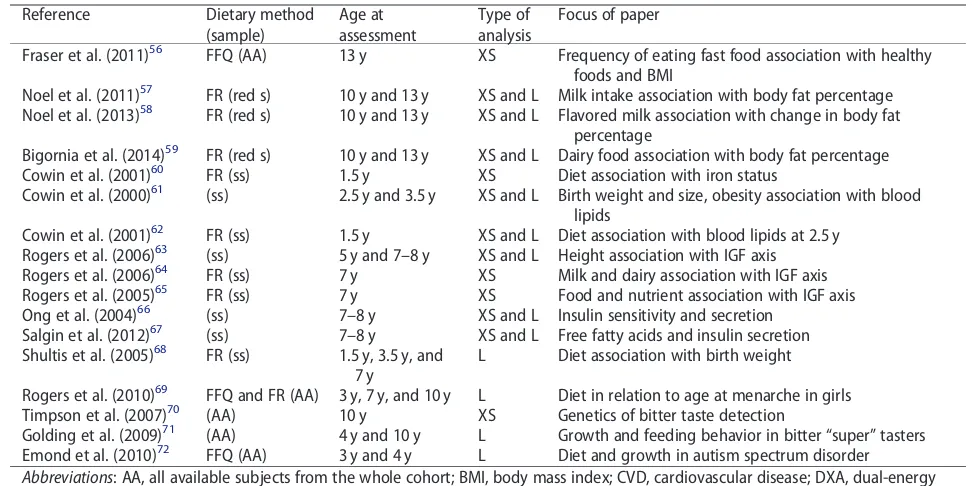
This narrative review includes all articles using data from the ALSPAC that deal with dietary intake, growth, and obesity development between the ages of 1.5 and 15 years. The included articles are listed inTable 1. Of the 57 articles identified15–72 4 used dietary questionnaire data, 28 used food record data, 8 assessed growth, 32 as-sessed obesity by body mass index (BMI) or fat mass, and 8 focused on diet and growth in relation to other health outcomes.
Subjects
The ALSPAC is a birth cohort study that recruited preg-nant women resident in 3 health districts surrounding the city of Bristol in the county of Avon, in southwest England, with an expected delivery date between April 1991 and December 1992 (n¼14 541 pregnancies).73,74 It was set up to investigate the ways in which genes and the environment, including diet, interact to affect the health, behavior, and development of children. Ethical approval for the study was obtained from the ALSPAC Law and Ethics Committee and the local research ethics
committees. The cohort was population based and broadly representative, at recruitment, of the population of women with children aged <1 year in Avon.74The
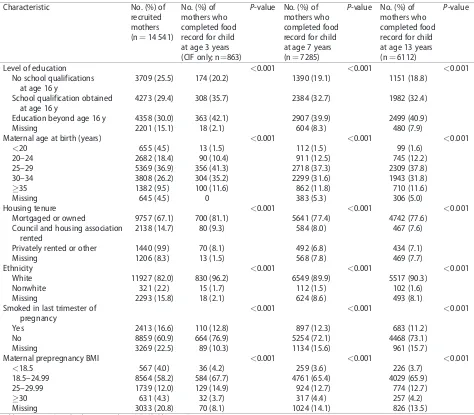
indicators of the SEB of the family at recruitment are shown in Table 2. The children (n¼14 062 at birth; n¼13 988 alive at 1 y) have been followed using ques-tionnaires completed by parents and the children, edu-cational records, and hands-on assessment at dedicated research clinics.73A proportion of children born in the last 6 months of the recruitment phase (equivalent to 10% of the whole cohort) was selected to take part in a substudy known as Children in Focus (CIF).73Parents of these children were invited to bring their child to re-search clinics at intervals from age 4 months to age 5 years (n¼1432 ever attended). When the children were aged 7 years, the whole cohort was invited to attend the research clinic. At this age, an attempt was made to bol-ster the initial sample with eligible subjects who failed to join the study originally; 713 additional children (from 706 pregnancies) were recruited (total child co-hort: n¼14 701 alive at 1 y). The clinic evaluations were repeated annually until age 15 years. The ALSPAC website contains details of all of the data that are available through a fully searchable data dictionary.75
Table 2 also shows the SEB of the mothers who
com-pleted a food record for their CIF child at age 3 years and the SEB of mothers of children who attended the research clinic and kept food records at ages 7 years and 13 years in comparison with the originally recruited mothers. The retained mothers have higher education attainment, are older, and have more favorable health indicators than mothers whose children did not com-plete the follow-ups.
Dietary assessment
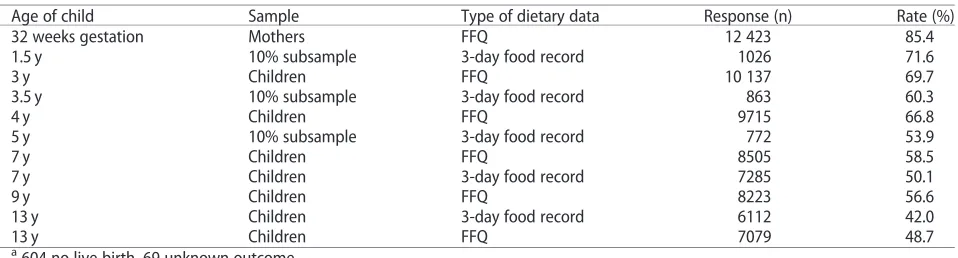
Table 3shows the timing and response rates for the
col-lection of the dietary data by food frequency question-naire (FFQ) and food record.
Food frequency questionnaire
Table 1Characteristics of the ALSPAC articles included in the present review
Reference Dietary method
(sample)
Age at assessment
Type of analysis
Focus of paper
Cowin et al. (2000)15 FR (ss) 1.5 y XS Diet description and adequacy
Emmett et al. (2002)16 FR (ss) 1.5 y and 3.5 y XS and L Diet description and adequacy Change in foods and nutrients
Glynn et al. (2005)17 FR (ss) 7 y XS Diet description and adequacy
Sex differences
Cribb et al. (2011)18 FR (AA) 10 y XS Diet description and adequacy
SEB differences
Misreporting of energy intake (EI) Anderson et al. (2013)19 FR and FFQ (AA) All ages 3–13 y XS and L Trajectory of EI by multilevel modeling
Prepregnancy BMI and childhood EI EI and child BMI at 15 y
Rogers et al. (2003)20 FR (ss) 1.5 y XS SEB food and nutrient differences
Rogers et al. (2002)21 FR (ss) 1.5 y and 3.5 y XS and L Fat intake quartiles association with foods and nutrients Rogers et al. (2001)22 FR (ss) 1.5 y and 3.5 y XS and L Fat intake quartiles association
with growth and obesity, iron status and blood lipids Cribb et al. (2013)23 FR (ss) 1.5 y and 3.5 y XS and L Vitamin A and carotene
Core and noncore foods Cribb et al. (2014)24 FR (ss) 1.5 y and 3.5 y XS and L Vitamin D and calcium
Fortification model
Sayers et al. (2012)25 (AA) Mid-childhood Vitamin D status and cortical bone
Johnson et al. (2007)26 FR (ss) 5 y and 7 y XS and L Dietary energy density associations
with nutrients; misreporting of energy intake; tracking of intake and association with fat mass at 9 y
Johnson et al. (2009)27 FR (AA) 10 y XS Energy density andFTOgenotype association with fat mass
Jones et al. (2010)28 FR (AA) 7 y; Maternal FFQ XS Fruit and vegetable intake Johnson et al. (2007)29 FR (ss) 5 and 7 y XS and L Drinks description and SEB;
association with fat mass at 9 y Jago et al. (2010)30 FR (AA) 10 y; physical
activity 11 y
XS Dietary association with physical activity
Noel et al. (2010)31 FR (red s) 13 y; physical activity 13 y
XS Use of measured physical activity for estimation of misreporting
More et al. (2014)32 FR (ss) 1.5 y and 3.5 y XS Portion sizes and foods consumed
Rogers et al. (2007)33 FR (ss) 7 y XS School meals dietary intake
Wright et al. (2008)34 (ss) Birth to 5 y XS Growth standards compared
Reilly et al. (2000)35 (AA) 7 y XS Use of BMI to identify obesity
Reilly et al. (2010)36 (AA) 9 y XS BMI and waist circumference association with fat mass
from DXA
Sherriff et al. (2009)37 (AA) 7–11 y XS and L Fat and lean mass association with fitness and grip strength
Reilly et al. (2010)38 (ss) 11 y XS Validation of fat mass measurements
Hughes et al. (2011)39 (ss) Birth to 15 y L Timing of excess weight gain
Din et al. (2013)40 (AA) Birth to 13 y L Timing of periods of weight gain
Rogers et al. (2006)41 (AA) 9 y L Birth weight and ponderal index association with fat and
lean mass at 9 y
Howe et al. (2010)42 (AA) Birth to 15 y L Dponderal index andDBMI association with fat mass at 15 y
Ong et al. (2009)43 (AA) Girls only, birth to 9 y
L Infancy weight gain association with BMI and fat mass, overweight
McCarthy et al. (2005)44 (ss) 2.5–5 y L Change in BMI and waist circumference
Reilly et al. (1999)45 (ss) 4 and 5 y XS Obesity prevalence
Hughes et al. (2011)46 (AA and ss) 3–15 y L Incidence of obesity
Reilly et al. (2011)47 (AA) 7–13 y L Progression from overweight to obesity
Wright et al. (2010)48 (AA) 7–11 y L Tracking of fatness and obesity
Reilly et al. (2005)49 (AA and ss) 7 y XS and L Risk factors for obesity
Sovio et al. (2011)50 (AA) Birth to 10 y MA FTOgenotype and BMI
Howe et al. (2012)51 (AA) Birth to 10 y L SEB differences in height trajectories Howe et al. (2010)52 (AA) Birth to 10 y L SEB differences in adiposity trajectory
Howe et al. (2010)53 (AA) 9 y and 10 y XS SEB differences in CVD risk
Dorosty et al. (2000)54 FR (ss) 1.5 y XS and L Adiposity rebound and diet, association with parental obesity
Timpson et al. (2008)55 FR (AA) 10 y XS Diet association withFTOgene
combined. Maternal diet was assessed again 4 years af-ter the birth of the study child using the modified FFQ. Copies of all the questionnaires used are available on-line.78 For foods/drinks not usually consumed every day, the person was asked to indicate how often the food was consumed currently, using the following op-tions: 1) never or rarely; 2) once in 2 weeks; 3) 1–3 times a week; 4) 4–7 times a week; and 5) more than once a day. For frequently eaten foods, there were more detailed questions, such as how many cups of tea or cof-fee were consumed, how much milk and sugar were used in each cup, the number of slices of bread con-sumed each day, on average, and how many slices were spread with butter/margarine. Questions also covered the usual type of milk (full fat or other), the usual type of bread (white, brown, or wholemeal), and the usual type of spread (butter/margarine or other) consumed. To calculate the amount of each food consumed per week, the frequency questions were converted as fol-lows: 1) 0; 2) 0.5; 3) 2; 4) 5.5; and 5) 10 times per week. Consumption of tea, coffee, bread, milk, and fat spreads was recorded on a daily rather than a weekly basis. No questions were asked about portion sizes; therefore, standard portion sizes79,80tailored to the age of the per-son being assessed were used for the nutrient estima-tions. Nutrient intakes were calculated based on the frequency with which each food was consumed and the nutrient content of a portion of that food.76To avoid including outliers with abnormally high or low intakes, at each age subjects with very high or very low intakes
of energy were removed from the nutrient analysis after inspection of the histogram for energy intakes at that age (between 220 and 330 subjects excluded).
Food records
Food records were collected 6 times between the ages 1.5 years and 13 years, as listed inTable 3. Diet was as-sessed by parental completion of a food record in the CIF subsample at ages 1.5, 3.5, and 5 years15,16and in the whole ALSPAC cohort plus the new recruits at age 7 years.17The parents were invited by post to record in a structured record all foods and drinks their child con-sumed over 3 individual days (preferably 1 weekend day and 2 weekdays, which did not need to be consecu-tive). They were asked to bring the completed food re-cords to the clinics, where, when the children were aged 1.5 years and 3.5 years, but not aged 5 years and 7 years, they were interviewed briefly by a member of the nutri-tion team to check for completeness and to clarify any uncertainties in the records, such as cooking methods. Foods and drinks consumed were recorded in house-hold measures. At ages 10 years and 13 years, food re-cords were targeted for completion by the child with parental help.18The child and parent were interviewed during the clinic by a nutrition fieldworker for up to 15 minutes to obtain further details about the foods con-sumed.18If no diary had been brought to the clinic, the nutrition fieldworker carried out a 24-hour recall for the previous day. A short questionnaire accompanied
Table 1 Continued
Reference Dietary method
(sample)
Age at assessment
Type of analysis
Focus of paper
Fraser et al. (2011)56 FFQ (AA) 13 y XS Frequency of eating fast food association with healthy foods and BMI
Noel et al. (2011)57 FR (red s) 10 y and 13 y XS and L Milk intake association with body fat percentage Noel et al. (2013)58 FR (red s) 10 y and 13 y XS and L Flavored milk association with change in body fat
percentage
Bigornia et al. (2014)59 FR (red s) 10 y and 13 y XS and L Dairy food association with body fat percentage
Cowin et al. (2001)60 FR (ss) 1.5 y XS Diet association with iron status
Cowin et al. (2000)61 (ss) 2.5 y and 3.5 y XS and L Birth weight and size, obesity association with blood lipids
Cowin et al. (2001)62 FR (ss) 1.5 y XS and L Diet association with blood lipids at 2.5 y Rogers et al. (2006)63 (ss) 5 y and 7–8 y XS and L Height association with IGF axis
Rogers et al. (2006)64 FR (ss) 7 y XS Milk and dairy association with IGF axis
Rogers et al. (2005)65 FR (ss) 7 y XS Food and nutrient association with IGF axis
Ong et al. (2004)66 (ss) 7–8 y XS and L Insulin sensitivity and secretion
Salgin et al. (2012)67 (ss) 7–8 y XS and L Free fatty acids and insulin secretion Shultis et al. (2005)68 FR (ss) 1.5 y, 3.5 y, and
7 y
L Diet association with birth weight
Rogers et al. (2010)69 FFQ and FR (AA) 3 y, 7 y, and 10 y L Diet in relation to age at menarche in girls
Timpson et al. (2007)70 (AA) 10 y XS Genetics of bitter taste detection
Golding et al. (2009)71 (AA) 4 y and 10 y L Growth and feeding behavior in bitter “super” tasters Emond et al. (2010)72 FFQ (AA) 3 y and 4 y L Diet and growth in autism spectrum disorder
Abbreviations: AA, all available subjects from the whole cohort; BMI, body mass index; CVD, cardiovascular disease; DXA, dual-energy X-ray absorptiometry; EI, energy intake; FFQ, food frequency questionnaire; FR, food record; IGF, insulin-like growth factor;
L, Longitudinal; MA, meta-analysis; red s, reduced sample size excluding FR with 1 and 2 days only; SEB, socioeconomic background; ss, CIF sub-sample; XS, cross-sectional; y, age of child in years
the food record and provided further details to aid in-terpretation of the food record. For example, the vol-ume of the usual cup used for drinks was recorded, as well as information about any dietary supplements used.
The food records including the 24-hour recalls were transformed into weights and codes linkable to the nutrient content corresponding to each of the drinks or foods consumed using DIDO software, developed by the Human Nutrition Research Unit in Cambridge, United Kingdom.81 Portion sizes for foods were de-scribed using household measures. Food weights were allocated based on described portion sizes; if the de-scription was inadequate, portion size was based on weighed intake data from a national sample of similarly aged children.80Food weights were also obtained from
those given on packets. Composite foods and recipes that did not have an equivalent in the food tables were broken down into their component parts.
The data bank used for the nutrient analysis of the food records included the 5th edition of McCance and Widdowson’s food tables82and the supplements to the tables.83–91Nutrient information for any foods not cov-ered by this database was obtained from the National Diet and Nutrition Survey database92or from manufac-turers’ information. These data were used to generate average daily nutrient intakes and amount consumed of various groups of food. Intakes from dietary supple-ments were not included in the nutrient calculations. In some analyses only children with 3 complete days of food records were included as stated in the text. The en-ergy density of the diet was investigated by dividing
Table 2Socioeconomic background of the mothers recruited to the ALSPAC, including those who supplied dietary infor-mation at age 3 years for their child in the 10% subsample of ALSPAC, and those who supplied dietary inforinfor-mation about their child at ages 7 years and 13 years
Characteristic No. (%) of
recruited mothers (n¼14 541)
No. (%) of mothers who completed food record for child at age 3 years (CIF only; n¼863)
P-value No. (%) of mothers who completed food record for child at age 7 years (n¼7285)
P-value No. (%) of mothers who completed food record for child at age 13 years (n¼6112)
P-value
Level of education <0.001 <0.001 <0.001
No school qualifications at age 16 y
3709 (25.5) 174 (20.2) 1390 (19.1) 1151 (18.8)
School qualification obtained at age 16 y
4273 (29.4) 308 (35.7) 2384 (32.7) 1982 (32.4)
Education beyond age 16 y 4358 (30.0) 363 (42.1) 2907 (39.9) 2499 (40.9)
Missing 2201 (15.1) 18 (2.1) 604 (8.3) 480 (7.9)
Maternal age at birth (years) <0.001 <0.001 <0.001
<20 655 (4.5) 13 (1.5) 112 (1.5) 99 (1.6)
20–24 2682 (18.4) 90 (10.4) 911 (12.5) 745 (12.2)
25–29 5369 (36.9) 356 (41.3) 2718 (37.3) 2309 (37.8)
30–34 3808 (26.2) 304 (35.2) 2299 (31.6) 1943 (31.8)
35 1382 (9.5) 100 (11.6) 862 (11.8) 710 (11.6)
Missing 645 (4.5) 0 383 (5.3) 306 (5.0)
Housing tenure <0.001 <0.001 <0.001
Mortgaged or owned 9757 (67.1) 700 (81.1) 5641 (77.4) 4742 (77.6)
Council and housing association rented
2138 (14.7) 80 (9.3) 584 (8.0) 467 (7.6)
Privately rented or other 1440 (9.9) 70 (8.1) 492 (6.8) 434 (7.1)
Missing 1206 (8.3) 13 (1.5) 568 (7.8) 469 (7.7)
Ethnicity <0.001 <0.001 <0.001
White 11927 (82.0) 830 (96.2) 6549 (89.9) 5517 (90.3)
Nonwhite 321 (2.2) 15 (1.7) 112 (1.5) 102 (1.6)
Missing 2293 (15.8) 18 (2.1) 624 (8.6) 493 (8.1)
Smoked in last trimester of pregnancy
<0.001 <0.001 <0.001
Yes 2413 (16.6) 110 (12.8) 897 (12.3) 683 (11.2)
No 8859 (60.9) 664 (76.9) 5254 (72.1) 4468 (73.1)
Missing 3269 (22.5) 89 (10.3) 1134 (15.6) 961 (15.7)
Maternal prepregnancy BMI <0.001 <0.001 <0.001
<18.5 567 (4.0) 36 (4.2) 259 (3.6) 226 (3.7)
18.5–24.99 8564 (58.2) 584 (67.7) 4761 (65.4) 4029 (65.9)
25–29.99 1739 (12.0) 129 (14.9) 924 (12.7) 774 (12.7)
30 631 (4.3) 32 (3.7) 317 (4.4) 257 (4.2)
Missing 3033 (20.8) 70 (8.1) 1024 (14.1) 826 (13.5)
total food energy (kJ) by the total weight (g) of food consumed. The energy contribution from drinks was assessed separately. A measure of added or free sugars intake (equivalent to non-milk extrinsic sugars) was cal-culated by deducting the sugars from milk, fruits, and vegetables from total sugars.93 Fiber was measured as nonstarch polysaccharide; this type of fiber does not in-clude resistant starch or lignin substances, which are part of the fiber measured by some other methods.93
For some analyses, foods were grouped into nutri-ent-rich core food groups (bread, rice, pasta; fruits; veg-etables; meat, fish, eggs; milk, cheese) or nutrient-poor noncore food groups (cakes, biscuits, confectionery, savory snacks; processed meat/poultry/fish; potatoes/ vegetables with fat; spreads, sauces) according to guide-lines used in Australia.94This was done to differentiate foods that are recommended to be eaten by children as part of a balanced diet from foods that are extra to the basic diet and tend to unbalance it. These noncore foods are sometimes referred to as discretionary foods.
Misreporting of energy intake
For the food records, misreporting of energy intake (EI) was assessed using an individualized method that takes into account the age, sex, and body weight of the child and allows for growth and a standard level of physical ac-tivity.95The ratio of reported EI to estimated energy re-quirement (EER) was calculated (EI:EER). Individual EERs were estimated using equations from an Expert Consultation Report on Human Energy Requirements.96A 95% confidence interval (CI) for the accuracy of EI:EER was calculated by taking into account the amount of var-iation inherent in the methods used to estimate EI and EER.97 For example, the confidence range for EI:EER, calculated for the data at age 7 years, was 0.79–1.21, so reports of EI between 79% and 121% of EER were con-sidered to be within the normal range of measurement
error and were defined as plausible reports. Those below this cut-off were under-reports, and those above were over-reports. Slightly different cut-offs based on the age-specific data were applied at other ages.
Energy adjustment
Energy adjustment is necessary when assessing relation-ships between nutrients or food groups and age-related outcomes because energy is highly correlated with most nutrients and related to body size98; it may, thus, ob-scure underlying relationships. The residuals method described by Willet has been used to adjust nutrient in-takes.98 For food groups, the weight of food eaten has been divided by the total energy content of the diet at each age so that intakes are directly comparable be-tween the ages and sexes. Energy adjustment provides an assessment of the quality of the diet as opposed to the quantity provided by the unadjusted data.
Context for the ALSPAC data: reference nutrient intakes and national cross-sectional studies of diet in children
Dietary reference values for food energy and nutrients for the UK population are used to assess the adequacy of the diet in the ALSPAC children at each age.93There is no published United Kingdom reference value rec-ommended for fiber (nonstarch polysaccharide) in childhood; for adults, the recommendation is 18 g non-starch polysaccharide per day. The Caroline Walker Trust has researched this matter99 and suggests that children should consume a percentage of adult intake related to their EI. They suggest 8 g nonstarch polysac-charide/4.2 MJ (1000 Kcal) should provide an adequate intake of fiber. In the United Kingdom, food-based rec-ommendations for healthy eating are based on the Eatwell plate.100
Table 3Dietary data available for the ALSPAC mothers during pregnancy (recruited, n¼14 541a), the ALSPAC children (at birth, n¼14 062b), and a 10% subsample of children who were studied more intensively (ever attended, n¼1432) with response rates
Age of child Sample Type of dietary data Response (n) Rate (%)
32 weeks gestation Mothers FFQ 12 423 85.4
1.5 y 10% subsample 3-day food record 1026 71.6
3 y Children FFQ 10 137 69.7
3.5 y 10% subsample 3-day food record 863 60.3
4 y Children FFQ 9715 66.8
5 y 10% subsample 3-day food record 772 53.9
7 y Children FFQ 8505 58.5
7 y Children 3-day food record 7285 50.1
9 y Children FFQ 8223 56.6
13 y Children 3-day food record 6112 42.0
13 y Children FFQ 7079 48.7
a
604 no live birth, 69 unknown outcome.
b
208 multiple births.
The rolling program of the National Diet and Nutrition Survey (NDNS) carries out regular cross-sectional recording of diets as eaten by children aged 1.5–18 years in the United Kingdom using 4-day101or 7-day92weighed food records or food records described using household measures102 as the assessment tools. The children aged 1.5–4.5 years who were surveyed by the NDNS in 1992/1993101 have been compared with the ALSPAC children at ages 1.5 years and 3 years.15,16 The NDNS 199792 children have been compared with the ALSPAC children at ages 7 years and 10 years.17,18 An update and extension of the NDNS in 2008–2012102 carried out over 4 years in children aged 1.5–18 years has been used to assess whether diet in children at dif-ferent ages has changed since the time of the ALSPAC data collection.
Physical activity
The children were asked to wear an MTI actigraph model 7164 (Manufacturing Technology Inc, Fort Walton Beach, FL, USA) for 7 consecutive days103 at ages 11, 13, and 15 years to measure their physical activ-ity. Although these monitors cannot capture data for some activities (swimming, contact sports, cycling), they have been shown to provide a reasonable estimate of physical activity.104 The activity data collected were included in the analyses if there was >3 days of data
with at least 600 minutes of data per day.105 Mean counts per minute, an indication of the volume of phys-ical activity, was calculated. Moderate to vigorous physi-cal activity was represented by the mean minutes per day in which there were >3600 accelerometer counts
per minute.
Anthropometric measurements
Birth weights were obtained from the medical records, and supine length was measured soon after birth by a member of the ALSPAC study team. Body weight and length at approximately ages 2, 9, and 19 months and at school entry were available from routinely collected measurements performed by health visitors as part of the child health surveillance program and were ex-tracted from the local child health database. Anthropometric measurements were taken at each research clinic visit using standardized procedures de-scribed in each published article. In clinic visits from age 7 years, fat mass was assessed by bioelectrical im-pedance using a Tanita leg-to-leg body fat analyzer (Model TBF 305; Tanita, Tokyo, Japan) and at age 7 years only by an arm-to-leg impedance monitor (Bodystat 1500; Bodystat Ltd., Isle of Man, UK). A whole-body DXA (dual energy X-ray absorptiometry)
scanner (Lunar Prodigy DXA scanner; GE Medical Systems, Madison, WI, USA) was used to measure body composition from age 9 years onward and provided es-timates of total fat mass, lean body mass, and bone mass.
From these heights/lengths and weights, ponderal index in infancy (weight/length3) and BMI in child-hood was calculated (weight/height2). Body weight, height/length, and BMI at each time point were con-verted to standard deviation (SD) scores (or z-scores) by comparison with the British 1990 growth refer-ence106 using gestational age or the actual age at measurement for each individual. Weight gain was as-sessed by calculating the difference inz-scores between body weight at the beginning and end of the period, adjusting for regression toward the mean using LMS correlates from the British 1990 growth reference.107 Fat mass index (FMI) was calculated by dividing fat mass (in kg) by height (in mx) to adjust for body size.108 The optimal power (x) to raise height to was derived from the data so that the relation between fat mass and height was completely removed108; this power varied according to the age and sex of the child (e.g., 5.3 and 4.2 at age 11 y for boys and girls, respec-tively109). There is no generally accepted cut-off to define excess adiposity using either fat mass, percent-age of body fat, or FMI. However, if percent-age- and sex-specific BMI cut-offs from the International Obesity Task Force (IOTF)110are used to assess the occurrence of overweight in subjects, a 20% prevalence of over-weight is found. For comparability, it was assumed that an equivalent percentage of children should be de-fined as having excess adiposity; e.g., those children in the top quintile of log FMI were categorized in this way.
Blood samples and blood pressure
Nonfasting venous blood samples were collected at re-search clinics at some time points; fasting samples were collected only in a subgroup of the children at approxi-mately 8 years. Various biochemical markers were mea-sured, and the methods are described in the individual papers. Systolic and diastolic blood pressures were mea-sured at several ages using a Dinamap 9301 Vital Signs Monitor (Morton Medical, London, UK). Two right arm measurements were recorded using a cuff size ap-propriate for the child’s upper arm circumference, and the average was taken.
Pubertal status and girls’ age at menarche
5 Tanner Stages111for pubic hair development and was found to be reliable for assessing maturation in this co-hort. Data on whether or not the girls had started men-struating were collected at a clinic held just before they reached 13 years of age; the mean (SD) age of atten-dance at the clinic was 12.89 (0.23) years, ranging from 11.30 years to 14.34 years.43The girls were asked during a measuring session in a private room if they had started menstruating and, if so, when. In total, 3751 girls attended the clinic. Data were available from 3298 girls on whether or not they had reached menarche; of these, 1637 (50%) stated that they had not.
Maternal socioeconomic and anthropometric factors
Maternal age at delivery was calculated by subtracting the mother’s date of birth from the child’s date of birth. Information on highest maternal educational level was derived from a questionnaire sent out at 32 weeks gesta-tion. All of the educational qualifications obtained by the mother were recorded, and her highest educational attainment was assessed on a 5-point scale: no academic qualifications; vocational training (hairdressing, cater-ing, etc.); at least one O-level academic examination or equivalent usually taken at age 16 years; at least one A-level academic examination or equivalent usually taken at age 18 years; university degree. In some analy-ses, these categories have been further contracted to only 3 categories; low, no academic qualification or vo-cational; medium, O-level qualifications; high, A-level or degree-level qualifications. Information on maternal smoking status was collected by questionnaires sent during pregnancy and at various ages of the child78. Housing tenure data were collected during pregnancy; categories were as follows: owned or mortgaged; public or council rented; private rented. Mothers were asked via questionnaire during pregnancy to report their pre-pregnancy weight and height78; these values were used to calculate maternal prepregnancy BMI.
Statistical methods
Because this review features a large number of pub-lished articles, it is not practical to list all of the statisti-cal methods used in the individual articles. Descriptive statistics of the main variables, the likely biases, and the handling of missing data are provided individually in most of the articles cited. Where regression analyses were carried out, the factors adjusted for depended on the outcome of interest, and the variables used in each analysis are listed in the text, as appropriate. The main confounding variables for many of the analyses were the indicators of SEB listed inTable 2. In all cases, 95% CIs are quoted.
RESULTS AND COMMENTARY
Food and nutrient intakes throughout childhood
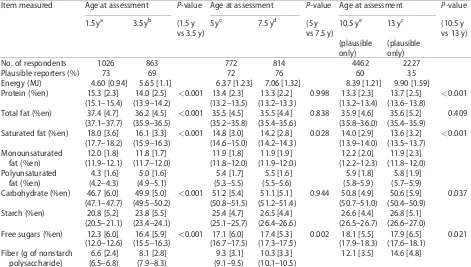
Longitudinal dietary change.The energy and energy-ad-justed macronutrient intakes from the cross-sectional food records at all 6 ages previously published in sepa-rate articles are presented together inTable 4.15–18For the children aged 10 years and 13 years, among whom misreporting rates were high, data from plausible repor-ters only were used. The full nutrient details are avail-able in the individual articles cited in Table 4. Energy intake rose in line with the increasing size of the chil-dren, as expected; within this, the contribution from protein fell whereas that from carbohydrate rose. The percentage of energy from protein was highest at age 1.5 years, then relatively constant from age 5 years on-ward (decline of 1.2 [95% CI, 1.0%–1.4%] between age 1.5 years and age 3 years, n¼775; 0.7 [95% CI, 0.5%– 0.9%] between age 3 years and age 5 years, n¼636; bothP<0.001 by pairedt-test). The increase in energy
from carbohydrate was mainly due to a rise in free sug-ars; the percentage of energy from free sugars rose by 3.3 (95% CI, 2.9%–3.8%) between age 1.5 years and age 3.5 years and by 1.2 (95% CI, 0.7%–1.7%) between age 3 years and age 5 years (bothP<0.001). Fiber intake
rela-tive to EI was very similar at each age.
Longitudinal change in EI was examined in com-plex statistical analyses, combining all the food record and FFQ data collected on the children between ages 3 years and 13 years.19 Linear-spline multilevel models were used to summarize EI trajectories through child-hood and adolescence. Models estimated average and individual EI at age 3 years and linear changes in EI from age 3 years to age 7 years and age 7 years to age 13 years in 12 032 children with at least 1 food record or FFQ and were adjusted for sex, person completing food record (parent, child), source of data (FFQ, food re-cord), and plausibility of intake. Trajectories were simi-lar if FFQs and food records were analyzed separately or combined into one model. The FFQ estimation of EI was, on average, 74 kcal higher than that of the food re-cords. The predicted EI at exactly 3 years was 1131 (SD, 74) kcal. The rate of increase of EI was greater between ages 3 years and 7 years (136 [SD, 16] kcal/y) than be-tween ages 7 years and 13 years (97 [SD, 20] kcal/y).
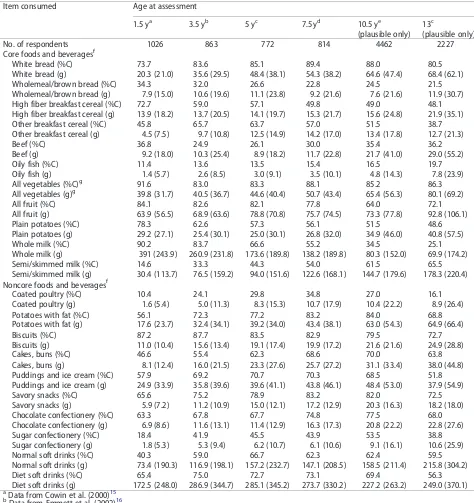
core and noncore food concept.94Within the core foods, those high in fiber (wholemeal/brown bread and whole-grain breakfast cereals) showed a relative decline in per-centage of consumers, whereas white bread and other breakfast cereals showed an increase, at least up to age 7 years. Beef products were consumed by many fewer chil-dren at age 3.5 years (25%) than age 1.5 years (37%), probably a result of major publicity about bovine spongi-form encephalitis in beef, which occurred just prior to collecting food records for the children aged 3.5 years; these data suggest that consumption took several years to recover back to the earlier frequency (35% by age 10 years). Beef was eaten by 45% of children aged 1.5–3 years in NDNS 2008–2012,102confirming the recovery of intake. More children ate oily fish as they grew up, but never more than 20% of the ALSPAC children consumed it. More than 10% of children had not eaten any vegeta-bles, and more than 15% had not eaten any fruit during the recording period at each age (Table 5). The data sug-gest that whole milk was gradually replaced by low-fat milk in the diets of these children. In the noncore food groups, savory snacks (crisps), biscuits, and chocolate confectionery were consumed by a majority of the chil-dren at each age, and the percentage of consumers of
sugar confectionery more than doubled after age 1.5 years. Coated poultry products were consumed most of-ten at age 7 years; they were widely used in school din-ners at this time prior to reforms in school meal quality. Regular and/or diet soft drinks were consumed by a ma-jority of the children at each age in relatively large amounts (Table 5).
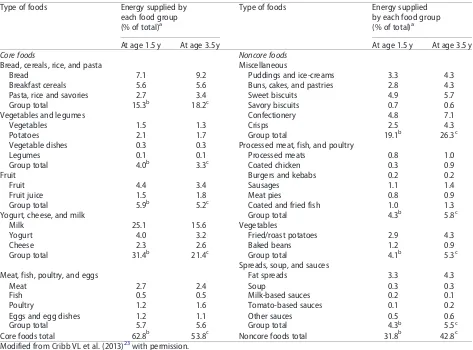
A detailed picture of the changes in the sources of energy from the food groups at the point of greatest change in the diet between age 1.5 years and age 3.5 years are given inTable 6.23The decline in energy con-tribution from dairy foods (P<0.001) probably
ac-counted for the decreased percentage of energy from protein (Table 4), whereas the free sugars increase was likely due to the increased EI from sweet miscellaneous foods (P<0.001), particularly confectionery. The
con-tribution to EI of core foods fell from 63% to 54%, whereas the contribution of noncore foods rose from 32% to 43% (bothP<0.001). Of the 11% rise in energy
from noncore foods, 5% was due to increased intakes of confectionery and savory snacks (crisps). These changes suggest deterioration in diet quality between the 2 ages,
and Table 5 suggests that this lower-quality diet is
maintained throughout childhood.
Table 4Mean intake of energy and fiber and the percentage of energy from macronutrients at each age of food record assessment from age 1.5 years to age 13 years
Item measured Age at assessment P-value Age at assessment P-value Age at assessment P-value
1.5 ya 3.5 yb (1.5 y
vs 3.5 y)
5 yc 7.5 yd (5 y
vs 7.5 y)
10.5 ye 13 yc (10.5 y
vs 13 y) (plausible
only)
(plausible only)
No. of respondents 1026 863 772 814 4462 2227
Plausible reporters (%) 73 69 72 76 60 35
Energy (MJ) 4.60 [0.94] 5.65 [1.1] 6.37 [1.23] 7.06 [1.32] 8.39 [1.21] 9.90 [1.59]
Protein (%en) 15.3 [2.3] 14.0 [2.5] <0.001 13.4 [2.3] 13.3 [2.2] 0.998 13.3 [2.3] 13.7 [2.5] <0.001
(15.1–15.4) (13.9–14.2) (13.2–13.5) (13.2–13.3) (13.2–13.4) (13.6–13.8)
Total fat (%en) 37.4 [4.7] 36.2 [4.5] <0.001 35.5 [4.5] 35.5 [4.4] 0.838 35.9 [4.6] 35.6 [5.2] 0.409
(37.1–37.7) (35.9–36.5) (35.2–35.8) (35.4–35.6) (35.8–36.0) (35.4–35.9)
Saturated fat (%en) 18.0 [3.6] 16.1 [3.3] <0.001 14.8 [3.0] 14.2 [2.8] 0.028 14.0 [2.9] 13.6 [3.2] <0.001
(17.7–18.2) (15.9–16.3) (14.6–15.0) (14.2–14.3) (13.9–14.0) (13.5–13.7) Monounsaturated
fat (%en)
12.0 [1.8] 11.8 [1.7] 11.9 [1.8] 11.9 [1.9] 12.2 [2.0] 11.9 [2.3]
(11.9–12.1) (11.7–12.0) (11.8–12.0) (11.9–12.0) (12.2–12.3) (11.8–12.0) Polyunsaturated
fat (%en)
4.3 [1.6] 5.0 [1.6] 5.4 [1.7] 5.5 [1.6] 5.9 [1.8] 5.8 [1.9]
(4.2–4.3) (4.9–5.1) (5.3–5.5) (5.5–5.6) (5.8–5.9) (5.7–5.9)
Carbohydrate (%en) 46.7 [6.0] 49.9 [5.0] <0.001 51.2 [5.4] 51.1 [5.1] 0.944 50.8 [4.9] 50.6 [5.9] 0.037
(47.1–47.7) (49.5–50.2) (50.8–51.5) (51.2–51.4) (50.7–51.0) (50.4–50.9)
Starch (%en) 20.8 [5.2] 23.8 [5.5] 25.4 [4.7] 26.5 [4.4] 26.6 [4.4] 26.8 [5.1]
(20.5–21.1) (23.4–24.1) (25.1–25.7) (26.4–26.6) (26.5–26.7) (26.6–27.0)
Free sugars (%en) 12.3 [6.0] 16.4 [5.9] <0.001 17.1 [6.0] 17.4 [5.3] 0.002 18.1 [5.5] 17.9 [6.5] 0.021
(12.0–12.6) (15.5–16.3) (16.7–17.5) (17.3–17.5) (17.9–18.3) (17.6–18.1) Fiber (g of nonstarch
polysaccharide)
6.6 [2.4] 8.1 [2.8] 9.3 [3.1] 10.3 [3.3] 12.1 [3.5] 14.6 [4.8]
(6.5–6.8) (7.9–8.3) (9.1–9.5) (10.1–10.5)
Data are presented as mean (SD) and (95% confidence intervals). These data were first published in the articles cited; for compari-sons in this table, pairedt-tests have been undertaken between certain groups.
a
Data from Cowin et al. (2000)15
b
Data from Emmett et al. (2002)16
cNot published in this format previously. dData from Glynn et al. (2005)17
eData from Cribb et al. (2011)18
Comparisons with dietary recommendations and cross-sectional dietary intake data from representative samples of UK children. The profile of fat intake improved slightly over childhood (Table 4), with a fall in the over-all contribution of fat to energy toward the recom-mended level of <35%.15–18 This was mainly due to a
fall in energy from saturated fat, although intake was still above the recommendation of 10% of energy. The amount of free sugars consumed at all ages was much higher (Table 4) than the maximum 10% of energy rec-ommended.93Fiber (nonstarch polysaccharide) intakes were approximately 75% of the recommended adequate
Table 5Percentage of children who consumed selected core and noncore food/beverage groups and the daily mean (SD) weight consumed (averaged over consumers and nonconsumers) at each age of food record assessment
Item consumed Age at assessment
1.5 ya 3.5 yb 5 yc 7.5 yd 10.5 ye 13c
(plausible only) (plausible only)
No. of respondents 1026 863 772 814 4462 2227
Core foods and beveragesf
White bread (%C) 73.7 83.6 85.1 89.4 88.0 80.5
White bread (g) 20.3 (21.0) 35.6 (29.5) 48.4 (38.1) 54.3 (38.2) 64.6 (47.4) 68.4 (62.1)
Wholemeal/brown bread (%C) 34.3 32.0 26.6 22.8 24.5 21.5
Wholemeal/brown bread (g) 7.9 (15.0) 10.6 (19.6) 11.1 (23.8) 9.2 (21.6) 7.6 (21.6) 11.9 (30.7)
High fiber breakfast cereal (%C) 72.7 59.0 57.1 49.8 49.0 48.1
High fiber breakfast cereal (g) 13.9 (18.2) 13.7 (20.5) 14.1 (19.7) 15.3 (21.7) 15.6 (24.8) 21.9 (35.1)
Other breakfast cereal (%C) 45.8 65.7 63.7 57.0 51.5 38.7
Other breakfast cereal (g) 4.5 (7.5) 9.7 (10.8) 12.5 (14.9) 14.2 (17.0) 13.4 (17.8) 12.7 (21.3)
Beef (%C) 36.8 24.9 26.1 30.0 35.4 36.2
Beef (g) 9.2 (18.0) 10.3 (25.4) 8.9 (18.2) 11.7 (22.8) 21.7 (41.0) 29.0 (55.2)
Oily fish (%C) 11.4 13.6 13.5 15.4 16.5 19.7
Oily fish (g) 1.4 (5.7) 2.6 (8.5) 3.0 (9.1) 3.5 (10.1) 4.8 (14.3) 7.8 (23.9)
All vegetables (%C)g 91.6 83.0 83.3 88.1 85.2 86.3
All vegetables (g)g 39.8 (31.7) 40.5 (36.7) 44.6 (40.4) 50.7 (43.4) 65.4 (56.3) 80.1 (69.2)
All fruit (%C) 84.1 82.6 82.1 77.8 64.0 72.1
All fruit (g) 63.9 (56.5) 68.9 (63.6) 78.8 (70.8) 75.7 (74.5) 73.3 (77.8) 92.8 (106.1)
Plain potatoes (%C) 78.3 62.6 57.3 56.1 51.5 48.6
Plain potatoes (g) 29.2 (27.1) 25.4 (30.1) 25.0 (30.1) 26.8 (32.0) 34.9 (46.0) 40.8 (57.5)
Whole milk (%C) 90.2 83.7 66.6 55.2 34.5 25.1
Whole milk (g) 391 (243.9) 260.9 (231.8) 173.6 (189.8) 138.2 (189.8) 80.3 (152.0) 69.9 (174.2)
Semi/skimmed milk (%C) 14.6 33.3 44.3 54.0 61.5 65.5
Semi/skimmed milk (g) 30.4 (113.7) 76.5 (159.2) 94.0 (151.6) 122.6 (168.1) 144.7 (179.6) 178.3 (220.4) Noncore foods and beveragesf
Coated poultry (%C) 10.4 24.1 29.8 34.8 27.0 16.1
Coated poultry (g) 1.6 (5.4) 5.0 (11.3) 8.3 (15.3) 10.7 (17.9) 10.4 (22.2) 8.9 (26.4)
Potatoes with fat (%C) 56.1 72.3 77.2 83.2 84.0 68.8
Potatoes with fat (g) 17.6 (23.7) 32.4 (34.1) 39.2 (34.0) 43.4 (38.1) 63.0 (54.3) 64.9 (66.4)
Biscuits (%C) 87.2 87.7 83.5 82.9 79.5 72.7
Biscuits (g) 11.0 (10.4) 15.6 (13.4) 19.1 (17.4) 19.9 (17.2) 21.6 (21.6) 24.9 (28.8)
Cakes, buns (%C) 46.6 55.4 62.3 68.6 70.0 63.8
Cakes, buns (g) 8.1 (12.4) 16.0 (21.5) 23.3 (27.6) 25.7 (27.2) 31.1 (33.4) 38.0 (44.8)
Puddings and ice cream (%C) 57.9 69.2 70.7 70.3 68.5 51.8
Puddings and ice cream (g) 24.9 (33.9) 35.8 (39.6) 39.6 (41.1) 43.8 (46.1) 48.4 (53.0) 37.9 (54.9)
Savory snacks (%C) 65.6 75.2 78.9 83.2 82.0 72.5
Savory snacks (g) 5.9 (7.2) 11.2 (10.9) 15.0 (12.1) 17.2 (12.9) 20.3 (16.3) 18.2 (18.0)
Chocolate confectionery (%C) 63.3 67.8 67.7 74.8 77.5 68.0
Chocolate confectionery (g) 6.9 (8.6) 11.6 (13.1) 11.4 (12.9) 16.3 (17.3) 20.8 (22.2) 22.8 (27.6)
Sugar confectionery (%C) 18.4 41.9 45.5 43.9 53.5 38.8
Sugar confectionery (g) 1.8 (5.3) 5.3 (9.4) 6.2 (10.7) 6.1 (10.6) 9.1 (16.1) 10.6 (25.9)
Normal soft drinks (%C) 40.3 59.0 66.7 62.3 62.4 59.5
Normal soft drinks (g) 73.4 (190.3) 116.9 (198.1) 157.2 (232.7) 147.1 (208.5) 158.5 (211.4) 215.8 (304.2)
Diet soft drinks (%C) 65.4 75.0 72.7 73.1 69.4 56.3
Diet soft drinks (g) 172.5 (248.0) 286.9 (344.7) 285.1 (345.2) 273.7 (330.2) 227.2 (263.2) 249.0 (370.1)
aData from Cowin et al. (2000)15
bData from Emmett et al. (2002)16
cNot published in this format previously. dData from Glynn et al. (2005)17
e
Data from Cribb et al. (2011)18
f
Data have not been compared by formal statistics.
g
Excludes baked beans.
intake at each age throughout childhood (Table 4); e.g., an adequate intake for children aged 3 years is approxi-mately 10.8 g nonstarch polysaccharide/day, but the mean intake in these children at age 3.5 years was 8.2 g/ day.16,99
Most micronutrient intakes were adequate at all ages when compared with the recommendations,93the exceptions being low intakes of vitamin D and iron. Average intakes for iron were below the recommended amounts at all ages in childhood.15–18Current recom-mendations for Vitamin D cover only children aged 3 years or below.
Intakes of both foods and nutrients were similar to those in comparable age groups in NDNS 1992/1993,101 NDNS 1997,92and NDNS 2008–2012.102Full compari-sons are presented in each of the ALSPAC publications covering childhood diet.15–18In the most recent survey, the children aged 1.5–3 years in NDNS 2008–2012 con-sumed more fruit than the ALSPAC children; 93% ate fruit in 2008–2012 compared with approximately 83% in ALSPAC in 1993–1996. This was due to fruit being
provided to children in school breaks free of charge. In NDNS 2008–2012, free sugars contributed 11.9% of the energy in the youngest group, increasing to 14.8% and 15.8% at ages 4–10 years and 11–18 years, respec-tively,102 paralleling the ALSPAC findings. Furthermore, 31% of children aged 1.5–3 years in the NDNS ate sugar confectionery, increasing to 49% of children aged 4–10 years,102which is very similar to the ALSPAC levels (see Table 5). This suggests that high sugar consumption is still prevalent in children.
Dietary differences in relation to family socioeconomic background.The quality of the diet in relation to family SEB was investigated in preschool children at ages 1.5 years and 3 years.20The strongest associations for diet were with maternal education: the nutrient differences found were lower intakes of nonstarch polysaccharide and many micronutrients and higher intakes of free sugars in children of the mothers with low compared with high education. Differences in foods consumed were split mostly along core and noncore food lines:
Table 6Contribution to energy intake of core and noncore food groups from 3-day food records of diet consumed by the same children at age 1.5 years and age 3.5 years from the 10% subsample of the ALSPAC cohort (n¼755)
Type of foods Energy supplied by
each food group (% of total)a
Type of foods Energy supplied
by each food group (% of total)a
At age 1.5 y At age 3.5 y At age 1.5 y At age 3.5 y
Core foods Noncore foods
Bread, cereals, rice, and pasta Miscellaneous
Bread 7.1 9.2 Puddings and ice-creams 3.3 4.3
Breakfast cereals 5.6 5.6 Buns, cakes, and pastries 2.8 4.3
Pasta, rice and savories 2.7 3.4 Sweet biscuits 4.9 5.7
Group total 15.3b 18.2c Savory biscuits 0.7 0.6
Vegetables and legumes Confectionery 4.8 7.1
Vegetables 1.5 1.3 Crisps 2.5 4.3
Potatoes 2.1 1.7 Group total 19.1b 26.3c
Vegetable dishes 0.3 0.3 Processed meat, fish, and poultry
Legumes 0.1 0.1 Processed meats 0.8 1.0
Group total 4.0b 3.3c Coated chicken 0.3 0.9
Fruit Burgers and kebabs 0.2 0.2
Fruit 4.4 3.4 Sausages 1.1 1.4
Fruit juice 1.5 1.8 Meat pies 0.8 0.9
Group total 5.9b 5.2c Coated and fried fish 1.0 1.3
Yogurt, cheese, and milk Group total 4.3b 5.8c
Milk 25.1 15.6 Vegetables
Yogurt 4.0 3.2 Fried/roast potatoes 2.9 4.3
Cheese 2.3 2.6 Baked beans 1.2 0.9
Group total 31.4b 21.4c Group total 4.1b 5.3c
Spreads, soup, and sauces
Meat, fish, poultry, and eggs Fat spreads 3.3 4.3
Meat 2.7 2.4 Soup 0.3 0.3
Fish 0.5 0.5 Milk-based sauces 0.2 0.1
Poultry 1.2 1.6 Tomato-based sauces 0.1 0.2
Eggs and egg dishes 1.2 1.1 Other sauces 0.5 0.6
Group total 5.7 5.6 Group total 4.3b 5.5c
Core foods total 62.8b 53.8c Noncore foods total 31.8b 42.8c
Modified from Cribb VL et al. (2013)23with permission.
aThe percentage of energy from core and noncore foods does not add up to 100% because a few energy-containing foods have not
been included in the classification.
b,c
cheese, yogurt, fruit, and fruit juice were consumed less often and chocolate, savory snacks, meat products, and fried potatoes were consumed more often by children of mothers with low compared with high education (all
P<0.001).
At age 10 years, child’s dietary differences relating to maternal education (low [n¼832], medium [n¼1472], and high [n¼1820]) were examined again.18There was no difference in overall EIs between the education groups; however, energy-adjusted fat in-take was slightly higher (by 3.1%) and carbohydrate and protein intake slightly lower (both by 2%) and fiber intake lower (by 6.1%) in low compared with high ma-ternal education groups (all P<0.001). Intake of free
sugars was high in all groups (85 g/d, which is twice the recommended maximum). The differences in some micronutrients were substantial, e.g., vitamin C was 23% lower, carotene was 15% lower, retinol was 12% lower, and sodium was 3% higher in the low compared with the high maternal education groups. Food group differences were also evident, with the core foods more likely to be consumed by children of mothers with high educational attainment; in the high maternal education group vs the low maternal education group, wholemeal bread was consumed by 30.1% vs 18.5%, oily fish was consumed by 22.3% vs 10.6%, cooked vegetables were consumed by 82.7% vs 73.6%, and fresh fruit was con-sumed by 81.7% vs 59.9%, respectively (all P<0.001).
Conversely, noncore foods were consumed by a higher proportion of the low maternal education group com-pared with the high maternal education group; meat pies and pasties were consumed by 20.9% vs 14.7%, fried potatoes and chips were consumed by 84.9% vs 73.2%, crisps/savory snacks were consumed by 84.5% vs 78.0%, and diet drinks were consumed by 76.0% vs 61.0%, respectively (all P<0.001).18 The overall
trend in both nutrients and foods was toward a more energy-dense, nutrient-poor diet as the educational at-tainment of the child’s mother decreased.
Individual nutrients. Dietary fat. Recommendations about the amount of dietary fat that is suitable for pre-school children are confusing. An investigation was made into differences in nutrient, food group intakes, and growth between children divided into quartile groups according to their intake of energy from fat.21 The average contribution to energy from fat across the quartiles rose from 31.2% (SD, 2.8) in the lowest quar-tile to 43.1% (SD, 2.2) in the highest quarquar-tile at age 1.5 years and from 30.4% (SD, 2.5) to 41.8% (SD, 2.0), re-spectively, at age 3.5 years. There was an increase in EI between the lowest and the highest fat intake quartiles (by 7.4% at age 1.5 years and 5.5% at age 3.5 years; both
P<0.001). However, there was a drop in total
carbohydrate intake between the lowest and the highest fat intake quartiles, which was driven by a drop in in-take of free sugars (by 44% at age 1.5 years and 29% at age 3.5 years; bothP<0.001). Some vitamins and
min-erals increased with increasing fat intake quartile, par-ticularly retinol equivalents and zinc; however, intakes of iron and most water-soluble vitamins fell. Vitamin C intake was 49% and 39% lower in the highest than the lowest quartile of fat intake at ages 1.5 years and 3.5 years, respectively, whereas the equivalent differences for iron intake were 23% and 19% lower (allP<0.001).
The foods increasing with rising fat intake were whole milk, meat products, cheese, and crisps/savory snacks (allP<0.001). Those decreasing with increasing fat
in-take were semi-skimmed milk, fruit, fruit juice, break-fast cereal, and fish (all P<0.001). There were no
differences in growth among children in the 4 dietary fat quartiles; height and BMI at age 1.5 years and age 2.5 years were not different between quartiles at age 1.5 years, and height and BMI at age 3.5 years and age 5.0 years were not different between quartiles at age 3.5 years.22There was also no difference in the proportion of children in each quartile that were at either extreme of height or BMI at any of the ages investigated. These results suggest that within the range of fat intakes nor-mally consumed by United Kingdom preschool chil-dren, there is no evidence of an effect on growth or obesity development of increasing the proportion of EI coming from fat in the diet.
Vitamin A.The sources of vitamin A (retinol equivalents) in the diet and changes in intake between age 1.5 years and age 3.5 years were examined longitudinally (n¼755 with food records at both ages).23The diet was categorized by core and noncore foods, and there was evidence that the quality of the diet deteriorated with age.23Between age 1.5 years and age 3.5 years, the dietary intake of vitamin A decreased by 56 mg/day (95% CI, 17 to 95mg/d;
P¼0.005) mainly due to decreased intake of whole milk (390 g/d at age 1.5 y; 261 g/d at age 3.5 y) and increased in-take of energy-dense, nutrient-poor foods such as pud-dings, cakes, biscuits, confectionery, and crisps. The contribution to energy of these foods rose from 19.1% to 26.3% (P<0.001), with very little contribution to vitamin
A intake. These analyses highlight the importance of feed-ing young children foods that are rich in nutrients in place of energy-dense, nutrient-poor foods.
consumption. Children in the lowest quartile for vita-min D intake at 1.5 years were twice as likely to remain in that quartile at 3.5 years (odds ratio [OR], 2.35; 95% CI, 1.56–3.55). Only 18% of children consumed supple-ments containing vitamin D at age 1.5 years, falling to 11% at age 3.5 years. In NDNS 2008–2012, young chil-dren obtained only a quarter of the vitamin D intake recommended to be obtained from diet and only 12% took dietary supplements102; thus, there is a continuing problem in the United Kingdom. Whether fortification of foods could be the answer to this problem was exam-ined; the theoretical intakes from different fortification regimens tested suggested that milk fortified at 2mg
vi-tamin D/100 g would provide most preschool children with adequate but not excessive intakes.24Later work in the ALSPAC looking at plasma concentrations in mid-childhood of vitamin D (25-hydroxyvitamin-D2 and 25-hydroxyvitamin-D3) in relation to cortical bone measures found positive associations with D3only, sug-gesting that in supplementation or fortification, D3 should be used in preference to D2.25 These 2 papers give valuable insights into how the lack of vitamin D in the diets of the majority of UK residents could be tackled.
Iron. Iron is a nutrient that is essential to a child’s growth and development. Several of the ALSPAC arti-cles reporting on diet in childhood identify that a size-able proportion of children, particularly girls,15–18,22 have iron intakes that are below recommended amounts throughout childhood. This is especially wor-rying for girls because their iron needs increase as they enter adolescence due to increased losses from menstruation.
Dietary energy density. The food energy density of the diet was investigated in the CIF subsample at age 5 years and age 7 years with the energy contribution from drinks considered as a separate variable in the analy-sis.26Overall, the energy density of the diet was approx-imately 8.5 at age 5 years and approxapprox-imately 8.8 kJ/g at age 7 years, and there was relatively strong tracking be-tween the 2 ages (intraclass correlation coefficient: 0.62; 95% CI, 0.55–0.68), suggesting that children with a highly energy-dense diet at age 5 years were likely to have a diet with a high energy density at age 7 years. There was no evidence of an association between die-tary energy density and EI at age 5 years, but at age 7 years there was a weak association (r¼0.15), suggesting that diets with a high energy density at 7 years have a slightly increased energy content. At both ages, energy-dense diets have higher fat and lower fiber content than diets that have a low energy density.26
The energy density of the diets at age 10 years was calculated (without drinks) for another study.27 Mean energy density was 8.76 (SD, 1.63) kJ/g, and at this age, increasing energy density was strongly associated with increasing overall EI (r¼0.22;P<0.0001). Energy
den-sity was lower among under-reporters than plausible re-porters (8.45 [SD, 1.67] kJ/g vs 8.87 [SD, 1.56] kJ/g;
P<0.0001), underlining the importance of accounting
for reporting status in any analyses using these data. The data suggest that the positive relationship between energy density and EI becomes stronger as children grow up.
Individual food groups. Fruit and vegetable intakes.
Determinants of fruit and vegetable intakes were inves-tigated using the whole ALSPAC cohort of children aged 7 years who provided food records (n¼7285).28 The possible determinants assessed were mother’s con-sumption of fruit and vegetables (from an FFQ com-pleted when the child was aged 4 y), provision of fruit and vegetables at meals in the home, child’s eating be-haviors (liking to try a variety of foods, choosiness, and enjoyment of food), maternal education, and family ex-penditure on food per head.28Total fruit consumption in boys and girls was 123 and 133 g/day, and total vege-table consumption was 71 and 72 g/day, respectively, confirming that boys consumed less of fruit than girls. However, there was no difference between boys and girls in the determinants of intake, so they were com-bined for this analysis. For children to achieve the rec-ommended 5 portions of fruit and vegetables per day, total intake should be around 45 g/MJ/day (equating to 315 g/d for a 7-year-old child). The average intake in these children was just above half of this amount.
For fruit intake (on average, 18 g/MJ/d), in a model that only included items that were independently re-lated to fruit intake (n¼5259), 14% of the variance in intake was explained.28Providing fruit as part of every-day meals compared with not doing so had the stron-gest independent association (adjusted difference, 7.2; 95% CI, 6.9–8.3 g/MJ/d higher intake;P<0.001); there
were also associations for the highest tertile of maternal fruit consumption compared with the lowest (adjusted difference 6.3; 95% CI, 5.3–7.3 g/MJ/d;P<0.001), high
maternal educational attainment compared with low (adjusted difference 5.7; 95% CI, 4.6–6.8 g/MJ/d;
P<0.001), the highest level of expenditure on food
compared with the lowest (adjusted difference 3.8; 95% CI, 2.4–5.0 g/MJ/d; P<0.001), and the child not being
choosy about food compared with being very choosy (adjusted difference 2.8; 95% CI, 1.6–3.9 g/MJ/d;
P<0.001). The child liking variety or enjoying food
For vegetable intake (on average, 10 g/MJ/d), in a similar model (n¼5208), child factors were much more important than they had been for fruit intake, all vari-ables explained 9% of the variance.28The child not being choosy compared with the child being very choosy was associated with the highest difference (adjusted differ-ence, 2.6: 95% CI, 1.9–3.3 g/MJ/d higher intake;
P<0.001); the child liking compared with not liking to
eat a variety of foods also had a strong association (ad-justed difference, 1.5; 95% CI, 0.9–1.9 g/MJ/d;P<0.001).
Maternal factors included regularly providing vegetables at family meals compared with not doing this (adjusted difference, 1.7; 95% CI, 1.3–2.2 g/MJ/d; P<0.001),
mother being in the highest tertile of vegetable intake compared with the lowest (adjusted difference, 1.7; 95% CI, 1.2–2.1 g/MJ/d;P<0.001), and mother having a high
compared with a low educational attainment (adjusted difference, 1.2; 95% CI, 0.7–1.7 g/MJ/d; P<0.001).
Expenditure on food and child enjoyment of food were only weakly associated (P<0.05).28In summary,
mater-nal example and regular provision are important in de-termining children’s intakes of fruits and vegetables, and a child’s eating behavior adds another dimension, partic-ularly in relation to vegetable eating.
Drinks in the diet.The type and volume of drinks con-sumed was investigated in detail in the CIF subsample at age 5 years and age 7 years.29The analysis focused on sugar-sweetened beverages but assessed other drinks as well. At both ages, the most popular drink was milk (me-dian intake, 257 and 242 g/d at age 5 y and age 7 y, re-spectively); the next most popular drinks were artificially sweetened diet soft drinks (127 and 140 g/d), with water (56 and 75 g/d) and sugar-sweetened beverages (57 and 67 g/d) at similar amounts. There was a bias in consump-tion of some of the drinks by maternal educaconsump-tion; at both ages, children with degree-educated mothers con-sumed the largest amounts of fruit juice and water and the smallest amounts of diet soft drinks; children whose mothers had vocational training consumed the largest amount of diet drinks (all P<0.01).29 Drinking diet
soft drinks may disrupt appetite control mechanisms because sweetness is disassociated from energy con-tent.112Child intakes of sugar-sweetened beverages and milk did not differ according to maternal education groups.
Physical activity and diet.Objectively measured physical activity was available at age 11 years; this was combined with dietary intake at age 10 years to test whether there was a demonstrable relationship between diet and phys-ical activity (n¼5134 with diet and physical activity; n¼3684 if restricting to plausible reporters only).30
Physical activity was higher in boys than in girls (in the full sample; means of 664 and 552 counts per minute, respectively). The amount of time spent in moderate to vigorous physical activity was also higher in boys than in girls (mean of 28 min compared with 18 min/d on a weekday; all P>0.005). Boys recorded higher energy
consumption than girls (mean of 1952 compared with 1769 kcal/d); however, boys consumed a lower weight of fruit and vegetables than girls (mean of 136 com-pared with 147 g/d).30Only weak associations between physical activity and dietary intake were found, which differed between boys and girls: the most consistent as-sociations were in boys, with total energy and percent-age of energy from carbohydrate positively related (bothP¼0.007) and percentage of energy from fat neg-atively related (P¼0.021); the only association in girls was with fruit and vegetable consumption, which was positively related (P¼0.027). Using plausible reporters only did not change the associations greatly. It is possi-ble that associations between diet and physical activity would have been stronger if diet had been measured at the same time as physical activity; however, these data suggest that the 2 behaviors are relatively independent of each other.
Plausibility of dietary energy reporting. The plausibility of the dietary EIs recorded at each age was investigated in relation to predicted energy requirements, and in gen-eral, the frequency of likely under-reporting of EI in-creased and the frequency of likely over-reporting of EI decreased with age.15–18The frequency of misreporting was compared in the same children at age 5 years and age 7 years (plausible reporters: 72% and 76%, respec-tively).26 There was evidence of tracking between these ages (intraclass correlation coefficient: 0.41: 95% CI, 0.34–0.48), suggesting that those who under-reported EI at age 5 years were slightly more likely to under-report at age 7 years as well.26In the food records collected at age 10 years18and age 13 years, the frequency of under-re-porting was high (36% and 62%, respectively) but in line with NDNS 199792frequency for similarly aged children. At age 10 years, children who were overweight or obese were more likely than those of normal weight to under-report their intake (P<0.001).18There were differences
in numbers of consumers and average intakes for partic-ular foods, with under-reporters recording lower intakes than plausible reporters of some core foods (rice and pasta, whole milk; in girls only: cooked vegetables; in boys only: fresh fruit [allP<0.001]) and some noncore
foods (biscuits, cakes, puddings, chocolates, sweets, sweet spreads, and sugar-sweetened beverages in both sexes [all
P<0.001]). These data suggest that particular types of
A further complication in the identification of mis-reporting of dietary intakes is the possibility that differ-ences in physical activity between individuals are distorting associations between diet and biological out-comes.31At age 13 years, assessment of both diet and physical activity with reasonable objectivity was avail-able; therefore, an investigation was made of whether the inclusion of measured physical activity in equations used to assess diet plausibility would provide clearer re-lationships.31 Three methods for predicting energy re-quirements were used: one allowed for standard low physical activity, the second calculated an individual’s physical activity from prediction equations, and the third used measured minutes of MPVA; all methods in-cluded an allowance for the age, sex, and size of the child. The frequency of plausible reporting was very similar among the methods (40%), but the use of measured physical activity gave much lower estimates of under-reporting (37.1%) and higher estimates of over-reporting (20.4%) compared with the first 2 meth-ods (under-reporting 51.5% and 51.8%; over-reporting 7.7% and 10.3%, respectively). For all 3 methods, un-der-reporters had higher mean BMI and waist circum-ference than plausible or over-reporters, as well as a higher percentage body fat (all P<0.001). Conversely,
percentage lean body mass was lowest in under-reporters and highest in over-under-reporters (allP<0.001).31
Because these 13-year-old children were mostly respon-sible for reporting their own diet with minimal parental help, it is very likely that they missed some foods; there-fore, high frequency of under-reporting would be ex-pected. The fact that using the measured physical activity to assess misreporting resulted in a shift toward over-reporting suggests that total physical activity was underestimated with this method. Further work should find ways of incorporating assessment of light physical activity, as well as moderate to vigorous physical activ-ity, into this method to improve estimates of total physi-cal activity.
Achieving healthy diet recommendations. The dietary data collected at 1.5 and 3.5 years was used to inform a study that aimed to provide appropriate portion size ranges and a practical food plan that covered all food and nutrient recommendations for use with children aged 1–4-years.32 Food and portion size information from the NDNS was used80 in combination with the ALSPAC data. To design a food plan to provide an ade-quate nutrient content within the recommended energy requirements for children, it was necessary to use foods with a medium or high nutrient density. The inclusion of energy-dense foods with poor nutrient content led to unbalanced nutrient-to-energy content in the food plan, so these foods had to be kept to a minimum. It
proved impossible to incorporate enough vitamin D– containing foods to cover the recommendations, imply-ing that vitamin D–deficient diets are likely to be the norm.32
In the mid-2000s, there was a great deal of contro-versy about the nutritional content of school meals. Children with food records for either packed lunches (n¼410) or school dinners (n¼211) from the CIF sub-study of 7-year-olds were identified,33and the qual-ity of school meals as consumed was examined. In gen-eral, packed lunches had a less good nutrient profile than school dinners, with their saturated fat and sugar content being higher and their micronutrient content being lower. Both types of meal were inadequate when compared with nutrient guidelines.93School dinners in the United Kingdom have been improved since these meals were recorded in 2000. The packed lunches re-corded were compared with food-based guidelines of what a school meal should contain99: 1 item from each core food group (starchy foods; fruits; vegetables; milk or dairy; meat, fish, or protein alternative). Only 3.5% contained all 5 groups; 44.3% contained <2 of the
groups; 31% did not include a protein food.33 There was a fruit in only 41% and a vegetable/salad item in only 16% of the packed lunches. Taken as part of the whole days’ intake, the packed lunch eaters had a slightly higher overall intake of energy-adjusted satu-rated fat and sugar, even after controlling for maternal education (bothP¼0.014); they also had a lower potas-sium intake but higher selenium intake (bothP<0.001)
than school dinner eaters. This work highlights the fact that provision of nutritionally adequate cooked school dinners is needed and suggests that this should be ac-companied by an education campaign for parents re-garding what constitutes a nutritious packed lunch.33