The status of urban and
peri-urban agriculture,
Windhoek and Oshakati,
Namibia
A SURVEY REPORT PREPARED FOR
Integrated Support to Sustainable Development and Food Security Programme (IP) in Food and Agriculture Organization of the United Nations (FAO)
BY
S.J. Dima, A.A. Ogunmokun and T. Nantanga
Department of Agricultural Economic and Extensions and Crops Science Faculty of Agricultural and Natural Resources, University of Namibia
and the Ministry of Agriculture, Water and Rural Development
ACKNOWLEDGEMENTS
The consultants would like to acknowledge the following organisations for providing funds, information, guidelines and useful advice to the team; the Food and Agricultural Organisation, Multi-disciplinary Research and Consultancy Centre of the University of Namibia, the Ministry of Agriculture, Water and Rural Development and other Government and Private Institutions.
Also acknowledged are staffs from FAO-Rome, and others who helped in the review of the questionnaires that form the core of this study. In particular, the invaluable coordination, patience and continued support of the IP-National Coordinator Ms. A.M. Awases is greatly appreciated.
The team would also like to thank the National Broadcasting Corporation more specially the Oshiwambo Service and Mr. Martin Pape of Oshakati Local Council.
We also thank all the enumerators who worked very hard to collect data in Windhoek
Mr. Lucas Nghipangelwa, Mr. Fabian Mubiana, Ms. Penny Hiwilepo, Ms. Linda Wandira and for Oshakati namely: Ms. Rauna Kapolo, Mr. Joseph Job, Ms. Maria Uutoni and Ms. Paulina Awala. Ms. Anna-Marie Tsuses is thanked for the able and professional way in which she typed and produced this report.
Lastly, but in no way the least, we would like to thank all our respondents in Windhoek and Oshakati without whom this work would not have been possible. We wish that their
Acknowledgements
2. URBANISATION AND URBAN/PERI-URBAN AGRICULTURE 6
2.1 Introduction 6
2.2 Recent literature on urban/peri-urban agriculture 6
2.3 Changing of official views on Urban and Peri-Urban agriculture 9
2.4 Population and urbanisation in Namibia 11
2.4.1 Introduction 11
2.4.2 Windhoek 12
2.4.3 Oshakati 14
2.4.4 Historical context and current policy environment
– Windhoek 16
2.4.5 Historical context and current policy environment
-Oshakati 17
2.4.6 Current Policy environment 18
3. AN OVERVIEW OF URBAN RESPONDENTS IN WINDHOEK
AND OSHAKATI 20
3.1 Demographic analysis 20
3.2 Housing characteristics 20
3.3 Age distribution of the household heads and spouses 23
3.4 Employment profiles 23
3.5 Level of Education of household heads and spouses 25
3.6 Sources of income to the household members 25
3.7 Expenditure on various needs 26
3.8 Savings among respondents 27
3.9 Availability of credit facilities 28
3.10 Control over resources and produce 28
4. A PROFILE OF THE PERI-URBAN FARMERS IN WINDHOEK
AND OSHAKATI 32
4.1 Introduction 32
4.1.1 Demographic status of the urban farmers 34
4.1.2 Reasons for gardening 35
4.4.1 Common and favourite crops produced 45
4.4.2 Use of produce 48
4.4.3 Intercropping 50
4.5 Problems faced by vegetable farmers 50
4.6 Information and networking 52
4.7 Attitude and Expectations 53
4.8 Livestock Production 56
4.9 Fishing 58
4.10 Urban residents without gardens 58
4.11 Legal status of urban agriculture 63
5. THE APPLICATION OF SEAGA TOOLS TO A GROUP IN
OSHAKATI 64
5.1 Rational 64
5.2 Application of SEAGA as an analytical tool 64
6.4 Farming practices 74
6.5 Enterprise produces 76
6.6 Constraints and production 77
6.7 Legal status of urban agriculture 79
6.8 Urban residents with gardens 79
6.9 Case study of a Peri-Urban agriculture groups in Oshakati 80
7. CONCLUSIONS AND RECOMMENDATIONS 81
7.1 Status of urban and peri-urban agriculture in Windhoek
and Oshakati 81
7.2 Policy intervention and environmental quality protection 82
REFERENCE
LIST OF ACRONYMS
ADC - Agriculture Development Centre
CSO - Central Statistical Office
DAPP - Development Aid from People to People
DBC - Development Bridgade Corporation
EU - European Union
FAO - Food and Agricultural Organisation
FINNIDA - Finish Development Agency
GRN - Government Republic of Namibia
GTZ - German International Development Agency
IDRC - International Development and Research Centre
MAWRD - Ministry of Agriculture, Water and Rural Development
NCA - Northern Communal Areas
NGO’s - Non-Government Organisation
NPC - National Planning Commission
SEAGA - Socioeconomic and Gender Analysis
UNDP - United Nations Development Programme
EXECUTIVE SUMMARY
Background
Urban and peri-urban agriculture is the practices of producing vegetables and fruits within urban environments for household consumption as well as for sale to the rapidly growing urban population. In some cities in Africa like Harare the practice has advanced to the production of maize the main staple. In Namibia urbanization attained explosive rates since independence in 1990 with Windhoek recording annual growth rates in excess of 5% from 1995. This is because of rapid migration of rural people in search of employment. The net result is the ever expanding shanties in the urban areas. As the driest country in Africa, Namibia’s agricultural base is weak. Consequently most vegetables and fruits sold in Windhoek and Oshakati are imported from South Africa. Despite this, there is evidence of intensive farming activities both commercial and micro scale in backyards, open spaces and along river courses. Unfortunately there is very little information on the farming practiced in the urban and peri-urban areas in the country.
Because of the paucity of data on urban and peri-urban agriculture the objectives of this study has to:-
* Produce a preliminary list of current farming activities in the urban and peri-urban areas
of Windhoek and Oshakati;
* Assess the current levels of utilization of the produce;
* Explore the socio-cultural aspects of urban farming such as extent of poverty, food
security and gender differentiation;
* Determine the gender specific constraints in urban and peri-urban agriculture; and
* Devise strategies for efficient peri-urban farming and transfer of the knowledge gained in
Windhoek to other urban areas in Namibia.
Methodology
The research has a detailed desk study prior to the field study which collected data in Windhoek and Oshakati using a detailed questionnaire (appendix 1). A total 244 respondents were interviewed (101 in Windhoek and 143 in Oshakati). The
sample was selected from seven north and west informal settlements while in Oshakati, the sample was selected from six areas across the whole town. The data was collected by a total of eight enumerators and two supervisors working with the three consultants. Systematic random sampling was adopted in picking respondents to the sample. Four languages were used to conduct the interviews-vis English (22), Oshiwambo (214), Rukavango (7) and Afrikaans (1). The selected sample comprises of 161 female and 83 male respondents (Windheoek 54 female, 47 male and Oshakati 107 female, 36 male). The data collected was analysed using MINITAB statistical package. Throughout the analysis, the data was differentiated into town (Windhoek and Oshakati) and gender replies.
The desk study provided detailed information about the scope and extent of urban and peri-urban agriculture in a number of urban areas in Africa and other parts of the world. These include towns like Addis Ababa, Dar es Salaam, Harare, Kampala, Khartoum, Nairobi as well as Kisangati, West Africa (Ghana, Nigeria), Botswana, South Africa, Bolivia and China. The overall findings in these studies conclude that urban farmers and their families enjoy better diets, higher incomes, employment and a combination of these benefits. They add that urban agriculture is a rational responses by the urban poor to the inability of the formal economy to provide them with sufficient real income for survival in the cities and other urban areas. The desk study also established that urban agriculture still remains unrecognised unassisted and discriminate against, when not outlawed. However the studies also revealed that many governments are creating agencies to manage urban agriculture for example Côte d’ Ivoire, Ethiopia, Malawi, Kenya, Tanzania, Uganda, Nigeria, Zaire, China, Japan, Papua New Guinea, Argentina, the Phippines and Zimbabwe.
Key Findings
far as shelter is concerned 2% of the respondents in Windhoek have moved recently to their plots. This confirms the high migratory rate into Windhoek in the last six years when the Municipality started to accommodate squatters due to political pressure. In Oshakati 54% of the respondents have been living in their plots prior to independence and 29% moved into their plots in the last five years. On ownership 48% of the respondents owned the houses, while 52% were found to be tenants. Windhoek respondents owned more houses (72%) then Oshakati (31%). In Windhoek 66% obtained their plots through the municipality and the remaining 34% through other means, while in Oshakati 51% acquired their plots through headmen and 47% through the Local Council.
On employment 51% and 26% of men and women respondents in Windhoek are employed. The corresponding figures for Oshakati are 36% and 26%, leaving the rest unemployed. In both Windhoek and Oshakati, not all the school going female children are in school –11% in Windhoek and 6% in Oshakati. No reasons were given for this situation, but could be attributed to either teenage pregnancy or use of girls to assist their mothers in looking after babies. The level of education of the respondents varied widely with 48% and 40% in Oshakati and Windhoek who had had no formal education. Post secondary education holders form 23% in Windhoek, but only 6% in Oshakati. The majority of respondents have no source of income (Oshakati 58%, Windhoek 35%). The main source of income is employment in private companies (48%), government 18% and self employment (17%). Up to 9% of the respondent spouses get their income from farming (urban agriculture). In Oshakati 35% of household heads are employed by government, 19% in private companies, 13% in farming (urban and peri-urban agriculture) and 8% self employed. On the other hand 6% of spouses are employed by government, 6% in private institutions and 21% in farming.
Windhoek and Oshakati respectively have no access to credit. Only 4.5% of respondents in Windhoek reported having received credit of up to N$400-00! In Oshakati the figure is only 1.7%.
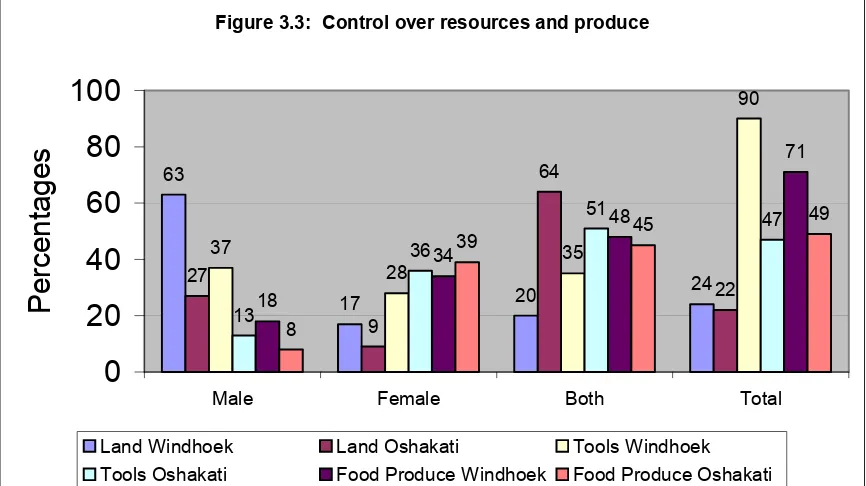
On control of produce and other household resources, the study established that in both Windhoek and Oshakati, land is controlled by men (63% and 27%), with women having a poor17% and 9% in Windhoek and Oshakati respectively. The situation is slightly better when we look at joint ownership of land 20% and 64% tools 35% and 51% and produce 48% and 45% in Windhoek and Oshakati in that order. The study further reveals that in Windhoek men control most of the cash (39%), compared to women (16%). Unfortunately no comparative figures were obtained for Oshakati.
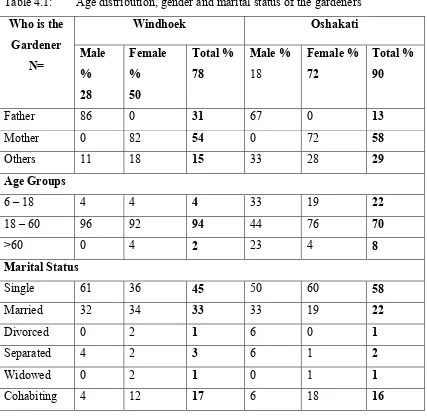
Having established the above parameters the investigation then wanted to see the involvement of the respondents in urban agriculture. This indicates that 72% of all respondents had had previous experience in farming. The majority produced crops (72%), but 5% had both crops and livestock. Further detailed investigation revealed that women constitute the majority of urban farmers (Windhoek 54% and Oshakati 58%). The proportion of men farming is higher in Windhoek (31%) than in Oshakati (13%). A higher proportion of other household members are involved in farming in Oshakati (29%), than in Windhoek (15%).
Most of the other farmers in Oshakati (22%) are school children who learned their gardening in school. Over 80% of the respondents pointed out that they started their gardens out of their own initiatives, without any outside influence. These respondents also had gardening experience from the rural areas before they moved to either Windhoek or Oshakati.
tools and fertilizers. Both male and female producers in Windhoek describe their soils as stony, while those in Oshakati are described as sandy. Water has been reported to be a serious limiting factor. The main source of water to respondents in Windhoek (91%) and Oshakati (57%) is tap water. The high usage of tap water is probably because the water tariff has been fixed at a flat rate of N$30 per month. But in the last two years the two municipalities have adopted the use of water card metres in the informal settlement areas. Consequently in Oshakati have been reported not using tap water for growing vegetables. A few farmers have suggested the use of rainwater and wastewater. Unfortunately 77% of Windhoek respondents and 43% of Oshakati perceive waste water as bad for growing crops. This may have some negative repercussions on the sale of the products.
On seeds, the study found that 85% of the gardeners in Winhoek and Oshakati source their own seeds, with 51% of those in Oshakati buying their seeds from local shops, whilst 25% get their seed from relatives and 2% from friends. In Windhoek 33% of urban gardeners buy their own seed and 53%,, get their seeds from various ways. Over 62% of growers in Windhoek perceive that seeds are cheap and readily available. The figure for Oshakati is 51% . The tools that farmers own include pigaxe (65,08) spades (62%,67%), handshoes (25%,85%) and rakes (6% Windhoek and 51% of Oshakati. The majority of the farmers own the tools. More people in Oshakati use fertilizers than in Windhoek (52% against 33%). The commonest fertilizer is digested manure from the Gammans Water Works. Its usage is an indication that the people do not have any health and cultural worries about this. The other sources of household waste are fresh manure and inorganic fertilizers. In Oshakati, 23% of the producers use fresh manure followed compost, household waste, inorganic manure and digested manure in that order. Examined for gender differentiation, the study established that there is no difference in the use of fertilizers between men and women. However, the study points out that more women than men use compost for urban and peri-urban agricultural production.
diseases identified may be due to the fact that the farmers lack the ability to identify them.
The study found that urban and peri-urban producers grow a wide range of crops and fruit trees (table 4.11). The most common crop grown in both towns is maize (88%), followed by beans (42%), tomatoes (41%), pumpkins (26%), water melons (24%), sweet potatoes (23%), red peppers (17%). A list of favourite crops produced are consumed by household members. Some of the produce is given away to friends (Windhoek 42%, Oshakati 42%). Only 25% of the farmers in Windhoek and Oshakati reported some selling of their products to augment household income. Sales take place in the producers homes or in the bus stops.
Regarding the husbandry practices in use, 87% of respondents in Windhoek practiced intercropping. In Oshakati the figure is 90%. Intercropping is popular. This is because the plots are small and it ensures optimum use of available resources such as manure, labour and capital. All the popular crops are intercropped (Table 4.15).
Legal status of urban agriculture
The study contacted the Ministry of Agriculture, Water and Rural Development but the Municipal Authorities of Windhoek and Oshakati and established that there is no policy on urban and peri-urban agriculture. When the Ministries of Health and Social Services and Environment and Tourism were approached, they informed the investigators that they do not consider urban and peri-urban agriculture as their responsibility.
Constraints to urban and peri-urban agriculture
under vegetables. A higher proportion of Oshakati farmers would like to increase the number of crops they are growing in their gardens. Regarding livestock and fish activities, very few urban producers are involved in keeping livestock (Windhoek 6% and Oshakati 24%). The types of livestock kept are chickens, goats and turkeys. As regards fishing this was reported to be an irregular, seasonal activity limited largely to the collection of mud fish in the iishona.
Socio-Economic and Gender Analysis (SEAGA)
To supplement the information obtained from the questionnarire, the study undertook two sessions on Socio-Economic and Gender Analysis (SEAGA) in Windhoek and Oshakati with a focus on peri-urban farming groups. Because of a number of constraints, the session in Oshakati on the Tukondjeni is included in this report. The Tukondjeni project started in 1993 with the main objective to establish a vegetable garden. In 1998 the garden was established with twelve women members. The enterprises undertaken were tomatoes, spinach, sweet potatoes, chillis, maize and carrots. The study applied a number of SEAGA tools such as the Daily Activity Clock Tool and Problem Analysis chart tool. On the Daily Activity Clock Tool was applied to income generating activities, organization of social and community events for example marriages, funerals, cultural shows and religions festivals. The analysis provides an insight into how individual members of households or communities are occupied within their social mileau. Hence any development activity should understand this clearly before introducing new innovations to the communities. The study found out that while women carry both productive and reproductive activities, they are not given recognition or economic benefits. In this regard any development interventions should focus on time reduction or time spent on specific activities e.g. hammer mills – to reduce the time spent on pounding grain; a planter – to reduce the time spent on planting. Thus knowing who does what in a household is important for development planners and promoters of urban and peri-urban agriculture.
Chart Tool identified Marketing as the main problem of the Tukondjeni Project.
Conclusions and Recommendations
Urban and peri-urban agriculture is practised by over 70% of the residents of Windhoek and Oshakati. Over twenty three types of vegetables and fruit trees are grown on tiny plots, but the main ones are maize, beans, tomatoes, pumpkin, watermelon, sweet potatoes and pepper. Most of the produce is consumed by the household and contribute to improvement of their nutritional status. Many producers are willing to expand their plots if they are assisted with some inputs, similarly those with no gardens have expressed interest to start vegetable gardens, if they are provided with space and initial capital. Existing marketing outlets are limited to the locality and hence not reliable. Most vegetable production takes place during the summer rains supplemented, iishona and municipal water taps which have now become very expensive. Animal production is limited to small stock and poultry, while fishing is seasonal activity.
The absence of policy on urban and peri-urban agriculture is seen as a serious constraint towards its intensification and development. It is therefore recommended that the Ministry of Agriculture, Water and Rural Development in consultation with the municipalities and the Ministries of Environment and Tourism and Regional and Local Government and Housing and other stakeholders evolve a policy on urban and peri-urban agriculture. This would ensure the development of a production system that results in the production of healthy fruits and vegetables and use of biodegradable chemicals to minimize air water and soil pollution. Furthermore it is recommended that the small growers be assisted to organize themselves into producer cooperatives so that they can break into the main market.
CHAPTER 1
BACKGROUND
1.1 INTRODUCTION
Explosive rate of urbanisation, due to the migration of people from rural areas to towns and cities in Namibia in search of employment and better economic conditions, has been taking place since independence in 1990. Though many of the migrants are unable to get jobs, they prefer to live as squatters in and around the towns, leading to the emergence and phenomenal growth of shanties and informal settlements in almost all cities and towns in Namibia viz. Windhoek, Oshakati, Ondangwa, Walvis Bay/Swakopmund, Rundu and Katima Mulilo. The problem is most severe in the municipalities of Windhoek and Oshakati. In pre-colonial days, under conditions of restricted and controlled movements of the country’s population, the Windhoek’s population growth rate averaged 4% per year. Since independence it has been 5.4% per year resulting in Windhoek’s population increasing from 97,000 in 1988 to 182,000 in 1995. According to an assessment carried out by the City of Windhoek about 60% of the city’s population are regarded as being poor as measured by income and consumption data. A similar situation also exists in Oshakati.
Being the driest country in sub Saharan Africa, the agricultural base of Namibia is very weak. As a result, most of the vegetables sold in Windhoek, Oshakati and the urban centres of Namibia are imported from South Africa. Despite this, there is evidence of farming activities, both commercial and small scale, around the peri-urban centres. For food security reasons, and even for other strategic reasons, food production in peri-urban areas should be actively promoted. This could offer means of livelihood to the jobless migrants.
development of design criteria for appropriate and sustainable farming systems in the peri-urban areas. In turn, these will hopefully facilitate the promotion of agricultural production in the peri-urban areas and lead to the reduction of poverty. They can also promote food security and nutrition at household level.
1.2 OBJECTIVES
The main objective of this project will be to collect, synthesise and expand all available information pertaining to the issues underpinning the current status of peri-urban agricultural practices in two geographical settings in Namibia, viz. Windhoek and Oshakati. The other specific objectives are:
1 To produce a preliminary list of current and ongoing farming activities in the peri-urban
areas of Windhoek and Oshakati, including animal and crop production.
2 To assess the current levels of utilization of the produce vis-à-vis the marketing opportunities and economic considerations.
3 To explore the socio-cultural aspects of peri-urban farming including the class and extent of
poverty levels, food security strategies, and the role played by gender differentiation e.g. women’s access to land, labour and other production inputs.
4 To determine the gender specific constraints currently faced/encountered by men and women engaged in peri-urban agriculture including agro-climatic factors such as insufficient water, lack of arable land, poor soil quality; and other factors such as access to financial resources or credit facilities to buy inputs, farming skills, organizational capabilities etc.
5 To devise strategies for more efficient peri-urban farming based on the information gathered
6 To devise strategies for the transfer and extrapolation of the acquired knowledge to other peri-urban areas in Namibia.
1.3 METHOD
1.3.1 Desk Study
A detailed desk study involving the collection and study of relevant literature pertaining to all the facets of peri-urban agriculture in Windhoek and Oshakati in particular and Namibia in general was carried out at the beginning of the study. The result of the desk study is presented as Chapter 2 of this report and it has also been published by the FAO (Dima and Ogunmokun, 2001).
1.3.2 Field Study
Table 1.1: Distribution of samples at Windhoek and Oshakati
Kilimanjaro 31 High Oneshila 16 High
Babylon 13 High Uupindi 18 High
Town 4 Low
Four languages were used to conduct the interviews. These are English (22 respondents), Oshiwambo (214 respondents), Rukavango (7 respondents) and Afrikaans (1 respondent). The last 2 languages were used only at Windhoek. The total sample consisted of 83 male and
161
female respondents comprised of 47 male and 54 female in Windhoek and 36 male and 107 female in Oshakati.
1.3.3 Problems with the field study
The main problem encountered was the refusal of some household members to
cooperate with the enumerators since they were not convinced of the real aims of the survey. The level of this problem was reduced in Oshakati by a radio announcement carried by the Namibian Broadcasting Corporation explaining the reason for the survey. However, another problem that was peculiar to Oshakati was that some of the questions especially those related to
1.3.4 Data Analysis
Chapter 2
URBANISATION AND URBAN/PERI-URBAN AGRICULTURE
2.1 INTRODUCTION
Urban and peri-urban agriculture can be defined as the process of producing agricultural commodities within demarcated urban and edges of (peri-) urban areas. Because of colonial and post colonial local authority laws, rules and regulations, urban agriculture in Africa has been practiced illegally, discreetly and without technical support of local authorities or the relevant ministries of agriculture. This report surveys the recent literature or urban and peri-urban agriculture in Africa in general, and Namibia in particular, with a view to assess its extent and contribution to the urban economy in terms of food production, employment creation, income generation, innovation creation and adoption and appropriate technologies development. The
report then presents the findings from a survey carried out to provideinformation dealing with
the present status of urban and peri-urban agriculture in two Namibian major cities: Windhoek and Oshakati. The information gathered includes the extent of cultivation, the economic aspects, the socio-cultural aspects, the technical aspects and the constraints of farming in peri-urban areas. It is the hope of the authors that the result of the survey presented in this report would lead to the formulation of policy options for the advancement of urban agriculture, creation of methodologies and development of design criteria for appropriate and sustainable farming systems in the peri-urban areas. In turn, these will hopefully facilitate the promotion of agricultural production in the peri-urban areas and lead to the reduction of poverty.
2.2 Recent Literature on Urban and Peri-Urban Agriculture
Egziabher et al. (1994) in their study of urban agriculture in East Africa defined it as:
In their investigations in the four cities of Addis Ababa, Dar es Salaam, Kampala and Nairobi, they established that urban agriculture flourished in river valleys, flood plains, cliffs, quarries, public land along roads and railway lines and under high-tension pylons besides plot backyard gardens and amongst flowers in front of houses. The study further found out that urban agriculture could become an important source of income while providing essential foodstuffs to the poorest households especially those headed by women. There is growing commercialisation of certain activities such as vegetables, poultry meat and eggs. For urban agriculture to flourish, the study recommends the institution of land use regulations for both public and private land. There is need for local authorities to come up with innovative arrangements for greater access to land, crop security and credit. Studies are needed for appropriate technologies for urban agriculture, its contribution to the urban ecosystem and economy, solid and liquid re-use, risks and gender equity aspects.
A UNDP (1999) sponsored study on urban agriculture, food, jobs and sustainable cities in Africa, highlighted the activities of aquaculture, horticulture, animal husbandry and agro-forestry. Richter (1995) in examining vegetable production in peri-urban areas in the tropics points out that urban agriculture is growing more rapidly than urbanization, the population or the economy. He established a positive relationship between urban agriculture and the urban poor in terms of food, health, income and gender. The study recommends further investigations on urban agriculture with respect to the ecological, socio-economic and nutritional aspects.
Salih (1994) on perspectives of food policies in Eastern and Southern Africa identifies the policy areas covered in this monograph including food supply and economic sustainability in urban areas in Tanzania including urban farming. Mbiba (1995) attempted to classify urban agriculture in Harare as on plot and off plot cultivation. He listed the crops grown as maize, beans, pumpkins and sweet potatoes. He collected data on plot sizes, zoning, plot patronage, distances between residences and plots, participation status and decision profile. He asserted that urban agriculture is driven by the difficult economic climate in urban Harare where urban agriculture has become an important source of food for the home and releases pressure on the family budget. He notes that cultivators, irrespective of sex ignore legal restrictions and cultivate when and where they see fit.
IDRC (1993) points out that millions of people in the growing cities of developing countries have become urban farmers in recent decades. The paper highlights recent research into urban farming in China, West Africa, Uganda, Tanzania, Ethiopia, Kenya and Bolivia. These studies established that urban farmers and their families enjoy better diets, higher income, employment or combinations of these benefits. It further indicated that urban agriculture puts marginal land to good use and absorbs wastes in the form of compost and fertilizers.
Rogerson (1992) found that urban agriculture on market gardening can contribute to attaining greater food security among urban residents one important finding on the policy debate is that urban agriculture is a rational response by the urban poor to the inability of the formal economy to provide them with sufficient real income for survival in the city. He observed that urban agriculture provides a crucial or at least useful food supplement for many urban families. In this respect he goes on to assert, “policy makers should recognize that urban cultivators are a legitimate part of the urban environment and design interventions that support the practice of urban cultivation”.
marginalized and most vulnerable groups in urban areas, particularly, for elderly women. The authority recommends a review of urban policies on urban agriculture in the post apartheid South Africa.
A seminar on the rural-urban interface in Africa (Baker, 1992) provides conceptual and theoretical considerations on urban development in rural context. The seminar had case studies from Botswana, Ethiopia, Ghana, Namibia, Nigeria, Somalia, Sudan, Tanzania, Uganda and Zimbabwe. The emphasis was on how some of the specific sectors, organizations, processes and actors influence and shape the functioning of small town and on linkages of small towns to both rural areas and large towns including issues relating to entrepreneurship, labour markets and urban agriculture. Maxwell and Zziwa (1992) explored the role of urban agriculture in the informal sector of the City of Kampala. They discovered that this contributed significantly to urban employment, income generation and food supply despite a hostile policy environment. It
has become a survival strategy for over one third of Kampala=s low and middle-income
households as well as a productive use of otherwise under-utilised urban resources. The study assessed the contribution of urban agriculture to urban food supply and recommended ways to promote the productive potential of urban farming including policy review by the city authorities. In a similar study, Streiffer (1991) investigated urban agriculture in Kisangani, Zaire and came to the conclusion that urban agriculture is indispensable for many people living in African cities. It was noted that despite its importance, it has not developed beyond the point of enabling people to survive. This is because those in authority regard it with disdain or outright hostility for example
the case of Nairobi, where local government at one point ordered the destruction of spontaneous agriculture within the city boundaries. Livingstone (1989) in examining youth unemployment in urban areas in Africa recommended the evolvement of a variety of policies for absorption of the youth into the agricultural sector in urban areas.
2.3 Changing Official Views on Urban Agriculture
Latin America) were supporting urban agriculture initiatives related to the provision of land and other production inputs, technical assistance, home food production and distribution, tree crops and small animals husbandry, food imports, alternatives nutrition and food distribution storage and preservation (Wade, 1987 p 38-41). Argentina and Peru have national departments and Buenos Aires, Jakarta and Mexico cities have metropolitan agencies to promote urban agriculture. More examples of the changing image of urban agriculture follow: -
* In Africa, the new capital of Côte d=Ivoire, Malawi and Tanzania encourage urban
agriculture (DGIP / UNDP 1992 p 25).
* Kinshasa=s 1975 master plan included areas zoned for horticulture in the east, central
and south east, central and south west sections of this multi-million people city (Pain, 1985 p 34).
* Many Tanzania municipalities have set aside areas for urban agriculture. The Rwanda
government gave plots to urban schools to produce more food locally (Finguelievich 1986, pp 10-11).
* In Nigeria and Zaire as in China and Japan, Papua New Guinea and the Phippines, urban
farmers have been protected and encouraged through land use regulations and tax concessions (Diallo, 1993, Lado 1990, p 257).
* In Daola, Côte d’ Ivoire (population 123,000 in 1988) peri urban and intra urban
* In Harare 246 out of 298 cooperatives managed by the city council=s department of housing and community services in 1989 were agricultural cooperatives 16 in food
catering, 97 women=s clubs with 2700 members and 4 youth groups under urban
agriculture.
In many East African countries, recently ministries of local government and agriculture, Municipal health and nutrition agencies, associations of urban municipalities and elected urban district councillors have become more tolerant if not supportive of city farming.
2.4 POPULATION AND URBANISATION IN NAMIBIA
2.4.1 INTRODUCTION
From being a mainly rural continent in the 1960s, Africa’s population has progressively become urbanized to the extent that over 50% of its population is expected to be urban by the year 2025. This is in comparison to an urban population of only 18.8% out of a total population of 280 million in 1960 and of 33% out of a total population of 645 million people by 1990 (UNCHS 1987, Mabogunje 1994, UNDP 1994).
Urbanisation in the Namibian context is much different from experiences elsewhere in Southern Africa. Some settlements in neighbouring countries, such as Durban, Cape Town, Johannesburg or Harare, have more local residents than Namibia’s present total population of some 2 million people. Almost two thirds of the total population lives in a relatively small area in the northern communal areas (NCA) comprising the former Ovamboland (now Oshikoto, Oshana, Ohangwena and Omusati regions), and Okavango and Caprivi regions. Some of the population
densities here are in excess of 100persons/km2. Fewer than 10% of the population live in the
southern regions where population densities are as low as 0.5 person/km2 whilst the remaining
The Local Authority Act (Government of Namibia 1992) distinguished between municipalities, towns and villages. Municipalities represent the highest level of local authority and are further subdivided into Part I (Windhoek, Swakopmund and Walvis Bay and Part II (Gobabis, Grootfontein, Karibib, Karasburg, Keetmanshoop, Mariental, Okahandja, Omaruru, Otavi, Otjiwarongo, Outjo, Tsumeb and Usakos). These inherited their statuses from the pre-independence period, but are also generally the most developed urban areas. They are by law the most autonomous urban areas both financially and administratively.
Altogether, twelve urban areas are defined as towns. Six of these (Katima Mulilo. Ondangwa, Ongwediva, Opuwo, Oshakati, and Rundu) are in the former northern communal areas and the remaining (Henties Bay, Luderitz, Okakarara, Rehoboth, Arandis and Khorixas) are located in the central and southern parts of the country. Towns are expected to grow into autonomous and proclaimed municipalities when conditions related to formalization and income permit. Finally, 17 settlements are defined as villages under the Local Authority Act. Villages are smaller settlements that represent the lowest level of local authority, and are not declared as urban areas. The remaining settlements are considered to be hamlets.
In 1991, according to statistics given in a report (Republic of Namibia, 1994), about two thirds of all Namibians live in localities of less than 2000 people, while only a tenth live in localities with more than 20 000 people. This may suggest that Namibia does not qualify to be classified as an urbanized country, but a high average rate of urban growth estimated at 4.5% per annum compared with an average population growth of 3.1% is indicative of its increasing urbanization. Moreover, the rate of increase in the population of some of the urban centres have been phenomenal e.g. Windhoek increased by 46%, Rundu by 911% and Katima Mulilo by 3000% between 1981 and 1991 (UNDP, 1998).
2.4.2 WINDHOEK
Windhoek is by far the most important urban centre in the country. Its share of Namibia’s total urban population in 1995 was 35.4%. No other country in Southern Africa has such a large proportion of its urban population living in the capital (UNDP 1994).
1.525 (TRP, 1995). With a combined growth rate of 5.44%, TRP estimated that Windhoek’s population grew from 97,000 in 1988 to 182,000 in 1995 and that it should currently be about 238,000. In pre-colonial days, under conditions of restricted and controlled movements of the country’s black population, the city’s population growth rate averaged less than 4% per year. The growth rate of Windhoek between 1990 (the year of independence) and 1991 was 7% compared to a 3% growth rate for the entire country (Burmeister, van Niekerk and Partners, 1992).
In TRP’ survey, (TRP, 1995), it was shown that about 60% of the city’s population are regarded as being poor as measured by income and consumption data. Whilst Windhoek has the best and most accessible health services in Namibia, it also has the second highest proportion of underweight children because of the large influx of migrants to the peri-urban squatter settlements (UNDP, 1998).
The poor in Windhoek live almost exclusively in Katutura the black township created to house black workers and their families in 1958 under South African apartheid rule. Migrants into Windhoek from the rural areas settle mainly in Katutura and some other formal, but mostly informal, settlements that have grown around the township. By 1995, the population of Katutura was 109,000 with about 60,000 people living in the informal settlements. It is within the informal settlements that the highest population increase had occurred. At independence, there were only about 300 squatter households in Windhoek, but by 1995, this has increased to about 7 000 households, and it is still increasing.
This has led to the inhabitants of the squatter areas to using dry riverbeds or the surrounding land for sanitary purposes with the resulting pollution problems.
The problems of employment, income and housing are also much more severe in the informal settlements. A 1995 survey indicates a formal unemployment rate of 46% among heads of household, a relatively low average income and poor conditions of housing and infrastructure (Peyroux and Graefe, 1995). The total level of unemployment in the informal settlements is estimated at about 34% (TRP, 1995). Of those employed, 55% are engaged in informal activities whilst the others are employed in low paid jobs. It is estimated that about 97% of the people living in these informal settlements earn an income less than the minimum subsistence level for Windhoek. The root cause of poverty in Windhoek is the lack of income and livelihood opportunities.
2.4.3 OSHAKATI
Table 2.1: Estimated proportion of Northern towns’ population living in informal settlements areas in 1995 [After Tvedten and Mupotola, 1995]
Informal settlements
Town Total Population Number Proportion
Katima Mulilo 15,952 11,964 75%
Rundu 23,094 17,321 75%
Oshakati 25,762 15,457 60%
Ondangwa 9,457 4,729 50%
The current population of Oshakati according to Tvedten and Hangula (1993) should be around 50,000 with around 60% of these people living in one of the six informal settlement areas in the town (Oneshila, Amunkambya, Sky, Uupindi, Evululuko, Kandjengedi). According to Tvedten and Mupotola (1995), the population is young with 67% being between 15 and 30 years of age and about 27% of the households in the informal settlements being headed by females. The average size of the households is 5.1, and the households are composed of a nuclear unit (one or two parents with children) living together with extended family members, distant relatives and non-relatives. Tvedten and Mupotola (1995) further stated that the unemployment problem in Oshakati is severe, with the adult population either depending on informal employment (33%) or being completely unemployed (31%). Only 20% are formally employed, often in menial low-paid jobs. The most common forms of informal employment are small scale trading and hawking. The employment rate is higher among men (29%) than among women (11%).
The informal settlements are characterized by poor housing facilities and inadequate physical infrastructure. Many houses in the formal areas are also overcrowded with 64% of the households in the informal settlement areas living in shack and many of the brick houses being in poor condition.
The urban-rural links remain an important part of people’s survival strategy. As many as 73% of the population maintain parts of their households in the rural areas 88% have access to land and cultivate, and 39% own cattle. According to CSO (1994), about 2% of Namibian’s urban dwellers get their main source of income from subsistence farming. The importance attached to the rural areas is part of the explanation for the lack of investments in housing, infrastructure in the urban settlements (see Tvedten and Pomuti 1994).
In general, it is noted that poverty is disproportionately found among rural people, female-headed households, youths, elderly, and disabled; and recent migrants into marginalized urban areas (Government of Namibia, 1997).
2.4.4 Historical context and current policy environment for urban agriculture in
Windhoek
According to Lau and Reiner (1993), population intensive subsistence crop production with marketable surpluses in good rainy seasons existed in Namibia long before the colonial era. Commercial crop production and marketing by smallholder in urban/peri-urban areas in Klein Windhoek (a suburb of Windhoek) were reported at the turn of the century with the cultivation of maize, potatoes, asparagus, onions, radishes and a variety of fruit trees. By 1931, local vegetable production constituted almost 42% of Windhoek’s fresh produce market’s annual turnover. However, the South African officials cut off research input and other official supports. This resulted in the production and marketing of vegetable produce being on an ad hoc basis (Lau and Reiner, 1993).
Lau and Reiner (1993) further showed that events related to the planned incorporation of Namibia as a fifth province of the Republic of South Africa also result in policy shifts around 1968/70 which seriously stifled vegetable production in the urban and peri-urban areas. The new development priorities including the establishment of homelands, the creation of colonial metropolis with luxurious residential plots and the supply of water to mines and urban usage over irrigation uses, relegated vegetable production to the background. For example, Klein Windhoek
shifted from being farmland to become the most prestigious locality in Windhoek. By 12th April
approximately 90% dependent on South Africa as regards vegetables”. The current situation is not much improved as Namibia still depends heavily on South Africa for 70% of its total consumption of fruits and vegetables (MAWRD, 1996).
There is currently no recognition given to urban vegetable production by the Windhoek Municipality though allowance is made for the use of mountainous areas for game farms and grazing among other uses. This could be the reason why as many as 33% of the respondents in a survey carried out in Katutura (informal settlements) in 1989 indicated that they are engaged in urban livestock farming whilst only 8% are involved in vegetable production (Cogil and Kiugu, 1990). A pre-study survey carried out by the authors revealed that up to half of the residents in the informal settlements of Windhoek were engaged in a variety of urban farming activities. Fruit trees like bitter lemon, papaws cactus, fig, banana, mangoes and even apples were seen in many households. The variety of vegetables noticed includes cabbages, sweet potatoes, spinach (actually Swiss chard), onions, tomatoes, chillies, pumpkins, sunflowers, maize, sorghum, pearl millet and beans.
2.4.5 Historical context and current policy environment for urban agriculture in
Oshakati
In the North Central Regions, vegetable production was limited to wild varieties until 1968 when a canal built to supply water from the Kunene River enabled the use of irrigated farming for vegetable production. During the South Africa military occupation period, the army organized the production and marketing of vegetables to satisfy its own needs to the exclusion of the local communities. The arrival in 1975 of Angolan refugees running away from the civil war in their country resulted in the establishment of some backyard gardens in the urban centres of the North like at Oshakati, since backyard gardening are culturally important to the Angolans. The gardens are located near their houses and the production is for household consumption.
home helped the and extension of the canal network. Another reason given for the increase in vegetable gardens in the north, especially those established outside the homes in bigger plots, was the need for generating extra income especially for paying children’s school fees (Poulet, 1995).
2.4.6 Current Policy Environment
CHAPTER 3
SOCIO-ECONOMIC CHARASTERISTICS OF THE RESPONDENTS
3.1 Demographic Analysis
The majority of the respondents (162) are young people falling in the age range of 21-40 and this amounts to 66.3% of the total sample with 142 (58%) single, 57 (23.4%) married, 33 (13.5%) cohabiting and the rest falling in the categories of divorced (4), separated (6) and widowed (2). The most interesting characteristic here is cohabiting which sometimes means that there is a non -resident spouse. In Windhoek the sample comprised of 79 (78%) male headed and 22 (22%) female headed households, while in Oshakati, the respective figures are 90 (63%) and 53 (37%).
The origin of the households indicated that 206 (84.4%) came from four Northern Regions which was formerly known as Ovamboland i.e. Ohangwena, Omusati, Oshana and Oshikoto regions. The rest of the respondents came from Kavango (18 or 7.4%) and Karas (11 or 4.5%) Caprivi (5), Erongo (1) and Khomas (1). These figures confirm the migratory patterns in the country in which most migrants to urban areas of Namibia are from the densely populated and previously disadvantaged Northern Regions. In both Windhoek and Oshakati the main home language is Oshiwambo with 75 respondents (74%) and 131 (92%) respondents respectively. Rukavango and Damara-Nama follow this with 19 and 9 in that order. In Windhoek, five of the respondents spoke Lozi at home while the remaining three respondents spoke Afrikaans and other languages (2).
3.2 Housing Characteristics (Ownership, Length of stay and Plot Acquisition Method)
accommodate squatters due to political pressures. On the other hand, more than half (54%) of the respondents at Oshakati have been living in their plots before independence, and only about 29% had moved in within the last 5 years.
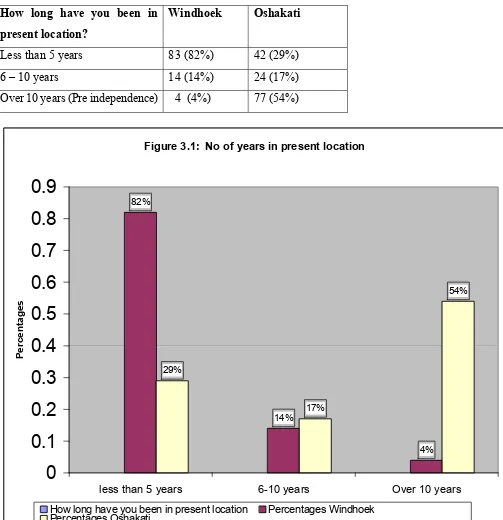
Table 3.1: No of years in present location
How long have you been in
present location?
Windhoek Oshakati
Less than 5 years 83 (82%) 42 (29%)
6 – 10 years 14 (14%) 24 (17%)
Over 10 years (Pre independence) 4 (4%) 77 (54%)
Figure 3.1: No of years in present location
14%
4% 29%
17%
54% 82%
0
0.1
0.2
0.3
0.4
0.5
0.6
0.7
0.8
0.9
less than 5 years 6-10 years Over 10 years
Percentages
On house ownership, 118 (48%) respondents own the houses on the plots while 126 (52%) are tenants. Proportionally more respondents in Windhoek (72%) own the houses than in Oshakati (31%). This could be because some of the respondents in Oshakati may be distant family members from the villages who are in transit to Windhoek or other urban areas. It is well known fact that villagers in the North Central regions of Namibia use Oshakati as a bridging town before moving on to their eventual destinations. Most (90%) of the houses in Windhoek are very small with less than 5 rooms in all (including living room, kitchens, baths etc). In Oshakati, 56% of the houses have less than 5 rooms whilst 41% have between 5-10 rooms and 4 houses (3%) have more than 10 rooms. Some of the tenants could also be those who have been relocated from other urban areas to man new shops recently opened at Oshakati.
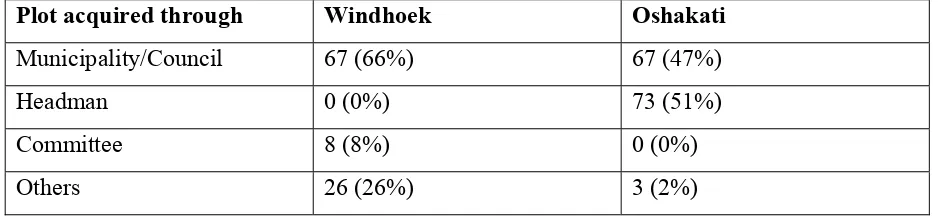
A difference in how plots were acquired can be noticed between the respondents in Windhoek and those in Oshakati (Table 3.2). In Windhoek, 66% of the respondents acquired their plots through the Municipality whilst the remaining 34% acquired them through other means which can be construed to be illegal (squatting). A different situation arises in Oshakati with more respondents (51%) acquiring their plots through headmen than those who acquired their plots through the Local Council (47%). In fact, this concurrent allocation of plots by headmen who claimed traditional authority to the land is a major bottleneck to the effective planning of Oshakati by the Local Council Authority who do not recognize the traditional authority but also could not easily dislodge the plot owners.
Table 3.2: Respondents’ method of plot acquisition
Plot acquired through Windhoek Oshakati
Municipality/Council 67 (66%) 67 (47%)
Headman 0 (0%) 73 (51%)
Committee 8 (8%) 0 (0%)
3.3 Age distribution of Household members
The majority of respondents have household sizes ranging from 3 to 8 persons. In Windhoek 76% of the respondents have family sizes of 3-8 persons, 22% have less than 3 persons per household and only 2% have members greater than 8. In Oshakati the respective figures are 71% with 3-8 persons, 11% with less than 3 persons and 18% with more than 8 persons living in their families.
The composition of the households investigated varied widely in terms of members and the ages of the household members. Table3. 3 summarize the data collected.
Table 3.3: Age distribution of households’ members
Windhoek Oshakati Age group
Male Female Male Female
<6 (pre school) 31 (35) 37 (43) 37 (48) 40 (51)
6-18 (schooling age) 20 (40) 27 (37) 64 (110) 72 (127)
18-60 (adult) 87 (145) 78 (94) 106 (233) 132 (266)
>60 (pensioner) 4 (4) 6 (10) 11 (11) 4 (4)
TOTAL 142 (224) 148 (194) 218 (402) 248 (448)
NB: The figures in brackets are the actual numbers of people in an age group, whilst the
figures outside the brackets are the number of respondents with family members in that age group. For example, 31 families in Windhoek collectively have 35 sons below the age of six.
On the whole, there are more female household members (448) in Oshakati than male members (402). However, in Windhoek, there are more male members (224) than female members (194) in the households particularly in the adult age category (18-60 years). This should be expected as most men leave their wives in rural areas whilst trying to eke out a living in the urban areas.
3.4 Employment profiles of household members
Figure 3.2: Number of household members employed or
Windheok Male Oshakati Female Windhoek Male Oshakati Female
3.5 Level of education of household heads and their spouses
Respondents were asked about the level of education of the household heads and their spouses. Table 3.5 shows the answers. In Oshakati, nearly half of the household heads and their spouses (48%) did not have any formal schooling whilst the respective value for Windhoek is 40%. This could explain why a higher proportion of Oshakati adults are unemployed. Moreover, whilst about 23% of Windhoek’s household heads and their spouses have post secondary education, only 6% of Oshakati’s heads and spouses have post secondary education.
Table 3.5: Highest level of education for household heads and their spouses.
No of households
Windhoek Oshakati Highest level of
Education
Head Spouse Head Spouse
No Schooling 36 45 40 97
Primary 25 24 34 19
Secondary 27 22 54 23
Post Secondary 13 10 15 4
Total 101 101 143 143
3.6 Source of income to household members
Respondents were asked to state their sources of income from 10 categories of income and the findings are summarized in Table 3.6.
Table 3.6: Source of income of household heads and spouses
Most spouses (mainly wives) have no sources of income in both Windhoek (35%) and Oshakati (58%). In Windhoek, the main source of income of the household heads (48%) is from employment in private institutions followed by employment in government offices (18%) and self-employment (17%). The main source of employment for spouses in Windhoek (19%) is home-based jobs (sewing, knitting etc) followed by employment in private institutions (11%) and self-employment (10%). Interestingly, 9% of the Windhoek spouses get their income from farming (urban agriculture). In Oshakati, most of the household heads are employed by the government (35%), or by private institutions (19%) whilst 13% get their income from farming (urban/peri-urban agriculture) and 8% is self-employed. Only 6% of the spouses in Oshakati are employed in government institutions with another 6% employed in private institutions. However, the highest category of source of income for women in Oshakati is farming (21%) followed by selling (8%).
3.7 Expenditure on various needs by household heads and spouses
Having established the sources of income, it is important to examine how the income is spent on household needs.
Table 3.7: Expenditure on various needs in Windhoek (numbers) by household heads and
their spouses
Food Transport Clothing Rent School
fees
government and local authorities to use urban and peri-urban agriculture to provide opportunities for surplus production for sale to generate some income. The fact that a high proportion of respondents spend less than N$100 on food may have effects on the nutritional status of the household member. This is another good reason to encourage vegetable production. The data from Oshakati was not analysed because of the paucity of data collected on this section as most of the respondents are school kids who could not give relevant answers to how the household income is spent.
3.8 Savings amongst respondents
Given the apparent poverty in which the respondents live the study wanted to assess the level of savings amongst respondents. Table 3.8 confirms the plight of the informal settlement dwellers in Windhoek and Oshakati. On the average, 68.5% of those in Windhoek have no savings. These figures reinforce the meagre earnings that the respondents have. The situation is aggravated by the fact that in both Windhoek and Oshakati, all categories of income earners buy their consumer goods from super markets with the residents of Oshakati paying slightly higher prices for the same goods because of the distance covered by the suppliers between Windhoek and Oshakati.
Table 3.8: Levels of savings amongst the informal settlers in Windhoek and Oshakati
Windhoek Oshakati Level of savings
N$ Head Spouse Head Spouse
No savings/no answer 62 77 127 127
<100 18 12 9 5
101 – 200 12 6 4 4
201 – 300 2 0 0 0
301 – 400 3 2 1 0
401 – 500 2 2 1 2
>500 – 600 2 2 1 5
3.9 Availability of credit facilities
Credit is an important input into any market gardening activity or small enterprise. In both rural and urban areas micro credit is crucial for smallholders or small business enterprises. The study wanted to assess the availability of credit to the informal settlers in Windhoek and Oshakati. Table 3.9 summarises the findings. In both towns, most of the respondents have no access to credit (95% in Windhoek and 96% in Oshakati). Only 4.5% of all Windhoek’s respondents reported having received some credit of up to 400 dollars, while the figure for Oshakati is 1.7%.
Table 3.9: Summary of credit availability to respondents in Windhoek and Oshakati
Windhoek Oshakati Amount of credit
Head Spouse Head Spouse
No credit/ no answer 97 95 138 137
1 – 200 2 3 2 1
201 – 400 2 2 1 1
>40 0 0 2 4
Total 101 101 143 143
3.10 Control over Household Hold Resources and Produce
Figure 3.3: Control over resources and produce
Land Windhoek Land Oshakati Tools Windhoek Tools Oshakati Food Produce Windhoek Food Produce Oshakati
The statistics indicate that in Windhoek, the men have more control over the land than the women whereas in Oshakati there is more of joint control of land by both male and female reflecting perhaps a more liberal male attitude in Oshakati than in Windhoek. It could also be explained by the fact that in Windhoek many of the respondents have their wives in the rural areas where they have come from.
Urban and peri-urban producers do not require a lot of tools, as often the land being operated is very small. Nonetheless as part of the capital input into market gardening, the study wanted to establish who has control over the farming tools. In Windhoek, men have more control over tools than women whilst the reverse is the case in Oshakati. The high level of joint controllership of tools in both towns (35% in Windhoek, 51% in Oshakati) reflects a situation in which households have a joint interest in producing vegetables for household consumption
The male control of food crops is less than the female one as expected in both Windhoek and Oshakati, though the respondents claiming to have joint control are the highest for both towns.
3.11 Involvement in Urban agriculture and previous farming experience
Table 3.11shows the level of involvement in urban agriculture by town as well as the number of respondents who had farming experience before they became involved in urban agriculture. In Windhoek, 79% of all respondents are involved in urban agriculture in one form or the other whilst the respective figure is 70% for Oshakati. It should be remembered here that whilst the survey concentrated in the areas of informal settlements in Windhoek, it has a more balanced coverage in Oshakati. The high proportion of respondents involved in urban farming in Windhoek show the importance of this enterprise in informal settlements and high-density areas where the level of poverty is usually high.
Figure 3.4: Involvement in Urban Agriculture
21
72
5 2
101
30
50
13
7
143
0 20 40 60 80 100 120 140 160
None Gardens only Garden and Livestock
Livestock only Total (Columns)
Percentages
Involvement in Urban Agriculture Towns Windheok Towns Oshakati
CHAPTER 4
Urban and Peri-urban Agriculture in Windhoek and Oshakati
4.1.1 INTRODUCTION
The last chapter presented the result of the survey as it concerns mainly the demographic details of all respondents. This chapter will present the analyses dealing with the respondents who are involved in urban agriculture and will focus more on the farming activities. In addition, the chapter will present an assessment of the dwellers who are not involved in urban farming at present.
4.1.1 Demographic status of the urban farmers
4.1.2 Reasons for gardening
As to be expected, all the respondents listed the provision of food for family members as the major reason for cultivating the gardens (Table 4.2). In addition, some respondents are into farming to provide them with extra income (Windhoek, 13%; Oshakati 17%) and employment (Windhoek, 9%; Oshakati 4%). A significantly high proportion of the farmers in Oshakati (33%) also indicated that their farming is a form of hobby. These would mainly be respondents from the middle and low-density areas who earn enough money to be able to provide adequately for their families.
Figure 4.1: Age distribution, gender and marital status of the gardeners
Table 4.2: Reasons for gardening
Land preparation is necessary to provide a good soil tilth for planting vegetables. Farmers were asked to describe what they do for land preparation and Table 4.3 summarises their answers. The farmers in Oshakati mostly fill the soil and plant the seeds (98%). Only 1% of farmers in Oshakati mentioned that they de-stone and plant or de-stone, fill and plant. By contrast, the majority of the farmers in Windhoek (58%) had to remove stones from their land as part of their land preparation. This comprised of 23% who only removes the stones and then plant and 35% who removes the stones, before filling the soil and then plant. Only 3% of the Windhoek farmers plant directly without digging the soil.
4.2.2 Weeding
The gardens are weeded by most of the farmers (45% in Windhoek, 67% in Oshakati) when necessary (Table 4.3). In Windhoek, a high proportion of the farmers claimed that they weed at least once per week. Only one urban farmer (based in Oshakati) indicated the usage of herbicide to get rid of the weeds. The remaining farmers make use of other garden tools like hoes, etc.
Table 4.3: Land preparation methods, weeding and planting seasons.
4.2.3 Planting season
Table 4.3 also shows the replies of farmers to the question of the season(s) that they normally practice gardening. Most of the Windhoek farmers (90%) plant only during the summer season. This means that they depend only on rainfall and do not cultivate during the rainless winter months. Moreover, Windhoek is prone to frost during the winter months and this could also have affected the farmers’ decision not to plant during the winter. Oshakati is not prone to frost, so the decision on which season to cultivate would depend more on the availability and affordability of water. Though most (72%) of the Oshakati farmers still plant during the summer season only, a fairly high percentage of 27% cultivate during both summer and winter seasons.
4.2.4 Crop Production Inputs to the Gardens
4.2.4.1 Soil type
Most of the respondents in Windhoek (90% of the male and 84% of the female) described their soil as being stony but good for vegetable gardening. In Oshakati, 66 % of the male respondents and 50% of the female respondents consider the soil as being sandy but good for vegetable gardening. The same proportion of men and women (11% in both cases) consider the soil as being bad whilst 22% and 39% of the male and female respondents respectively consider the soil as being average.
4.2.5 Water
free. The high usage of tap water to supplement rainfall could be due to the low cost paid by most of the farmers for the tap water (Table 4.4).
Potable water is supplied to most informal residents in Windhoek and Oshakati through a public tap that is shared by about 4 to 10 households. The water consumption used to be paid for on a flat rate of N$30/household irrespective of consumption but this is being replaced gradually by the use of a prepaid meter in which individual household would pay for the exact water consumed. Most of the urban farmers in Windhoek (53%) still pay the flat rate and as such are able to use as much tap water as they want for farming. Most of the urban farmers living in informal settlements in Oshakati already have prepaid meters for the tap water. This is why the highest (38%) proportion of cost is less than N$30. The implication of this is that most urban farmers in informal settlements of Oshakati have stopped using tap water for watering their gardens. Most of the farmers paying over N$100 for tap water are located in the medium to low density suburbs.
Table 4.4: Cost of tap water
Town Gender
Cost range N$ Windhoek (%) Oshakati (%) Male (%) Female (%)
<30 34 38 37 35
30 53 10 42 33
31-100 3 19 13 7
101-200 3 15 0 11
>200 8 19 8 14
N= 74 48 38 84
As shown in Table 4.5, the most common method of applying water to the gardens in Windhoek is by using buckets to flood the garden (62%) with water. This is followed by the use of punctured tins (18%). The punctured tins are discarded tins of paints, tinned food etc ranging from 1 litre to 10 litres which has been punctured in the bottom with nails and which apply the tap water as if it were rain. The use of hosepipes and sprinklers, which have to be bought, is not very common. The case of Oshakati is such that the majority of the urban farmers do not use tap water because of cost. Consequently, 41% of the farmers do not have any need to apply tap water to their gardens as they depend mainly on rain. Amongst those using tap water, the majority (26%) uses buckets to flood the gardens. A higher proportion than in Windhoek uses hosepipe (23% cf. 5%) and sprinkler (7% cf. 4%). The majority of these are the urban farmers living in medium to low-density areas.
Table 4.5: Method of water application
Windhoek Oshakati
Table 4.6: Use of rain and wastewater
Windhoek (N=78) Oshakati (N=90)
Yes (%) No (%) Yes (%) No (%)
Do you collect rain water? 40 60 44 56
Do you need help to collect rain? 90 10 83 17
Do you use wastewater? 19 81 43 57
More farmers in Windhoek (60%) and Oshakati (56%) do not collect rain but most of them indicated that they would collect rain water if helped to do so. Most of those harvesting water from rainfall use bucket and drums. A higher proportion of farmers in Oshakati (43%) use wastewater compared to the farmers in Windhoek (19%) probably because of the high cost of tap water to Oshakati residents. Whilst there is no gender difference in the use of wastewater in Windhoek, more women farmers (46%) in Oshakati use wastewater compared to men (33%). The source of the wastewater is mainly from the kitchen only (69%) and less from the wash and kitchen together (31%). In order to gauge the general attitudes of gardeners to wastewater usage, they were asked to give their opinions about the effect of wastewater on gardens with the results as given in Table 4.7.
Table 4.7: Gardeners’ perception of the effect of wastewater
Windhoek Oshakati
methods of purifying wastewater may need to be introduced to the urban farmers.
4.3.3 Seed
The majority of farmers in Windhoek and Oshakati (85%) source their own seeds by themselves. The main source of seeds in Oshakati is the shop 51% of the farmers in Oshakati buying their seeds from local shops, whilst 25% get their seeds from relatives and 22% from friends. In Windhoek, less numbers of farmers (33%) buy their own seed stock than those (53%) who get their seeds through various other means (e.g. from last season’s crop, from friends etc). The general perception among Windhoek farmers is that the seed is cheap to buy (62% of farmers) and readily available locally (71% of farmers). Only 51% of the farmers in Oshakati think that seed is cheap though the majority (78%) agreed that it is readily available locally.
4.3.4 Tools
The most important garden tool in Windhoek is the pickaxe, which is owned by 65 respondents (Table 4.8). This is not surprising considering the stoniness of the soil in Windhoek. The other tools used by the farmers in Windhoek are spades (62), hoes (25), rakes (6) and cutlasses (2). With a more easily cultivable sandy soil, most of the farmers in Oshakati own hoes (85), spades (67) and rakes (51). Other tools mentioned by Oshakati farmers are pickaxe (8), and cutlass (4).
Table 4.8 Tools owned by farmers
Tools Windhoek Oshakati
Pickaxe 65 8
Spades 62 67
Hoes 25 85
Rakes 6 51