The Roles of Input Policies in Transforming
Agriculture in Indonesia
WORKING PAPER 03 | NOVEMBER 2014
Bustanul Arifin
INTRODUCTION
Background and Rationale
Indonesian agriculture has experienced a significant structural transformation in the past four decades. The growth performance of the agricultural sector remains a moderate 4.0 percent per year in 2012, a significant increase from a 2.9 percent growth right after the global financial crisis in 2010. The performance of agricultural growth is the second lowest after the mining sector’s growth of 1.5 per-cent. Agricultural performance is obviously lower than that of the manufacturing and service sectors, achieving 5.7 percent and 8.1 percent growth, respectively. The estate crops, fisheries, and food crops sectors have contributed to agricultural growth performance, mostly because the world price of such important commodities remains high, contributing significantly to the added value of agricul-tural sectors. However, in view of the quality of growth argument, a 4.0 percent growth is simply not adequate to generate more em-ployment and alleviate poverty.
The current administration of President Susilo Bambang Yudhoyono (SBY) has issued several policies affecting the growth and performance of the agricultural sector under a package of “revitalizing agriculture.” It has implemented a quadruple tracks strategy— pro-growth, pro-job, pro-poor, and pro-environment—that is an improvement from the triple-track strategy of the previous administra-tion, adding the last expression of pro-environment. Subsidies on agricultural inputs, particularly fertilizer, seed, and some subsidized credit programs, are among the important policies to improve food and crop production and achieve food self-sufficiency in five strate-gic commodities: rice, corn, soybean, sugar, and beef. Although there has been no significant indication at the field level that these policies have led to radical changes in the market structures of input and industry performance, and hence structural transformation, the policies will continue until 2014, the end of the administration.
Some rationales for the input policies include the facts that the agricultural production system in Indonesia is highly dependent on small-scale farmers, who have limited access to capital, and a high diversity of farming systems in the country, implying serious com-plexities for increasing economies of scale and efficiency levels. The majority of small farmers are rice farmers, with about 9.5 million farm households controlling agricultural land of 0.5 hectare or less. These rice farmers make up about 53.6 percent of the total 17.8 million farm households. The second largest farm household in Indonesia is corn farmers, contributing 21 percent of the total, although the two crops of rice and corn are not mutually exclusive. Rice in Indonesia is produced in 11 rice production centers: Aceh, North Su-matra, West SuSu-matra, South SuSu-matra, Lampung, West Java, Central Java, East Java, Bali, West Nusa Tenggara, and South Sulawesi. Nearly 60 percent of rice production in Indonesia comes from Java and Bali, islands with large urban populations and well-developed market infrastructures.
SUMMARY | APRIL 2010 (a) Key drivers of changes in agricultural input policies are not clearly identified.
Agricultural input policy is obviously an integral part of agricultural development in the modern history of Indonesia. All government administration regimes have put emphasis on strategies to increase food production and achieve self-sufficiency. The use of modern inputs, particularly high-yielding seed and chemical fertilizer, has played an important role in the performance of agricultural develop-ment. Studies have suggested that programs of mass guidance (BIMAS) and mass intensification (INMAS) and their derived programs during the first 50 years of Indonesian independence have somehow shaped the level of agricultural input uses. During such a golden period, the phenomena of Green Revolution technology have influenced the massive use of chemical fertilizer and high-yielding inputs. Inevitably, the government has to employ a great amount of fertilizer and seed subsidies, in addition to credit subsidies during the early stages of crop production cycles and infrastructure development in rural production centers. In the 1980s, the government also
adopted the success of agricultural input use in food crops into its cash crop development strategies, where small farmers received subsidized seedling and fertilizer to increase their cash crop production and improve the value of exports.
These subsidy programs were terminated during the Asian economic crisis in the 1990s, when the economic policy in Indone-sia was directly supervised by the International Monetary Fund (IMF). Direct policy intervention from the IMF removed the fertilizer subsidy, but increased the amount of funds for a social safety net, including the Rice for the Poor (Raskin) program. However, when the agricultural sector’s performance began to lag, the government reinstated the input subsidy in 2003, but sharpened the target benefi-ciaries to include only farmers with landholding of 2 hectares or less. An agricultural development program has been on the radar screen of the government administration since the global food crisis in 2008, which coincidently occurred in conjunction with the El Niño drought in 2007–2008. The program also aimed to provide compensation for farmers affected by the long drought. In all, the gov-ernment has increased its budget allocation for the agricultural sector, instituted a rice subsidy for the poor, and started several pro-grams to improve productivity.
During the previous administrations before Reformasi, government policy was implemented through strong command and order from the top to regional and district levels. There may be some deviations from the direction formulated by the central govern-ment, but the bureaucracy staffs are fully responsible for the success and failure of the government program. After the fall of Soeharto in 1998, the government system became radically decentralized, so that the central government has limited authority, including shap-ing the input policy for food security and agricultural development in general. Similarly, the political system has also changed drastically from a shadow democracy of three political parties—but the government party was the majority—into a full procedural democracy of multiparty political system. Hence, the parties’ political considerations and interests have increased significantly during the past dec-ade. The policy on input subsidies may be a compromise of political dynamics and consensus among the political parties and some bu-reaucratic leaders. In short, the current bubu-reaucratic administration may not be compatible with the multiparty and decentralization government system. Agricultural development program, hence agricultural input policies formulated at the central level is not always translated into actions at the provincial and local government level. The subsequent research question to be answered in this study is what are the key drivers of changes in seed and fertilizer policies in the modern history of Indonesian agriculture?
(b) Macroeconomic implications of input policies is not well documented.
An agricultural input policy that uses a heavy subsidy, such as that implemented in Indonesia, has significant macroeconomic implica-tions, not only in terms of the state budget but also in terms of a high dependency on chemical inputs and inefficient outcomes. The fertilizer subsidy has increased nearly tenfold during the two terms of President Susilo Bambang Yudhoyono’s (SBY) administration. The amount of fertilizer in 2013 was about Rp 17 trillion (US$1.7 billion), with plans to increase it to over Rp 21 trillion (US$2.1 billion) in 2014, nearly 10 times that of the Rp 2.5 trillion (US$25 billion) subsidy in 2005. The amount of subsidy for seed also increased tremen-dously, from Rp 60 billion (US$6 million) in 2012 to Rp 1.45 trillion (US$145 million) in 2013. The amount of seed subsidy is planned to increase to Rp 1.6 trillion (US$16 billion) in 2014, also a nearly tenfold increase from the Rp 145 billion (US$14.5 million) subsidy in 2005. The major decrease in seed subsidy in 2012 was mostly because the 2011 program implementation failed and rice production experienced a significant decrease of more than 1 percent from the previous year of 2010. The amount of the subsidy is, of course, far below the amount of the energy subsidy, which reached Rp 300 trillion (US$30 billion), with serious consequences for the state budget, development programs, and social welfare.
SUMMARY | APRIL 2010 rural finance, and microcredits (Arifin 2013). The effects of such subsidies on the input market depend on input supply elasticity, and this in turn will depend on structure, conduct, and performance in domestic production and imports (Dorward 2009). The cost associ-ated with the fertilizer subsidy program has outweighed the benefit from achieving higher rice yields in both fiscal and economic per-spectives (Armas et al. 2012). The fertilizer subsidy under the current regime has benefited both small and large farmers so that the policy is regressive and the 40 percent largest farmers capture up to 60 percent of the total subsidy (Osorio et al. 2011).
Moreover, the price disparity between subsidized and nonsubsidized agricultural inputs has led to imperfect market segmenta-tion among farmers, as the final consumers. Similarly, the price difference between domestic subsidized fertilizer and fertilizer in the international market have also led to smuggling and the illegal export of fertilizer to neighboring countries. A high dependency on sub-sidy among fertilizer producers, which are all state-owned enterprises, has become a negative incentive for manufacturers to innovate, invest in producing and distributing fertilizer more efficiently, and diversify their products for more sustainable agriculture, such as or-ganic and biological fertilizers. Therefore, the study will answer the question, what are the macroeconomic implications of input poli-cies in different regimes of policy administration?
(c) Information on the process of developing input policies for agricultural development is scant.
A policy is not only about an academic or a government decision as a response to a current situation; it also involves a very complex process of interaction, debate, fight, compromise, and consensus among political, business, academic, and civil societies. As explained previously, each government administration has some unique agricultural input policies, although the objectives do not differ very much—that is, to increase production, achieve self-sufficiency, and improve farmers’ welfare. The way a government regime formu-lates, organizes, and implements the policy is very much dependent on the capacity of the actors involved, the degree of communica-tion and interaccommunica-tion among the actors, and the effectiveness and smoothness of the policy process. Nevertheless, studies that docu-ment the policy process of agricultural input policies in Indonesia are disappointingly scant. The political economy analysis of such im-portant aspects of agricultural input policies is not much documented.
The significance of agricultural input subsidies to increase agricultural production, and thus meet specific government pro-grams, may be known. For example, the literature documents gas subsidy to fertilizer producers, fertilizer distribution and zoning, and maximum retail price (MRP or HET, harga eceran tertinggi) of subsidized fertilizer to farmers. However, how the government decided to implement the dual pricing system for subsidized and nonsubsidized fertilizer, and the complexity of the program implementation in a huge country such as Indonesia, is not very well analyzed. Similarly, how farmers and/or farmers’ groups propose the amount of ferti-lizer subsidy on the basis of the size of operated land (RDKK) is not well documented.
Meanwhile, the standard triangle of public policy process in agricultural inputs for food security and agricultural development involving policy formulation, policy implementation, and policy evaluation may be well known. However, who serves as the policy ac-tors involved in agricultural inputs and how these acac-tors fit in the above public policy process obviously need more careful observation and rigorous policy analysis. At least, these actors should operate at the appropriate level, depending on their hierarchical place in pub-lic popub-licy concerns, whether on a strategic-political level, an organization level, or an implementation level. Since the era of decentral-ized government after the Reformasi, technical details on policy implementation of agricultural inputs require more investigation at the level of government, whether at the central, provincial, or local level, and the third parties involved, if any. For example, the amount of subsidized high-yielding seed produced by the state-owned seed manufacturers is very dependent on the bottom-up policymaking pro-cess at the local and provincial levels. The following question is quite valid: how does the policy propro-cess of fertilizer and seed inputs contribute to agricultural development in Indonesia?
(d) Policy constraints in promoting the seed and fertilizer industries are quite complex.
SUMMARY | APRIL 2010 from the propagation process. For marketing and distribution of new high-yielding varieties, these two seed companies have also in-volved other agencies at the Ministry of Agriculture, especially the agricultural extension agents, who helped in the field trials, training, and visits to farmers and farmers’ groups.
Since the 1980s, private sectors, especially foreign-affiliated seed companies, have also been involved in developing high-yield-ing maize seed, particularly hybrid maize, and distributed it to farmers. Farmers across the country have responded very well to such initiatives and started growing hybrid maize. Private seed companies also develop high-yielding seed in horticulture, particularly for fruits and vegetables. Amazingly, the seed industry in the horticultural sector has developed quite well over the past decade. These private companies develop the seeds mostly in their own laboratories, research facilities, and field trials. Sometimes these companies collaborate closely with public universities and research institutes. Only in one case do private companies involve farmers’ groups for seed propagation purposes, but they enforce strong monitoring and evaluation procedures because of their proprietary rights.
Since the 2000s, some private foreign companies have also been developing transgenic seeds, especially in maize and cotton, although the process of field trials and policy formulation has not been as smooth as it should be. After a long interruption, the devel-opment of high-yielding seed using biotechnology principles has recently been reintroduced, after local universities and research insti-tutes conducted intensive research at the laboratory level. Some researchers have been collaborating with private-sector companies to develop new high-yielding seeds and to develop the seed industry in general. However, further development of the seed industry is constrained by unclear policies on biotechnology usage. Although Indonesia has ratified the Cartagena Protocol on biotechnology de-velopment, the implementation policy at the field level is not clearly defined.
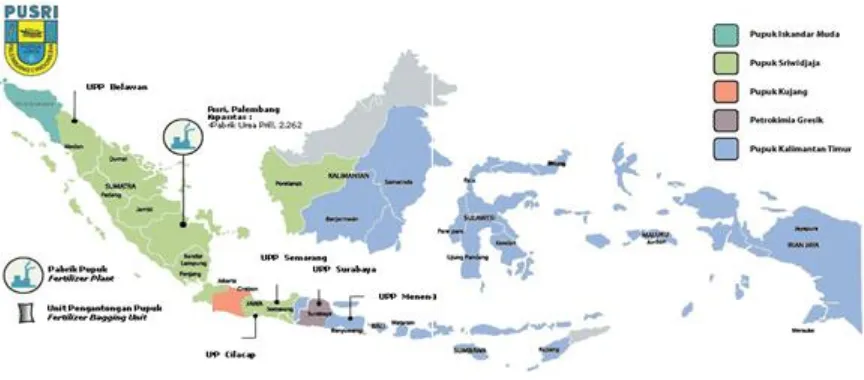
Unlike from the seed industry, the fertilizer industry in Indonesia has made significant progress over the past four decades under PT Pupuk Indonesia (formerly PT Pusri Holding). The holding company has five subsidiaries: PT Pupuk Iskandar Muda and PT Pupuk Sriwijaya in Sumatra; PT Pupuk Kujang and PT Pupuk Petrokimia in Java; and PT Pupuk Kaltim in Kalimantan. Given the historical background of these five state-owned enterprises and heavy subsidies for the fertilizer industry, the private sector is not interested in establishing a fertilizer producing plant. These state enterprises are also involved in the development of organic fertilizers by employing farmers and/or farmers’ leaders of farmers’ groups across the country. The state enterprises sometimes provide microbes for mixing the manures and composts and perform quality controls, and sometimes brand the organic fertilizers. Indonesia has also developed a biological fertilizer in a three-way partnership among public universities, research institutes, and government agencies. However, the biofertilizer industry is in an early stage of development, particularly because some early biofertilizer products were unsuccessful in the market. The immediate question to be answered in this study is, what are the policy constraints to promoting the seed and fertilizer industries in Indonesia?
(e) Strategies to improve the policy environment are not well formulated.
Strategies to improve the policy environment for the roles of agricultural input in agricultural transformation in Indonesia cannot be separated from the process of policy formulation, policy implementation, and policy evaluation. Ideally, the policy environment should be improved when policy outcomes in the field and ideal conditions simulated in academic exercises deviate quite significantly. The stakeholders—that is, the gainers and the losers of agricultural input policy—could be identified quite well by careful and rigorous pol-icy analysis. Similarly, the quantification of the benefits and costs of agricultural polpol-icy inputs, particularly in terms of agricultural out-put by different stakeholders, could also be determined through field observations and economic analysis. These results need to be compared to the ideal conditions formulated at the ideological and theoretical level and imagined interactions among political, busi-ness, and civil society. A policy change needs to be recommended, focused either on the policy contents based on the analysis results or on the policy context and environment based on continuous communication and advocacy of the stakeholders, particularly to high-level policymakers at the formulation high-level and to policy implementation actors at the field high-level.
SUMMARY | APRIL 2010
Research Objective
The objective of this study is to examine more comprehensively the role of input policies, mostly for seed and fertilizer, in transforming Indonesian agriculture. More specifically, this study will
1. identify key drivers of change in seed and fertilizer policies in the modern history of Indonesian agriculture, especially since the 1970s,
2. analyze macroeconomic implications of input policies in different regimes of policy administration,
3. examine policy processes on agricultural inputs (fertilizer and seed) to contribute to agricultural development in Indonesia, 4. identify key policy constraints in promoting the seed and fertilizer industry in Indonesia, and
5. formulate strategies to improve the policy environment to promote sound input use.
Methodology: Approach and Framework
The study combines desk analysis, literature studies, and in-depth interviews with relevant resource persons from the government, private sectors, academics, farmers’ associations, concerned groups and community organizations, and relevant stakeholders in the fertilizer, seed, and other input industries in the country. This detailed approach and framework are outlined as follows.
Desk Studies: This reviews previous studies on seed and fertilizer policies (with the team) that affect agricultural performance. Basically, this step examines drivers of changes in seed and fertilizer policies in Indonesia (since the 1970s). This desk study will answer the first and second questions outlined above.
Policy Analysis: The analysis examines the policy process, context, and inputs imposed by different government administra-tions. This policy analysis will answer the third, fourth, and fifth quesadministra-tions.
In-Depth Interviews: These informal but thorough interviews with key resource persons from government, academics, private sectors, and farmers will confirm, calibrate, and verify some findings of the study.
Organization of the Report
After this introductory chapter, Chapter 2 provides an overview of Indonesian agriculture by thoroughly analyzing its role in the coun-try’s economy from an economic policy and historical perspective. The section on the structural transformation in modern Indonesian history examines the four stages based on economic theory: (1) the early “Mosher” stage of “getting agriculture moving,” (2)the “John-ston-Mellor” stage of the contribution of the agricultural sector to economic growth through a variety of linkages, (3) the “Schultz” stage of rapidly growing the nonfarm economy above the rising rate of agricultural income, and (4) the “Johnson” stage that has not been achieved fully by the Indonesian economy, primarily because of labor and financial markets. Chapter 2 also provides a compre-hensive overview of seed and fertilizer on the pathways of agricultural input policy to achieve agricultural development objectives.
Chapter 3 clearly identifies key drivers of changes in agricultural policy in various government regimes. The section on the ori-gins of agricultural input policy examines thoroughly each key driver of the changes, namely (1) the agricultural development strategy, (2) major long droughts, (3) the economic crisis, and (4) the multiparty political system. A historical matrix of these key drivers is pre-sented in a table to cover different components of all four major government administrations, followed by an explanation on different dimensions of the drivers. The argument continues with an analysis of the benefits and drawbacks of agricultural input subsidies, both in theoretical and in empirical terms. The chapter also analyzes the macroeconomic implications of agricultural input subsidies, espe-cially from the perspective of the state budget and allocation efficiency issues in public spending. Given the strategic objectives, agricul-tural input subsidies should not be totally removed in Indonesia, but rather need to be sharpened and implemented more appropri-ately in the field.
SUMMARY | APRIL 2010 Chapter 5 provides a conclusion and recommendations for improving agricultural inputs and transforming the agricultural sec-tor in Indonesia.
OVERVIEW OF INDONESIAN AGRICULTURE
The Role of Agriculture in the Indonesian Economy
Agriculture has played a very important role in the national economy, especially since the modern era of the 1970s. All subsectors— food crops, cash crops, livestock, and fisheries—show significant increases, more rapidly in the 1980s, then a bit slower in the 1990s, before returning to moderate in the early 21st century. The sources of agricultural growth in Indonesia include land area expansion, technological change (Green Revolution), infrastructure development (irrigations, roads, bridges, and so on), and public goods (re-search and development and extensions).
Indonesian agriculture has performed quite well in the past decade, surviving the Asian economic crisis at the end of the 1990s. In the 1980s, agriculture grew more than 6 percent per year, brought about by most subsectors of food crops, cash crops, live-stock, and fisheries. Indonesian agriculture once again survived the world food crisis of 2008, and food crops, especially the rice sector, have performed quite well, achieving growth in production of more then 4 percent during the world food crisis.
Since the food crisis, Indonesian agriculture has grown at around 3 percent per year. In 2008, all sectors performed very well, except for forestry, which grew at 4.8 percent per year, mostly due to high food prices in the global market. Export earnings from crude palm oil, coconut, coffee, cocoa, rubber, shrimp, and fishery products contribute to the growth of the Indonesian economy. The sector declined to 4.0 percent per year in 2009, after global prices returned to “normal” (or, more precisely, declined). The growth perfor-mance of the agricultural sector remained moderate at 4.0 percent in 2012, mostly due to cash crop sectors and plantations.
In general, food crops contribute significantly to overall agricultural performance. The present share of rice in the economy is not as large as it was in the 1970s. Nevertheless, rice has been and remains a political commodity, where a shock in price and produc-tion performance usually creates political tensions and public debates. All political leaders have used food security approaches in the implementation of economic development strategies.
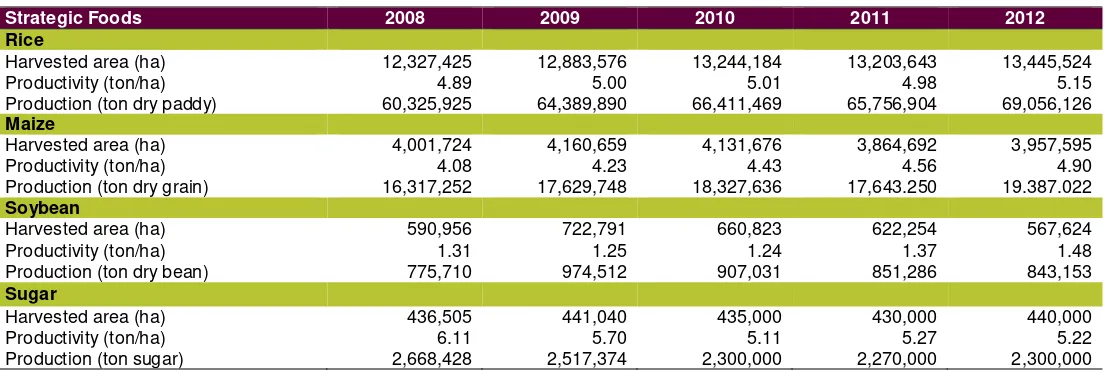
Table 2.1.1 shows the production of strategic foods—rice, maize, soybean, and sugar—from 2008 until 2012. For rice, the most important food crop in Indonesia, production in 2012 was 69.4 million tons of dry paddy or non-husked rice, equivalent to about 39.3 million tons of rice, well above sufficient for the total consumption of 27.5 million tons (using the consumption data of 113.5 kg per capita) or 33.7 (using the consumption data of 139.2 kg per capita). Generally, people are now more critical of the official published data, as the government, through the state owned-enterprise BULOG, imported in 2012 about 1.3 million tons more rice than Thailand and Vietnam, although it was claimed only for buffer stock. Micro problems in the rice economy are mostly due to production ineffi-ciency at the farm sector, very small landholding size, and poor financial access.
Table 2.1.1—Production of strategic foods in Indonesia, 2008–2012
Strategic Foods 2008 2009 2010 2011 2012
Rice
Harvested area (ha) 12,327,425 12,883,576 13,244,184 13,203,643 13,445,524
Productivity (ton/ha) 4.89 5.00 5.01 4.98 5.15
Production (ton dry paddy) 60,325,925 64,389,890 66,411,469 65,756,904 69,056,126
Maize
Harvested area (ha) 4,001,724 4,160,659 4,131,676 3,864,692 3,957,595
Productivity (ton/ha) 4.08 4.23 4.43 4.56 4.90
Production (ton dry grain) 16,317,252 17,629,748 18,327,636 17,643.250 19.387.022
Soybean
Harvested area (ha) 590,956 722,791 660,823 622,254 567,624
Productivity (ton/ha) 1.31 1.25 1.24 1.37 1.48
Production (ton dry bean) 775,710 974,512 907,031 851,286 843,153
Sugar
Harvested area (ha) 436,505 441,040 435,000 430,000 440,000
Productivity (ton/ha) 6.11 5.70 5.11 5.27 5.22
Production (ton sugar) 2,668,428 2,517,374 2,300,000 2,270,000 2,300,000
SUMMARY | APRIL 2010 The second most important food crop in Indonesia is maize, where the production in 2012 was 19.3 million tons, primarily due to an increase in harvested areas in maize production centers in Java, Sumatra, and Sulawesi. Increasing the use of hybrid seed and other results of (traditional) biotechnology brought about an increase of nearly 1 million hectares of harvested area of maize. Indonesia is now preparing to increase the use of (modern) biotechnology, where genetically modified organisms have been in the forefront of public debates and high-level discussions. Increasing maize production also has a positive impact on the poultry and livestock sectors, where the feed industry has developed significantly in the past decades or so. Small-scale meat producers do not have to rely on im-ported feed, which experienced significant price increases, especially during the global crisis. Livestock Revolution has achieved some progress since the 1980s, but the dualistic structure remains problematic in the poultry industry, and industry restructuring policies face several significant challenges. Meat production is growing, but far less than the consumption level, which has shown an increasing trend in the past decades. Indonesia is now struggling to achieve self-sufficiency in beef in 2014, although there was some political con-troversy on import policies and nongovernance cases in 2012.
Soybean production has been decreasing in the past decades, reaching only 843 thousand tons, and it will be nearly impossible to achieve self-sufficiency in 2015 for the annual consumption of more than 2.5 million tons. Indonesia has been importing soybean from the US, Argentina, and Brazil. During the 1980s and 1990s, soybean imports were controlled by the logistics agency (then BULOG), but now are more open to the private sector. The high import dependency on soybean has caused suffering in Indonesia due to the global fluctuation in soybean prices, which is associated with fossil fuel prices, and hence biofuel prices in the world market. A soybean price surge in 2008 created instability in the domestic soybean economy, especially the sustainability of tofu and tempeh production as the staple foods of most Indonesians. The US drought in 2012 once again caused imported soybean prices to soar. The government has to carefully formulate a trade policy on soybean imports, as this commodity is one of Indonesia’s special products (SPs), the country’s commitment in the World Trade Organization negotiations.
Sugar production is about 2.3 million tons, while total consumption is about 4.9 million tons (2.7 million tons for households and 2.2 million tons for industry, consisting of 1.1 million tons for large-scale industry and 1.1 million tons for small-medium enter-prises, or SMEs). After the sugarcane mass intensification policy (Tebu Rakyat Intensifikasi, TRI), best farming practices at the farm level are far below standards, due to poor availability of production factors, fertilizers, and pesticides; access to capital; and market-level and large-scale economic infrastructures. Competitiveness of sugarcane domestic production is decreasing so that extra efforts are needed to seek alternatives to upland sugarcane, especially outside Java. Indonesia will need to seriously target structural problems in harvest-ing, processharvest-ing, and governance systems if it is to achieve self-sufficiency in 2014. The refinery industry creates new complexities in the sugar industry as well, with five new sugar refinery plants (four plants with 70 percent utilization of capacity), three completed in 2009. The industry is not required to pay an import tax, even for palm sugar. Sometimes they obtain status as a producer’s importer (IP) to deliver sugar for local food and beverage industries, primarily foreign-affiliated companies. Foreign-affiliated food and beverage com-panies have specific requirements for imported sugar, which are usually set by headquarters. The refined sugar theoretically has to be transported directly to the food and beverage industry. However, poor governance, monitoring, and enforcement in trade and distribu-tion policies have contributed to the instability of sugarcane prices at the farm-gate level.
Indonesian agricultural export commodities are in different stages of competitiveness and sustainability. The competitiveness of crude palm oil (CPO) is the highest among all agricultural exports, a logical consequence of Indonesia’s fast-growing production and export and now the largest in the world. CPO production in 2011 was about 24 million tons, growing at 5.1 percent per year, which is far ahead of that of Malaysia, with less than 20 million tons. However, the productivity gap between smallholders and large-scale plan-tations created land conflicts in the field and accusations of carbon emissions; declining natural forests have also contributed to the sustainability challenges of the CPO industry in Indonesia. Some major palm oil businesses in Indonesia are members of Roundtable Sustainable Palm Oil (RSPO), a major certifying body in palm oil trade. Interestingly, the Indonesian Palm Oil Association (IPOA, or lo-cally known as GAPKI) has withdrawn its membership in RSPO, and instead become a co-promoter with the Indonesian government for the new and mandatory certification system of Indonesia Sustainable Palm Oil (ISPO).
SUMMARY | APRIL 2010 in the world market. However, an unclear pricing policy of biofuels has somehow hindered the market development of the palm oil industry.
Other agricultural export commodities are not as advanced as palm oil in terms of competitiveness and sustainability princi-ples. Coffee ranks second in terms of export earnings from agriculture, but growing coffee consumption and changing lifestyles among urban communities will shape different stages of competitiveness and sustainability. Major buyers and actors in world coffee supply chains have been aggressively promoting some changes in corporate environmental governance in the coffee industry. Rising concern for sustainability standards has emerged very rapidly in the past two decades, probably because of the dynamics of private sectors and multinational corporations. Certification and labeling systems are also expanding rapidly in the global food sector, as the environmental and social standards in the coffee economy have serious and long-term implications for the sustainability of natural ecosystems in the tropics and the livelihood of coffee producers who are mostly smallholder farmers. Supply chain verification schemes currently operat-ing in the Indonesian coffee trade include Organic, Fairtrade, Rainforest Alliance, Utz Kapeh, and Starbucks CAFÉ Practices, all of which attempt to address environmental (and social) concerns at the site of production through market signals sent by buyers along the sup-ply chain. The latest certifying partnership introduced to the Indonesian coffee sector is the 4C (Common Code for the Coffee Commu-nity), which intends to foster sustainability in the “mainstream” green coffee chain and to increase the quantities of coffee meeting basic sustainability criteria of economic, environmental, and social concern. Nevertheless, these global partnerships in the coffee sector are sometimes viewed as competition among coffee partnership buyers in the north to ensure a sustained coffee supply from the pro-ducing countries in the south.
The Indonesian cocoa sector has been in a revitalizing process to restore its major role in export earnings for small-scale cocoa farmers to what is was in the late 1990s. The National Movement (Gernas) to increase cocoa production, initiated in Sulawesi in 2009, by developing tissue culture for cocoa seedling, increasing farmers’ capacity building, improving agricultural practices in the field, and increasing the cocoa bean quality, may provide better avenues to improve the competitiveness of the cocoa industry in the future. Sooner or later, the global certification partnerships will extend their operations in Indonesia because the market demand for cocoa will require higher sustainability standards and other requirements of global environmental governance. However, when the current gov-ernment administration imposes an export tax on cocoa to develop downstream processing industries domestically, the net outcome to improve the competitiveness may not be as good as the initial intention, mostly because of limited efforts to improve the marketing structures and domestic supply chains of the cocoa market.
The competitiveness of the rubber economy has not developed as required to be a major source of export earnings and farmer livelihood in Indonesia. Rubber exports are dominated by primary products of latex and slab, tapped directly from the rubber tree. These primary products are of low quality, as they are sometimes mixed with sand and wood debris, making economic returns quite small. Domestically, the harvested area of rubber has been under pressure, partially due to land competition with fast-growing and more profitable crops such as palm oil. Since 2007, the government has been trying to solve these quantity and quality problems in rubber production by providing subsidized credit for rubber replanting and enforcing a quality control on rubber products that went into effect in early 2000. However, after more than a decade of implementation, product quality efforts are mainly in the hands of farmers who have grown clonal rubber seedlings, not by the majority of rubber farmers who have been dependent on traditional seed-lings. Efforts to increase the added-value have not been quite successful because the investment climate and the business environment in general have hindered the development of downstream rubber industries. The business climate is also associated with government policy strategies to promote investment in such prospective sectors and to contribute to industrial development in general. The rubber-based industrial development is obviously related to many segments of economic policy, including technological advancement, infor-mation systems, financial institutions, legal issues, and enforcement structures.
An example of this complexity was the decline in rubber production in 2009 due to an “adjustment process” in the world mar-ket after a record high price of oil and gas during the global economic crisis of 2008. The demand for synthetic rubber was back to nor-mal in 2009, so that the price of rubber dropped significantly to a record low of US$1.61/kg. This low price of rubber, coupled with pres-sure to convert rubber trees into oil palm trees, contributed significantly to the decline in rubber production in 2009. After the interna-tional price rebound to over US$3/kg in 2010 and above US$4/kg in 2011, natural rubber production increased steadily. Similarly, a sudden decline in coffee production in 2009 was also associated with the global crisis and price signals received by coffee farmers in producing countries. However, an increasing world price of these commodities since 2010 has been met with increased production.
SUMMARY | APRIL 2010 production of agricultural export commodities this year. The price of rubber reached US$4.32/kg in early 2012, a significant decline compared to the average of US$4.82/kg in 2011. However, Indonesian agricultural export commodities continue to face various chal-lenges, most of them structural in nature, such as low-yielding smallholder crop systems, sustainability pressures, low quality of produc-tion, underinvestment, inadequate infrastructure, underdeveloped agricultural practices, and restrictive government policies.
Structural Transformation in Modern Indonesian History
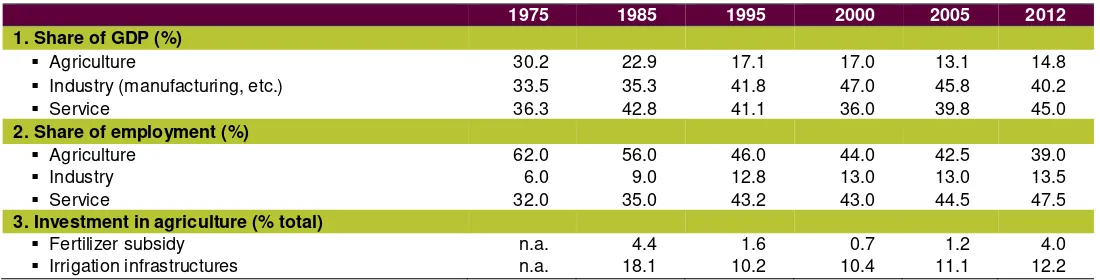
Agriculture has played a very important role in the national economy, even though its share of the gross domestic product (GDP) has declined as the economy has grown. Economists normally attribute the decline to either a push factor or a pull factor. A push factor has a negative connotation and poverty implications, where agriculture cannot accommodate the growing numbers in the labor force, so that resources move out from the agricultural sector to more rapidly growing sectors in the economy. A pull factor implies that nonagri-cultural sectors have more attractive employment opportunities, primarily due to differences in factor endowments and capital accu-mulation. Structural transformation in the Indonesian economy has not occurred smoothly, especially in the past decade. Table 2.2.1 shows that Indonesian agriculture has experienced a declining share in the GDP, from 30 percent in 1975 to about 23 percent in 1985, and 14.8 percent in 2012. The declining share of agriculture in the Indonesian economy is also consistent with the increasing share of industry and service sectors in the economy.
Table 2.2.1—Agriculture and structural transformation in the economy, 1975–2012
1975 1985 1995 2000 2005 2012
1. Share of GDP (%)
Agriculture 30.2 22.9 17.1 17.0 13.1 14.8
Industry (manufacturing, etc.) 33.5 35.3 41.8 47.0 45.8 40.2
Service 36.3 42.8 41.1 36.0 39.8 45.0
2. Share of employment (%)
Agriculture 62.0 56.0 46.0 44.0 42.5 39.0
Industry 6.0 9.0 12.8 13.0 13.0 13.5
Service 32.0 35.0 43.2 43.0 44.5 47.5
3. Investment in agriculture (% total)
Fertilizer subsidy n.a. 4.4 1.6 0.7 1.2 4.0
Irrigation infrastructures n.a. 18.1 10.2 10.4 11.1 12.2
Source: The share is calculated from BPS data, various issues. Investment data are from the Ministry of Finance on the State Budget, various issues.
SUMMARY | APRIL 2010
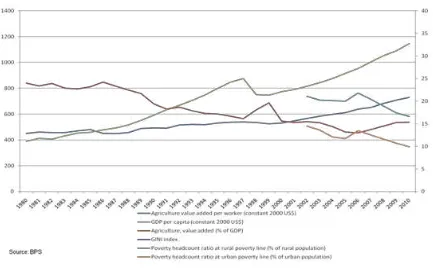
Figure 2.2.1—Transformation of Indonesian agriculture since the 1980s
Barrett (2011) identifies the evolving four basic stages of agricultural development, (1) the early “Mosher” stage, when “get-ting agriculture moving” is the main policy objective; (2)the “Johnston-Mellor” stage, when agriculture contributes to economic growth through a variety of linkages; (3) the “Schultz” stage, when rising agricultural incomes fall behind those in a rapidly growing nonfarm economy, inducing political tensions; and (4) the “Johnson” stage, when labor and financial markets fully integrate the agricultural economy into the rest of the economy. Efforts to “skip” the early stages and jump directly to a modern industrial economy have gener-ally courted disaster. In the early stages, there is typicgener-ally a substantial gap between the share of the labor force employed in agricul-ture and the share of GDP generated by that workforce. This gap narrows over time as incomes rise; the convergence reflects better integrated labor and financial markets. But this structural gap often widens during periods of rapid growth, as is evident in the history of OECD economies (Timmer 2009). When overall GDP grows rapidly, the share of agriculture in GDP falls much faster than the share of agricultural labor in the overall labor force. The turning point in the gap generated by these differential processes, after which labor productivity in the two sectors begins to converge, has also been moving “to the right” over time, requiring progressively higher per capita incomes before the convergence process begins.
The transformation of Indonesian agriculture starts with the well-known speech by President Soekarno during the first inaugu-ration of Bogor Agricultural University (IPB) in 1952, when he said that “food is a matter of life and death of the country.” President Soekarno paid much attention to improving the capacity of human resources in agriculture, especially in higher education, increasing research and extension to empower small farmers. The innovative program of mass guidance (BIMAS) and mass intensification (INMAS) in the 1960s is considered the first and most successful government program focusing on agricultural development. Coincidently, the program was implemented at the time of Green Revolution technology, which then easily spread throughout agricultural production centers in Indonesia. The program not only introduced seed and fertilizer, but also more importantly provided massive guidance from the government and higher education communities to farmers in the field. In other words, mass guidance was really an approximation and implementation of the agricultural extension system in a systematic and comprehensive manner.
SUMMARY | APRIL 2010 revenue from the oil- and gas-based economy was more than adequate to implement the subsidized programs of both input and out-put policy, for the sake of agricultural development. The state budget for agricultural development was also allocated for a combination of domestic procurement of rice, market injections—also known as market operations—from short-run buffer stocks and international trade, and BULOG’s access to financial credit to purchase domestic grains during harvest seasons and store it under a specific stock management system. The state budget for this subsidy program also needed to cover operational losses due to the squeeze on the price margin and to cover losses on international trading (see Timmer 1989).
Such a strategy of combining land use intensification, area expansion, and crop diversification led to a remarkable growth in the agricultural sector, reaching 6 percent per year, and economic growth in general of more than 7 percent per year up to the mid-1980s. For the first time ever, economists and political scientists alike have acknowledged that the agricultural sector has played a very important role in Indonesian economic development. At least, Indonesian agriculture passed the “Mosher’s getting agriculture moving” stage when government policies helped increase crop production and labor productivity. The share of the agricultural sector in Indone-sia’s GDP has declined from 30.2 percent in 1975 to 22.9 percent in 1985, while the shares of the industrial and service sectors in-creased from 33.5 percent and 36.3 percent to 35.3 percent and 42.8 percent, respectively, in the same period of 1975–1985. The agri-cultural sector at the time had successfully introduced new technology of high-yielding varieties and chemical fertilizer application, especially in Java and Bali. An efficiency-driven strategy was adopted in the rice-producing activities as the new rice varieties are gener-ally smaller than local varieties and their harvest period is genergener-ally shorter (about 100 days). The harvest methods of these new varie-ties changed, too; female workers using a small knife (ani-ani) were replaced with fewer male workers using a larger sickle.
The labor force involved in the agricultural sector has also declined from 62 percent in 1975 to 56 percent in 1985, while those involved in the industrial and service sectors has increased from 6 percent and 32 percent to 9 percent and 35 percent, respectively, in the same period of 1975–1985. More importantly, the agricultural sector has gone through the “Johnston-Mellor” stage, especially through a variety of linkages. For example, the use biochemical inputs (high-yielding varieties and fertilizer), primarily in densely popu-lated areas such as in Java and Bali, and mechanical inputs in a relatively sparse agricultural area in the Outer Islands contributed signifi-cantly to achieving self-sufficiency in rice production. In addition, Indonesia had adequate state revenue to implement cash crop devel-opment, especially in Sumatra, Kalimantan, and Sulawesi, and to resettle farm families from Java to the Outer Islands under both gen-eral transmigration and specific transmigration of cash crop development. The agricultural development strategy in the 1980s also im-plemented a nucleus-estate smallholders (NES) program, by providing nucleus companies with subsidized capital and long-term leases to public lands for estate crop production. These companies have to provide technical assistance and marketing services to smallholder farmers surrounding the nucleus plantations. Meanwhile, the manufacturing and service sectors also developed quite significantly due to the structural transformation that occurred in the agricultural sector and in the economy as a whole. Generally, these two sectors require more labor force, especially those with a higher education level and more advanced skills and professions. Labor movement from the agricultural sector and rural areas to the more modern industrial and service sectors occurred smoothly because it coincided with the expansion of a nonfarm economy across the country. Investment in foot-loose industry sectors, such as textiles, garments, and manufacturing has contributed significantly to a high growth rate in the agricultural sector and in the Indonesian economy as a whole.
Moreover, Barrett (2011) suggests that the modern political economy has its roots deep in agriculture. Explaining the evolu-tion of agricultural policy has long been difficult for models that use democratic instituevolu-tions, median voters, or other forms of repre-sentative governance. Two aspects of agricultural policy are especially puzzling. First is the “development paradox,” whereby the sector is discriminated against when a large share of the population works in agriculture, but is protected when the number of farmers be-comes much smaller. Second is the “trade paradox,” whereby both agricultural imports and exports are usually taxed. Such strategies neglect economic laws of comparative advantage based on factor endowments and typically lead to higher prices, greater inefficiency, and environmental damage than does reasonably free international trade in agricultural goods.
SUMMARY | APRIL 2010 first El Niño drought in 1992–1993. More importantly, there was a slow pace in research and technological progress in the agricultural sector, due to an accumulation of some political tensions in economic development strategies (Arifin 2013).
Basically, Indonesian agriculture has experienced no significant increase in rice yield since the early 1990s and there are struc-tural and institutional problems in the estate crops as well as pest and disease outbreaks in major production centers, which might be closely associated with the long droughts in 1987–1988 and 1992–1993. More importantly, important infrastructures such as irrigation, roads, bridges, and ports have deteriorated in several places in the country, and this has contributed to the decline in agricultural growth. When research systems and technological progress did not improve the rice yield required to maintain the necessary growth rates, and when public expenditures on these important elements of agricultural development declined significantly in the 1990s, the poor performance of the agricultural sector was quite a logical consequence. The slow growth or leveling off in agricultural production continued until the early period of the economic crisis in 1998. During the crisis period, however, the agricultural sector seemed to show some progress due to large devaluation in Indonesia’s currency, where some estate and cash crops, fisheries, and other h igh-value crops enjoyed high output prices. However, because the labor movement between agriculture and industry and between rural and urban economies did not flow smoothly due to limited absorption capacity, especially in rural areas, agriculture likewise experi-enced serious difficulties in maintaining growth performance. Unfortunately, the economic crisis coincided with the fall of President Soeharto’s administration in 1998, and some radical changes occurred in the development strategy.
The gaps inevitably presented political problems as farm incomes visibly fell behind incomes earned in the rest of the econ-omy. The long-run answer is faster integration of farm labor into the nonfarm economy, including the rural nonfarm econecon-omy. But such integration takes a long time. It was not fully achieved in the United States until the 1980s, and the productivity gap appears increas-ingly difficult to bridge through economic growth alone (Timmer 2009). Lagging agricultural earnings growth fosters deep political ten-sions over the course of the structural transformation, and those tenten-sions grow with the lag. The standard government response to these tensions has been to protect the agricultural sector from international competition and ultimately to provide direct income subsi-dies to farmers.
In order to ease the burden for farmers during the Asian economic crisis, the government increased the minimum purchase price for rice, reduced the annual interest rate on subsidized credit loans from 14 percent to 10.5 percent, and raised the maximum borrowing level for farmers. In 2003, the government reinstated fertilizer subsidies for domestically produced urea, SP-36, ZA, and NPK fertilizers solely for farmers producing on less than 2 hectares. The first directly elected president, Susilo Bambang Yudhoyono (SBY), started a development strategy by revitalizing agriculture. A detailed analysis of agricultural input subsidies was presented in the pre-ceding chapters.
In the first decade of the new millennium, the share of the agricultural sector in the GDP was 14.8 percent in 2012, a signifi-cant decrease from 17 percent in 2000. The share of the industrial sector declined signifisignifi-cantly from 47 percent in 2000 to 40.2 percent in 2012, which was a significant sign of deindustrialization in the Indonesian economy. Meanwhile, the share of the service sector in-creased from 36 percent in 2000 to 45 percent in 2012, due mostly to the growth of supporting service sectors in both private entities and government organizations. However, the Indonesian economy has not yet achieved the “Johnson” stage, where the labor and fi-nancial markets fully integrate the agricultural economy into the rest of the economy. The agricultural sector remains in a dual-econ-omy format, consisting of on one side a large number of smallholder farmers practicing traditional farming and on the other side a small number of large-scale agribusiness companies using more modern technology, good agricultural practices (GAP), and good man-agement practices (GMP). As mentioned previously, the growth performance of the agricultural sector was just about 3 percent per year in the past three years, about similar to the period before the global food crisis in 2008.
SUMMARY | APRIL 2010
Pathways of Agricultural Input Policy: The Significance of Seed and Fertilizer
Agricultural input policy has been one of the major instruments of food and agricultural policy in general since the 1970s, in addition to infrastructure, research and development (R&D), and extension services. Policies to promote modern agricultural inputs have become the main strategies during the Green Revolution, where Indonesia has translated the movement into Five Farm Principles (Panca Usa-hatani): high-yielding seed, fertilizer, irrigation, crop density, and pest management. Later, two more principles, postharvest and exten-sion systems, were added to become Seven Farm Principles (Sapta Usahatani). The current government administration has not signifi-cantly changed the policy on agricultural inputs, where farmers, mostly food crop farmers, are given price subsidies for fertilizer and high-yielding seed. These policy instruments are among several other instruments, including price procurement, financial supports, direct community assistance, rural agribusiness development, are rural economic institutions, for achieving self-sufficiency in the stra-tegic food commodities of rice, maize, soybean, sugar, and beef.
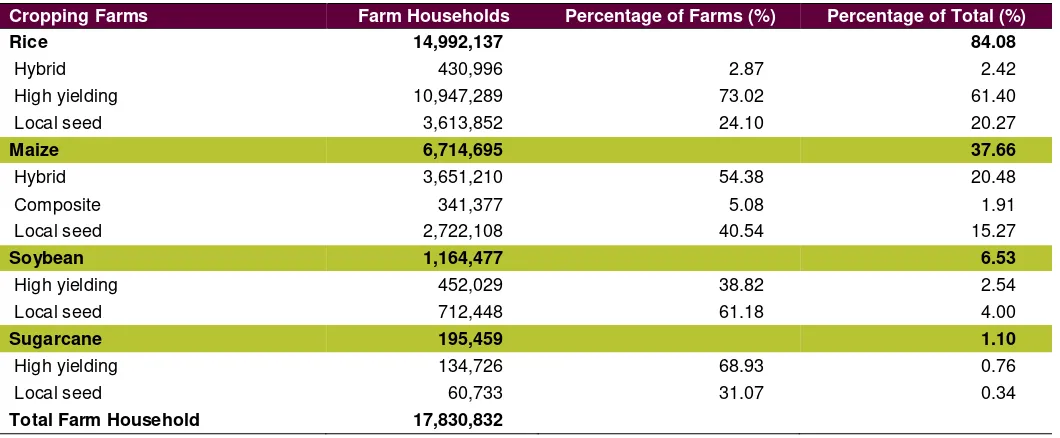
The significant increase in rice production in the past decade is partly attributable to the wider use of certified rice seed by farmers. More than 73 percent of rice farmers have used high-yielding seed, and more than 54 percent of maize farmers have even used hybrid seed. The percentage of soybean farmers and sugarcane farmers using high-yielding seed is also quite large, reaching about 39 percent and 69 percent, respectively. Farmers’ use of certified rice seed increased significantly from 117 thousand tons in 2005 to about 200,000 tons in 2012 for more than 13 million hectares of harvested area.
The growing demand for high-quality seed has encouraged investment in the rice seed breeding industry in the private sector. Two major rice seed producers in Indonesia are PT Sang Hyang Seri (SHS) and PT Pertani, state-owned enterprises that have been in business since the 1970s. The propagation of rice seed is also conducted by farmers and/or farmers’ groups in mostly rice-producing centers all over the country. Investors have established companies to produce high-quality seed and existing producers have expanded their production capacity. SHS built new facilities with a production capacity of 10,000 tons of seed per year. Foreign investors, such as PT BISI International, affiliated with the the Charoen Pokphand Group, PT DuPont Indonesia (Pioneer), PT Syngenta Indonesia, and PT Bayer Indonesia, have also shown interest. These private seed companies have been involved in producing and distributing hybrid maize across the country. The government policy on seed development has been quite conducive, as the requirement from private enterprises to invest in the seed-breeding industry is quite simple. Seed importing companies, including foreign-affiliated enterprises, can start producing seed domestically after operating for two years. Such a simple policy requirement has been in place in conjunction with the government policy to develop hybrid seed in maize and later hybrid seed in rice.
Rice seed is produced from the generative breeding of rice plants, under the recommendation of the National Seed Agency (Badan Benih Nasional), stipulated by the presidential decree, and technically commissioned by the Ministry of Agriculture. There are four varieties of high-yielding rice seed: breeder seeds (BS), foundation seeds (FS), stock seeds (SS), and extension seeds (ES). The seeds used by farmers are generally the extension seeds, which are the offspring of breeder seeds or foundation seeds. The hierarchy is as follows: breeder seeds are the source of foundation seeds or the foundation seeds are the first offspring of breeder seeds. Stock seeds are the offspring of breeder seeds or foundation seeds. Each seed is marked with a specific colored label. BS is yellow, FS is white, SS is purple, and ES is blue. A pink label is usually attached to the first offspring of ES, although in reality it is not easy to monitor.
Horticultural crops, namely vegetables and floriculture, are a second area where the private seed industry conducts breeding and supplies seed to farmers (Fuglie 1998). These companies are particularly active in providing improved seed that is exported or pro-cessed into high-valued products. Marketing linkages are often through large agribusiness companies with processing facilities or inter-national trade networks that contract with local farmers for the production of specific commodities. For example, one seed company provides viral-free microtuber potato seed to a private company that produces potato chips. The processing company multiplies the seed and distributes it along with other inputs and technical advice to contract farmers. The farmers produce potatoes and sell them back to the company at a price specified in the contract.
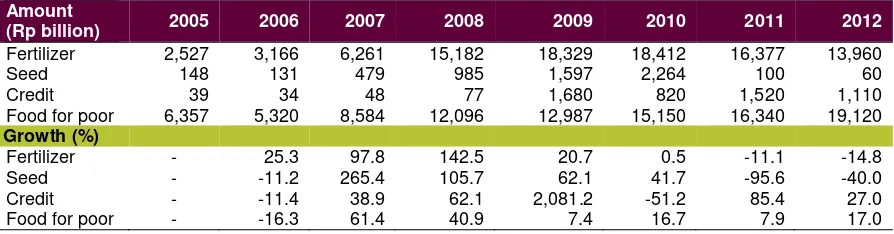
SUMMARY | APRIL 2010 Input policies in Indonesia require a significant amount of the state budget, especially for the subsidized programs for fertilizer, seed, food for the poor, and banking credits. The state budget is formulated in formal parliamentary sessions; thus, these policies go through the political process and are subject to a wide variety of interests and constituencies. The amount of seed subsidy in 2013 was Rp 1.45 trillion (US$14.5 billion), a significant increase from Rp 60 billion (US$6 million) in 2012. In 2012 the amount of fertilizer subsidy was about Rp 14 trillion (US$1.4 billion), and increased to Rp 16.2 trillion (US$1.62 billion) in 2013, or about similar to the fertilizer sub-sidy in 2011. The amount of food subsub-sidy for the poor in 2013 was Rp 17.2 trillion (US$1.72 billion), a decrease from that in 2012 of Rp 19.2 trillion (US$1.92 billion), mostly because the poverty level decreased slightly. Some government agencies are planning to imple-ment an exit strategy of the Rice for the Poor program, which has been in place for the past 14 years, or since the Asian financial crisis in 1998. In addition, the amount for credit programs was budgeted at Rp 1.25 trillion (US$12.5 billion) in 2013, a slight increase from Rp 1.1 trillion (US$1.1 billion) in 2012.
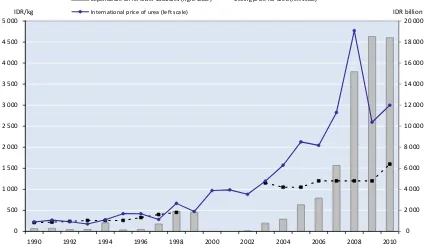
Figure 2.3.1 shows the historical perspective of budget expenditures on fertilizer subsidies in the past two decades, the ceiling price of urea in the domestic market in Indonesia, and subsequent prices in the international market.
Figure 2.3.1—Expenditures on fertilizer subsidies and price of urea, 1990–2010
Source: OECD (2012), Ministry of Agriculture (2011).
The amount of expenditure on fertilizer subsidies increased more than 100 percent, from Rp 3.2 trillion (US$32 billion) in 2006 to Rp 6.3 trillion (US$63 billion) in 2007. During the world food crisis, parliament members agreed to triple to expenditure on fertilizer subsidies in 2008 to Rp 15.2 trillion (US$1.52 billion) compared to that in 2007 to maintain food production and self-sufficiency. Since then, the fertilizer subsidy remains very high, although the actual problems of fertilizer use and availability were not fully solved. One should note that the fertilizer subsidy in Indonesia is not a direct price subsidy to farmers, as the main consumers of fertilizer, but an indirect subsidy given to the state-owned enterprises (SOEs) of fertilizer producers under the fertilizer holding company PT Pupuk Indo-nesia (then PT Pusri Holding). The subsidy is given to these companies to compensate for the world market’s soaring price of gas, the main input for urea production. Similarly, the seed subsidy is not given directly to farmers to ensure the use of certified high-yielding seed, but instead is given to two main seed producers of SOEs, PT Sang Hyang Seri (PT SHS) and PT Pertani. In addition, these compa-nies are also developing some trials to test the compatibility of specific high-yielding varieties at specific locations for specific crops.
The Central Agency of Statistics (BPS) conducted a complete farm survey in 2009 on the use of inputs for food crop households, particularly rice, corn, and soybean. Table 2.3.1 shows the results. The use of fertilizer among rice farmers in Indonesia is very high at about 92 percent of 15 million rice farmers. Nearly 68 percent of these farmers use chemical fertilizer only, less than 1 per-cent use organic fertilizer only, and 23.5 perper-cent use both fertilizers. The perper-centage of fertilizer use in corn farmers is quite different
0
1990 1992 1994 1996 1998 2000 2002 2004 2006 2008 2010
IDR/kg Expenditure on fertiliser subsidies (right scale) Ceiling price for urea (left scale)
SUMMARY | APRIL 2010 from those in rice farmers, where about 85 percent of corn farmers use fertilizer; 36.8 percent use chemical fertilizer, 2 percent use organic fertilizer, and 46 percent use both chemical and organic fertilizers. The proportion of soybean farmers who use fertilizer is 81.5 percent; 42.3 percent use chemical fertilizer, 7.3 percent use organic fertilizer, and 31.8 percent use both chemical and organic fertiliz-ers. The figures of fertilizer use in sugarcane farmers do not differ very much from those of rice farmers, where 67.4 percent of sugar-cane farmers use chemical fertilizer, 2.2 percent use organic fertilizer, and 29 percent use both chemical and organic fertilizers.
Table 2.3.1—The use of fertilizer by cropping farms, 2009
Cropping Farms No Fertilizer Chemical Fertilizer Organic Fertilizer Chemical +
Or-ganic Total
Rice
Farm households 1,225,700 10,155,465 94,112 3,516,860 14,992,137
Percentage 8.18 67.74 0.63 23.46 100.00
Maize
Farm households 1,010,330 2,472,889 134,648 3,096,828 6,714,695
Percentage 15.05 36.83 2.01 46.12 100.00
Soybean
Farm households 215,717 492,888 85,173 370,699 1,164,477
Percentage 18.52 42.33 7.31 31.83 100.00
Sugarcane
Farm households 2,819 131,633 4,324 56,683 195,459
Percentage 1.44 67.35 2.21 29.00 100.00
Source: BPS, Farm Survey, July 2009.
Table 2.3.2 shows seed use in the same categories of food crop households. In 2009, Seventy-three percent of rice farmers used high-yielding seed, but only 40 percent of soybean farmers did. As presented previously, the yield of soybean is now only 1.5 tons per hectare and total production is less than 850 thousand tons, far below the required level of self-sufficiency of 2.5 million tons. The use of hybrid seed and composite seed by maize farmers is quite high, reaching 59 percent, while the remaining 41 percent of maize farmers are quite comfortable using local seed. Maize productivity in Indonesia is quite high, averaging 4.9 tons per hectare, which is very high for Southeast Asian country standards.
Table 2.3.2—The use of seed by cropping farms, 2009
Cropping Farms Farm Households Percentage of Farms (%) Percentage of Total (%)
Rice 14,992,137 84.08
Hybrid 430,996 2.87 2.42
High yielding 10,947,289 73.02 61.40
Local seed 3,613,852 24.10 20.27
Maize 6,714,695 37.66
Hybrid 3,651,210 54.38 20.48
Composite 341,377 5.08 1.91
Local seed 2,722,108 40.54 15.27
Soybean 1,164,477 6.53
High yielding 452,029 38.82 2.54
Local seed 712,448 61.18 4.00
Sugarcane 195,459 1.10
High yielding 134,726 68.93 0.76
Local seed 60,733 31.07 0.34
Total Farm Household 17,830,832
Source: BPS, Farm Survey, July 2009.
SUMMARY | APRIL 2010 and total production of strategic foods and other agricultural commodities, and thus farmers’ income. The government should improve R&D policy and empower research centers and universities throughout the country and at the local level. For example, if policy pro-moted biotechnology development in the agricultural sector, then the private sector would be encouraged to play a role, especially to participate in R&D, develop new innovations, and weigh in on business decisions and policymaking processes. Subsidies on agricultural inputs, such as fertilizer and seed, is one step, but improving the extension system and mobilizing extension agents in rural areas are other important means to agricultural development in Indonesia.
Regarding capital inputs, most Indonesian farmers have to rely on their own capital, posing serious challenges for agricultural financing in the country. The amount of credit being disbursed to the agricultural sector in 2012 was Rp 150 trillion (US$15 billion), or only 5.5 percent of the Rp 2.8 thousand trillion (US$280 trillion) in banking credit disbursed in the country. Besides using their own fi-nancial capital (94.4 percent), rice farmers sometimes obtain fifi-nancial capital from money lenders and collector traders (4.3 percent), whereas cooperatives and banks combined only contribute less than 1 percent of the capital input. Similar figures are found for corn farmers and soybean farmers who depend on their own capital (94.5 and 96.3 percent, respectively), whereas the capital from money lenders is 4.1 and 2.5 percent, respectively, and the capital from cooperatives and banks combined is less than 1 percent. Even though the amount of capital input is not as much as that in the other three main crops of rice, corn, and soybean, a slightly different figure is found in sugarcane farmers who obtained a subsidized credit channeled through cooperatives (5.5 percent) and banks (2.9 percent), in addition to their own sources of capital (85.2 percent). In short, the policies on agricultural financing have to be properly formulated as the agricultural sector faces greater challenges for food security in the future.
KEY DRIVERS OF CHANGE IN AGRICULTURAL INPUT POLICY
Origins of Agricultural Input Policy
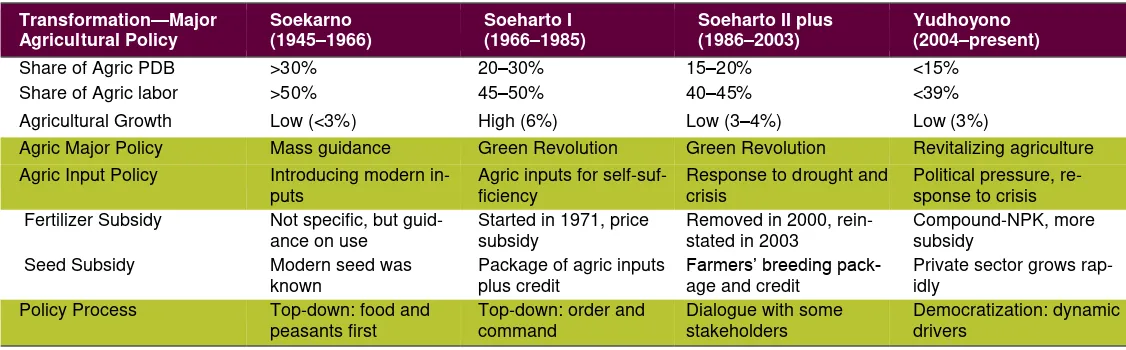
Agricultural input policy in Indonesia is a function of the agricultural development strategy and the confidence of the government to implement a particular strategy. During the first government administration of President Soekarno after Indonesian Independence in 1945, the agricultural development strategy cannot be separated from the political struggle to finance the economic development pro-cess of the newly born country. The administration of President Soeharto was able to exercise different policy regimes by adopting Green Revolution technology and shifting economic development to encourage renewable resources in the country. During the Asian economic crisis, Indonesia formulated its agricultural development in response to the crisis and the severe El Niño drought by adopting social safety net programs. Finally, President Susilo Bambang Yudhoyono (SBY) has emphasized revitalizing agriculture under the broader quadruple-track development strategy of pro-growth, pro-job, pro-poor, and pro-environment. The following key drivers of agricultural input policy, summarized in Table 3.1.1, are derived from existing literature, interviews with competent resource persons, and synthesis from data analysis and information made available for the study.
Table 3.1.1—Historical matrix of key drivers of Indonesia’s agricultural input policy
Transformation—Major
in-SUMMARY | APRIL 2010 (a) Agricultural Development Strategy
The agricultural development strategy during the administration of President Soekarno in the 1960s employed an innovative program of mass guidance (BIMAS) and mass intensification (INMAS) in order to introduce modern inputs to farmers, who are mostly small scale in nature. The government provided subsidized high-yielding seed and chemical fertilizer in a packaged program mostly for rice farmers and provided massive guidance directly to the farmers by employing final-year students at Bogor Agricultural University (IPB). The agri-cultural development strategy during the early stages was mostly the spirit to achieve self-reliance. The Green Revolution movement was the basic foundation of the agricultural development strategy during the administration of President Soeharto in the 1970s. The major strategy was the adoption of special intensification (INSUS), a slightly modified INMAS, by using the command and control system all over the country. The government was really concerned with the use of high-yielding crop varieties and subsequent use of chemical fertilizer, in order to increase crop production and the productivity, by setting the maximum retail price (MRP or HET, harga eceran tertinggi) for four major fertilizers: urea, ammonia (ZA), phosphors (TSP), and potassium (KCl). To determine the amount of subsidy, the government adopted the Farm Formula (Rumus Tani), or the ratio of paddy to urea of 1 to 1—that is, the price urea should be compara-ble to the dry non-husked paddy.
In addition to the fertilizer subsidy, the government also provided subsidized interest on agricultural financing, and even cost of living for farmers during the early production cycles, in the form of package programs, mostly for food crops and strategic cash crops. The agricultural development strategy was implemented through massive infrastructure development, mostly roads, bridges, water canals, and irrigation and drainage systems. The agricultural development strategy was interrupted during the Asian economic crisis at the end of the 1990s, when the International Monetary Fund (IMF) removed most subsidy programs in the country. During the admin-istration of President Megawati Soekarnoputri, the fertilizer subsidy was reinstated in 2002 to complement the agricultural develop-ment strategy of putting the farmers first and promoting small farmers. Finally, President Yudhoyono announced an agricultural devel-opment strategy of revitalizing agriculture, especially during the era of the multiparty system. The agricultural input policy seems to be weak, with poor policy direction, as shown by inefficiency outcomes in both input use and output achievement. Since 2009, the ferti-lizer input subsidy has increased more than triple that of the previous years, marking more subsidy dependency but poor governance principles at the policymaking, policy organization, and policy implementation levels.
(b) Major Long Droughts
The major long droughts that influenced agricultural input policy were the El Niño drought seasons in 1987–1988 and 1992–1993. Ini-tially, the government was planning to reduce the amount of subsidy by tightening eligibility and shifting economic development policy to promote deregulation in some strategic sectors. Over the seven years from 1984 to 1990, fertilizer subsidies cost the government an annual average of Rp 650 billion (US$440 million). However, because agricultural production in general started to decline and growth performance was moderate to low, the government increased the agricultural budget, particularly to offset the negative impacts of long droughts and seasonal uncertainty. After the 1990s, the cost of the fertilizer subsidy was about 17 percent of the annual budgetary expenditure supporting agriculture.
Nevertheless, the growth performance of the agricultural sector was only 3.4 percent per year during the period of 1990– 1997, and the growth of labor productivity in the sector was less than 2 percent per year. During the economic crisis of 1997–2000, the agricultural sector also suffered from a high rate of inflation, brought about by the Asian economic crisis. Coincidently, another major long drought of El Niño once again occurred in many parts of the country, causing a serious decline in food production. Indonesia had to depend on huge rice imports of 5.8 million tons and 1.5 million tons in 1998 and 1999, respectively, although food-policy misman-agement could have served as a major cause. The Asian economic crisis occurred coincidently with the political crisis in Indonesia, lead-ing to the fall of President Soeharto in 1998. Interim president BJ Habibie’s government allocated more than Rp 5 trillion (US$50 billion) for agricultural subsidies on farm credits (Kredit Usaha Tani, KUT), amounting to Rp 2 to 5 million per household, in order to overcome the impact of the economic crisis. Farmers could utilize the funds to purchase seed, fertilizer, and other capital as long as they met the objectives of increasing productivity and farm incomes.
(c) Economic Crisis