Evaluation of landslide causative factors
towards efficient landslide susceptibility
modelling in the Cameron Highlands, Malaysia
A. N. Matori
1& A. Basith
2 1Department of Civil Engineering, Universiti Teknologi Petronas, Malaysia
2
Deparment of Geodetic Engineering, Gadjah Mada University, Indonesia
Abstract
Landslide is complex interactions involving various terrain parameters and caused by various causative factors, even though each of them may not be equally significant to the occurrences of landslide. Hence to produce an efficient landslide susceptibility map (LSM) it is crucial to decide whether to include all the causative factors or otherwise. This paper presents evaluation of the relative role of landslide causative factors from which an efficient landslide susceptibility model could be constructed. Ten factors are used in this study namely lithology, geology lineament, soil, road network, river/drainage, land use land cover, slope, slope aspect, curvature, and elevation. Several scenarios were used in which causative factors are used in the modeling of LSM. A number of final LSMs are produced as the result of applying the above different scenarios. From the assessment of the accuracy of the LSM produced, it could be concluded that involvement of all factors does not guarantee of producing accurate LSM. On the other hand, using only six significant factors which are soil type, distance from road (hence cut slope), proximity to river and lake and elevation produces more accurate LSM.
1
Introduction
Provision of landslide susceptibility/hazard maps by individual is in line with one of Malaysia National Slope Master Plan programs. Landslide occurrences are almost reported every year in this country. According to landslide inventory record compiled by JKR (Public Work Department of Malaysia) [1], the total estimated loss due to landslides from 1973 to 2007 approximately reached US$1.0 billion. The estimated loss included loss of life, injury cost, landed property damage, vehicle damage, direct relocation cost and restoration cost. One of such loss components was related to utilization of landslide prone areas for urban expansion, such as for settlement. A map depicting susceptible areas to landslide is required in order to reduce the landslide losses by means of avoiding such areas for extensive urban expansion.
A landslide occurrence is the result of complex interactions between factors such as terrain, slope, elevation, curvature, slope aspect, geology factors such as geology lineament, soil and rock, and triggering factors such as rain fall. Hence, spatial modeling of landslide susceptibility would also require those mentioned factors. Human has a role in changing natural land cover into land cover of human interests such as settlement, crop land, and urban areas. Therefore, land use land cover data is required for landslide susceptibility modeling. Van Westen
et al. [2] and Guzzetti [3] suggested using all possible factors in the modeling. Meanwhile, different number and kind of landslide factors were used for landslide susceptibility modeling such as mentioned in [4–7].
seasons, March to May and September to January, the number of landslide occurrences is larger than the remaining months (dry seasons). This indicates that rainfall plays an important role in landslide occurrences. All these information indicate that this area is appropriate for landslide study.
Figure 1: The study area.
Figure 2: Landslide occurrences and rainfall pattern at the study area.
2
Data and methodology
2.1 Spatial data
The eleven landslide factors are shown in table 1. In this paper, the process of derivation of such data from the respective data sources is not discussed. Detail processing procedures can be found in Matori et al. [10]. All data were in prepared in raster format with 30 meter spatial resolution. RSO (Rectified Skew Orthomorphic) is local projection system applied to all spatial data. Description of each landslide factor is given in the following.
Table 1: Spatial data for landslide susceptibility modeling.
Source of data Derived Spatial data Issuing agency Topographic map 1. Elevation Department of Survey and
Mapping Malaysia (DSSM)
Landsat 7 image 7. LULC Malaysia Remote Sensing Agency (ARSM) Path/Row: 268/341
Geology map 8. Rock type Minerals and Geoscience Department Malaysia
9. Lineament
Soil map 10. Soil map European Soil Portal at http://eusoils.jrc.ec.europa.eu/
Topographic map-derived spatial data indicates the characteristics of the study area. The elevation map indicates that about 70% of the study area is above 900 meter and the average height is 1106 meter. These facts confirm the study area as highlands area. The slope map indicates that moderate slopes dominate the study area (31%) followed by shallow slopes (25%). Steep and the steepest slopes cover about 29% of the area. The remaining area is flat slope that occupies 15% of the area. The elevation and slope maps are divided into 5 classes. In the study area, slope aspect map indicates that almost the same portion of slope (12-13%) facets face to all wind directions except flat and north facing slopes. The curvature map indicates that the study area is dominated by concave shape, allowing water accumulating elsewhere. In turn, it can increase erosion rate. The curvature map was classified into 5 classes.
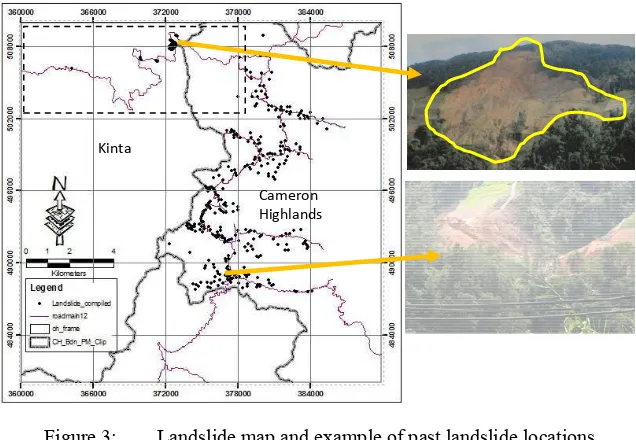
Figure 3: Landslide map and example of past landslide locations.
Similar to road map, river and lake map shows fives zones constructed using Euclidean distances. Erosion and slope failure often take place along the moving water body. In addition, high level of landslide hazard took place along the river [11]. This is why this factor is considered as a landslide contributing factor [12, 13]. As the case of road map, more rivers and lakes identified from the Landsat image were added to the old river and lake map through digitizing process. Land use land cover map consists of five types namely forest, cropland, river, open land, and urban. Forest dominates the study area (about 74%). Cropland occupies 20% of the study area. The remaining areas are occupied by urban/built up and water body ones. This map was produced through image processing stages applied to Landsat 7 image dated September 20th, 2001.
The lithology map indicates that granite coverage dominates the study area (83% of the study) followed by sedimentary rock (14.45%), schist (2.41%) and alluvium (0.14%). The geology lineament map shows Euclidean distance from any points on the map from the closest geology lineaments. There are about seven major geology lineaments of the study area. The soil map of the study area consists of three soil types namely, 1) Red-Yellow Podzolic soil with Reddish-Brown Lateritic soils on residual materials from acid to intermediate igneous rocks, arenaceous, argillaceous, and mixed sediment, 2) Podzols and Lithosols on acid igneous rocks at elevations above 5000 feet, and 3) Red-Yellow Podzolic soils with Lithosols on acid to intermediate igneous rocks. The latter dominates 86.2% of the study area followed by the soil type 1 (12.4%) and 2 (1.4%). In order to evaluate significant role of landslide factors, a set of landslide or slope failure locations was used for map verification. This data was compiled from site survey carried out in 2006 and 2008 and the one issued by ARSM as
reported in [14]. The total number of landslide locations is 343. It consists of past landslide sites.
2.2 Landslide susceptibility index and mapping
A particular class of a landslide factor can have higher landslide susceptibility index (LSI) than the remaining classes. Landslides occurred more frequent in a particular class such as elevation of 1130.6-1249.5 m has the highest LSI. Among land use land cover types, open land has the highest LSI. LSI is an objective measure for landslide occurrences that respect to different classes of a landslide factor. It is a ratio between the landslide area within a particular class and the area of the respective class. LSI was used to derive a weightage system for each class of all landslide factors [4]. A class of a particular landslide factor with the highest LSI was assigned a maximum weight value (W), i.e. 100. The remaining classes were assigned weight values proportional to landslide occurrences in classes. Landslide susceptibility (LS) at j pixel is pixel-based weight values summation of landslide factors i (eqn. (1)). A landslide susceptibility map (LSM) expresses LS of any points on the map. The landslide map is divided into five susceptibility categories, namely Very High (VH), High (H), Moderate (M), Low, (L) and Very Low (VL).
2.3 Strategies on landslide susceptibility modelling and maps validation
To achieve the research objectives, several scenarios to construct LSMs are applied to allow evaluation on the significance of landslide factors. The scenarios are as follow:
a. Scenario 1: using ten factors listed in table 1.
b. Scenario 2: using selected factors referring to the work of Anbalagan [3] with necessary modification due to the unavailability of some factors such as replacement of relative relief with distance from lineament, and water condition with distance from river and lake. The factors consist of slope, distance from river and lake, distance from lineament, rock type, soil, and LULC.
aspect, were processed using the same manner. All LSMs resulted from this scenario were validated using the landslide map. Landslide factors were ranked based on the number of validated points achieved when a particular landslide factor was added. The rank states the significant role of landslide factors with the exception of the basic factors that were presumed to be significant. A dataset containing six selected significant factors was used to derive a LSM. Six number of landslide factors were selected in order to be comparable with that of scenario 2.
The LSMs resulted from all scenarios were validated using landslide map. Validation of landslide models applies well known and widely applied principle that is ‘the past and present are keys to the future’ [15, 16]. The author made a practical assumption that the existing landslide/slope failure should fall in VH and H susceptibility categories on the produced LSMs. The number of existing landslide sites falling in these two categories were used to measure the accuracy of the LSMs and evaluate the significance of the landslide factors.
3
Results and discussion
Three LSMs were produced using the scenarios described previously. Fig. 4 shows an example of the LSM constructed using all (ten) landslide factors. Landslide locations are overlaid on top of the map. Areas fall in these two categories (Very High and High susceptibility) are mainly located around the road, indicated by number 1, and crop land, indicated by number 2 in fig. 4.
Figure 4: LSM constructed using ten landslide factors.
2
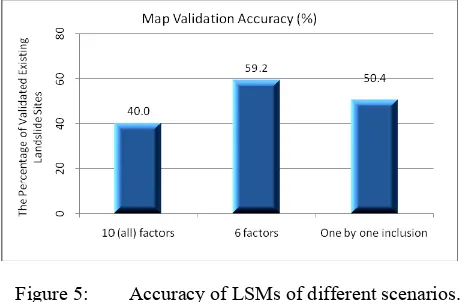
Scenario 1 produced a LSM with the accuracy of 40% (fig. 4). About 173 of 343 landslide sites fell in categories of VH and H susceptibility. In this scenario, each landslide factor was treated to have the same influence to landslide occurrence since the relative importance between landslide factors was not known. Scenario 2 produced a LSM with the accuracy which is better than the previous scenario, namely 59.2%. It means that about 203 of 343 landslide sites fell in categories of VH and H susceptibility. This scenario involved only six landslide factors, a lesser number of landslide factors than those of the first scenario. As the case of the first scenario, the relative importance between factors was not considered. From these two scenarios, it can be concluded that a large number of landslide factors incorporated in landslide susceptibility mapping did not guarantee to result in more accurate LSM. Six landslide factors produced more accurate LSM that ten factors. A question than arose that there should be landslide factors that were not significant to involve in constructing a LSM.
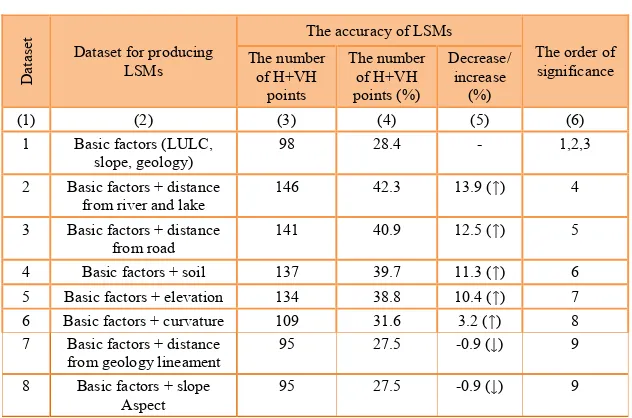
In order to answer the above question, one by one inclusion method was applied. Table 2 shows the result of this method. Column 2 shows the dataset for producing LSMs. Column 3 and 4 represent the accuracy of the map indicated by the number of existing landslide locations falling in the H and VH susceptibility categories. Column 5 represents the increase or decrease of the accuracy of LSMs that respect to the accuracy of LSM produced from the first dataset (the basic factors). The landslide factors were then ranked based on indication of increase or decrease on column 5.
Table 2: The order of significance of causative factors.
Dataset
2 Basic factors + distance from river and lake
146 42.3 13.9 (↑) 4
3 Basic factors + distance from road
141 40.9 12.5 (↑) 5
4 Basic factors + soil 137 39.7 11.3 (↑) 6 5 Basic factors + elevation 134 38.8 10.4 (↑) 7
6 Basic factors + curvature 109 31.6 3.2 (↑) 8
7 Basic factors + distance from geology lineament
95 27.5 -0.9 (↓) 9
8 Basic factors + slope Aspect
Based on ranked landslide factors on table 2, six significant landslide factors were selected i.e. LULC, slope, distance from road, distance from river and lake, soil, and elevation. This data set is almost similar to that of scenario 2 except that rock type and distance from geology lineament were replaced by distance road and elevation. The LSM produced from the selected dataset has the accuracy of 50.4%, meaning that about 172 of 343 existing landslide locations can be predicted as having H and VH susceptibility. Fig. 5 shows the accuracy of LSMs. The graph clearly shows that six selected landslide significant factors are sufficient number for modeling landslide susceptibility in the study area. The accuracy of LSMs produced using six factors (scenario 2 and 3) is higher than that produced using ten factors (scenario 1). Landslide factors identified as significant factors, shown in table 2, can further be used to efficiently produce LSM. Modeling landslide susceptibility does not require all factors to be involved. Otherwise, a limited number of significant factors were proven to be sufficient for landslide susceptibility modeling.
Figure 5: Accuracy of LSMs of different scenarios.
The accuracy of LSMs of scenario 2 and 3 is around 50%. It means that the accuracy of these maps is considered as low. To overcome this situation, GIS overlay method may be refined by putting appropriate weightage to a particular landslide factor based on the order of significance of landslide factors presented in table 2. This matter is out of the scope of this paper.
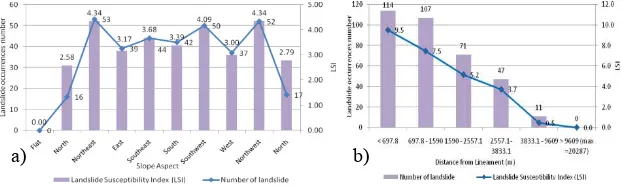
Figure 6: Landslide occurrences against (a) slope aspect and (b) distance from lineament.
4
Conclusions
Several conclusions could be drawn from this investigation. Initially ten factors were used in this study namely lithology, geology lineament, soil, road network, river/drainage, land use land cover, slope, slope aspect, curvature, and elevation. Several scenarios were used in which the above causative factors were used in the modeling of LSM. It was observed LSM produced utilizing more landslide factors does not necessarily guarantee to have more accuracy. On the other hand an accurate LSM could still be constructed from limited number of significant factors which are soil, distance from road (hence cut slope), proximity to river and lake, and elevation. These factors in combination with the basic factors can be used for efficient landslide modeling with sufficient accuracy.
Acknowledgement
The authors would like to thank to Universiti Teknologi PETRONAS for the support of this research work.
References
[1] JKR, “National Slope Master plan 2009-2023,”Kuala Lumpur: Cawangan Kejuruteraan Cerun, 2009.
[2] C. J. Van Westen, N. Rengers, M. T. J. Terlien, and R. Soeters, “Prediction of the occurrence of slope instability phenomenal through GIS-based hazard zonation,” Geologische Rundschau, vol. 86, pp. 404-414, 1997. [3] F. Guzzetti, “Landslide Hazard Assessment and Risk Evaluation: Limit and
Prospectives,” in The 4th EGS Plinius Conf. on Mediterranean Storms, Mallorca, Spain, 2002.
[4] R. Anbalagan, “Landslide hazard evaluation and zonation mapping in mountainous terrain,” Engineering Geology, vol. Vol. 32, pp. 269-277, 1992.
[5] Q. Liao, “GIS-Based Landslide Hazard Zonation Mapping using Statistical Approaches,” PhD Dissertation, Dep. Civil Eng., Univ. Arkansas, Arkansas, 2004.
[6] K. M. Neaupane and M. Piantanakulchai, “Analytic Network Process Model for Landslide Hazard Zonation,” Engineering Geology-Elsevier, vol. 85, pp. 281-294, 2 May 2006 2006.
[7] M. Süzen and V. Doyuran, “A comparison of the GIS based landslide susceptibility assessment methods: multivariate versus bivariate,”
Environmental Geology, vol. 45, pp. 665-679, 2004.
[8] A. Van der Ent and C. Termeer, “Study on River Water Quality of The Upper Bertam Catchment,” R.E.A.C.H. - Saxion University of Applied Science Deventer, 2006.
[9] MMD, “Rainfall Intensity and Rainfall Days at Cameron Highlands,” Malaysia Meteorological Department, 2009.
[10] A. N. Matori, A. Basith, and I. Harahap, “Study of regional monsoonal effects on landslide hazard zonation in Cameron Highlands, Malaysia,”
Arabian Journal of Geosciences, pp. 1-16, 2011.
[11] J. G. Liu, P. J. Mason, N. Clerici, S. Chen, A. Davis, F. Miao, H. Deng, and L. Liang, “Landslide hazard assessment in the Three Gorges area of the Yangtze river using ASTER imagery: Zigui-Badong,” Geomorphology, vol. 61, pp. 171-187, 2004.
[12] L. Zhu and J.-f. Huang, “GIS-based logistic regression method for landslide susceptibility mapping in regional scale,” Journal of Zhejiang University - Science A, vol. 7, pp. 2007-2017, 2006.
[13] Z. Chuanhua and W. Xueping, “Landslide Susceptibility Mapping: A Comparison of Information and Weights-of-Evidence Methods in Three Gorges Area,” in Int. Conf. on Environmental Science and Information Application Technology (ESIAT), 2009, pp. 342-346.
[14] B. Pradhan, S. Lee, and M. F. Buchroithner, “Use of geospatial data and fuzzy algebraic operators to landslide-hazard mapping,” Application Geomatics, Springer, vol. 1, 2009.
[15] D. J. Varnes, “Landslide Hazard Zonation: A Review of Principles and Practice,” Commission on Landslides of the IAEG, UNESCO, Natural Hazard, vol. No. 3, p. 61 pp, 1984.