i
PROCEEDING
OF ISAE INTERNATIONAL SEMINAR
BANDAR LAMPUNG
AUGUST 10-12, 2017
“Strengthening Food and Feed
Security and Energy Sustainability to
Enhance Competitiveness”
DEPARTEMENT OF AGRICULTURAL ENGINEERING
FACULTY OF AGRICULTURE
219
C.1
SIMULTANEOUS DETERMINATION OF L-ASCORBIC ACID AND GLUCOSE IN
MIXTURE SOLUTION USING FTIR-ATR TERAHERTZ SPECTROSCOPY
COMBINED WITH PLS2 REGRESSION
Diding Suhandy
1and Meinilwita Yulia
21Department of Agricultural Engineering, the University of Lampung, Jl. Prof. Dr. Soemantri Brojonegoro No. 1 Gedong Meneng,
Bandar Lampung, 35145, Indonesia
2Department of Agricultural Technology, Lampung State Polytechnic, Jl. Soekarno Hatta No. 10 Rajabasa, Bandar Lampung,
35144, Indonesia
E-mail: [email protected] ; [email protected]
ABSTRACT
This study deals with the simultaneous determination of L-ascorbic acid (L-AA) and glucose in mixture
solution samples, by using terahertz (THz) spectroscopy and partial least squares regression technique.
A calibration set consisting of 34 binary mixture solutions was applied for the construction of PLS model.
The proposed procedure was successfully applied for the simultaneous determination of L-AA and
glucose with acceptable result. The root mean square error of prediction (RMSEP) of 16 prediction
samples was determined to be 2.55% and 1.92% for L-AA and glucose, respectively. SDR
predof 2.880 and
4.730 could be obtained for L-AA and glucose, respectively.
Keywords
:
THz spectroscopy; PLS2 regression; L-ascorbic acid; glucose; mixture solution.
I. INTRODUCTION
L-ascorbic acid (L-AA), or vitamin C, is one of the water-soluble vitamins. It can be extracted widely in many biomaterials, such as fruit and vegetables. Recently, many food products, such as juices or sports drinks, are fortified with L-AA. During long storage and transportation, the quality of fruit juice is possible to change. Reference [1] reported that vitamin C concentration of orange, lemon, grapefruit and tangerine decreased after eight weeks of storage. It was also reported that at high temperature of storage (45°C), degree of vitamin C loss is higher than that at low temperature of storage (28°C). Reference [2] reported that content of ascorbic acid in orange juice from PET and glass bottles stored at 4°C and 25°C decreased after several days of storage. For this reason, it is very important to develop a new bio-sensing method which can be able to identify the concentration of vitamin C or L-ascorbic acid (L-AA) and other component of juices nondestructively without opening the packaging material of juice. This kind of sensor is important to establish a total quality management system for food quality and safety which can benefit both producers and customers. For this reason, it is highly desirable to be able to quantify L-AA in foods, especially in juices or sports drinks, for quality control purposes.
Many papers have established non-spectroscopic methods for L-AA determination. These conventional methods include titrimetry, chemiluminescence, fluorometric, chromatographic and electrochemical methods [3], [4]. Each method though has its limitations. For example, while the titrimetry method using dichlorophenolidophenol as the titrant is rapid, the titrant itself is unstable and must be standardized before use. In the case of the chromatographic method, while it is accurate, it is expensive and time consuming.
Of the spectroscopic methods, reference [5] reports using near infrared (NIR) spectroscopy coupled with step-wise multiple linear regression (SMLR) and partial least squares (PLS) regression to determine L-AA in pharmaceutical products at concentrations of 16.67%, 22.88% and 40% . In this analysis relative standard error (RSE) was used to assess the quality of the calibration and validation model, both for the SMLR and PLS regression. The RSE for the SML regression was 0.59-1.82% (calibration), and 0.72-2.34% (validation); and 0.69-2.46% (calibration), 0.89-2.85% (validation) for PLS regression. Spectroscopic methods using NIR, Mid Infrared (MIR) and Raman spectroscopy for determination of L-AA in powder and liquid samples has been reported [6]. In these measurements, coefficients of determination (R2) for L-AA were 0.966-0.999, 0.973-0.980, and 0.941 for MIR, NIR
and Raman spectroscopy, respectively.
220
[7]. In recent report, the improvement of L-AA determination using THz spectroscopy by applying iPLS regression has been published [8]. This result may lead to a new application of THz spectroscopy for L-AA determination in juice samples especially for juice inside packing material in which THz waves have ability to penetrate the packing materials with low photon energy (safe for biological sensing). However, since that in real juice samples there are many kind of substances inside the juice solution, therefore to realize inspection system using THz spectroscopy for juice samples, it is desired to investigate the ability of measure L-AA in more complex solution (not only in pure L-AA solution). In the present study, first attempt to measure L-AA in mixture solution using THz spectroscopy was investigated by using binary mixture of L-AA and glucose solution. The present study highly contributed to open the development of using THz spectroscopy as new sensor in biological solution in more complex solution.
II. MATERIALSANDMETHODS
A. Samples
Fifty samples of binary mixture solution of L-ascorbic acid (L-AA) and glucose were used as samples. The binary mixture solutions were prepared by dissolving appropriate amounts of L-AA powder (Wako Pure Chemical Industries, Ltd., Japan) and glucose powder (Grade: Guaranteed Reagent (GR); Nacalai Tesque, Inc., Kyoto, Japan) in distilled water. The ranges of concentrations were from 2.6446 to 26.4709% (mass percent, w/w) for L-AA and
from 2.1660 to 33.3605% (mass percent, w/w) for glucose. For each sample, 300 μL of mixture solution were used
for spectral acquisition.
B. Devices for FTIR-THz-ATR spectroscopy
THz spectra of mixture solutions were acquired using a Fourier-transform infrared (FTIR) based spectrometer (FARIS-1S, JASCO Corp., Japan). This system is based on a FTIR spectrometer (range of measurement: 20-450 cm -1 or 0.6-13.5 THz) with a special light source made from a high pressure mercury lamp as a THz generating device.
(See reference [7] for detail explanation of the system).
C. FTIR-THz-ATR spectroscopy
FTIR-ATR-THz spectra of the mixture solutions were acquired in the range 20-450 cm-1, using a 16 cm-1 of
resolution. Each spectrum contains on average 200 scanning spectra. The reference for air was measured every 5 samples. The spectra intensity of samples and reference were obtained in single beam (SB) unit. During THz spectral measurement, the laboratory temperature and relative humidity were maintained at around 25°C and 65-70%, respectively. For each samples, the spectral measurement was conducted at constant temperatures of 24°C. To obtain this sample temperature, the temperature of silicon prism was controlled at 24°C. The absorbance value of the sample was calculated using equation 1 [7].
is intensity of sample at wavenumber?
R
is intensity of air reference at wavenumber
The calculated absorbance value was corrected using the ATR correction function provided in the software (JASCO Spectral Manager, JASCO Corp., Tokyo, Japan). The corrected values were used for further analysis.
D. Selection of the calibration sample set
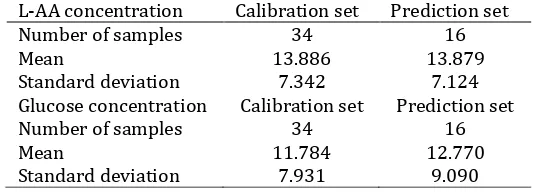
221 The samples (50 samples) were divided in two different sets: (i) calibration, and (ii) prediction. The first sample set was used to develop calibration and performing full-cross validation test. The prediction sample set was used to evaluate the performance of the develop calibration model. The way to select the calibration and prediction sample set was as followed: first all samples were sorted based on L-AA values from the highest to the lowest. Then, from the highest L-AA we pick up 2 samples for calibration and 1 sample for prediction and repeat the process until the lowest L-AA. For this we selected 34 samples for calibration set and 16 samples for prediction sample set. Table 1 shows the composition of the different sets of the samples, including the maximum, minimum and average value of the L-AA and glucose.
E. Chemometric analysis
Chemometric analysis, including quantification analysis was carried out using The Unscrambler v. 9.2 software packages from Camo (Camo Process AS, Oslo, Norway). Quantification of L-AA and glucose in mixture solution were done simultaneously by partial least squares (PLS) regression analysis using the broad region (20-450 cm -1).
F. Model evaluation
Performance of the calibration model and cross-validation was evaluated using the following statistical parameters; coefficient of determination between predicted and measured L-AA and glucose concentration (R2cal),
root mean square error of calibration (RMSEC), root mean square error of cross-validation (RMSECV) and the standard deviation ratio (SDR) of calibration (SDRcv) which can be calculated as follow [9]:
Low RMSECV and a high R2cal and SDRcv were desirable. SDRcv above 3.0 is considered to be acceptable for
practical spectroscopy applications [10].
To evaluate the prediction performance of the developed calibration model, the following parameters were used: the coefficient of determination in prediction (R2pred), the root mean square error of prediction (RMSEP),
bias between the actual and predicted value, the bias-corrected standard error of prediction (SEP) and the standard deviation ratio (SDR) of prediction (SDRpred). The RMSEP is an estimate of total prediction errors for an
independent data set. The sources of error in the RMSEP value are including bias and SEP which can be
considered to be sufficient. The SDRpred can be calculated as follow [9], [12], [13]:
A. Typical spectra of L-AA and glucose in mixture solution
Fig. 1 shows the two typical spectra of L-AA and glucose in mixture solution with different concentration. We can see that the in the spectral shape, the spectra of mixture solution of L-AA and glucose is similar with the spectra of water. Mixture2 with higher concentration of L-AA and glucose in total has lower absorbance comparing to Mixture1. This is because the amount of free water in Mixture2 is lower than that of Mixture1.
B. Developing calibration model for L-AA and glucose determination
Calibration model for L-AA and glucose were developed simultaneously by using PLS2 regression using original and some pre-processing method. Savitzky-Golay (SG) smoothing was found to be the best pre-processing method for L-AA and glucose determination (result of pre-processing evaluation was not shown here). The optimum number of PLS factors was determined by the full-cross-validation procedure by plotting the root mean square error of cross-validation (RMSECV) against the number of factors and searching for the minimum error (results not shown).
Fig. 2 and 3 show the scatter plot of actual and predicted L-AA for the best calibration and validation using SG smoothing spectra, respectively. The calibration model has 5 PLS factors with R2cal=0.963 and the root mean
square error of calibration (RMSEC) = 1.386558% (w/w). The validation of L-AA resulted in the root mean square error of cross-validation (RMSECV) = 1.660468% (w/w). It can be seen that the differences between the RMSEC and RMSECV of the developed model was small. It can be said that there is no potential for over fitting case of the L-AA determination using this model. Fig. 4 and 5 show the scatter plot of actual and predicted glucose for the best calibration and validation using SG smoothing spectra, respectively. The calibration model has 4 PLS factor (lower than L-AA model) with R2cal= 0.960 and RMSEC = 1.567653% (w/w). The validation of glucose resulted in RMSECV
222
model for glucose was small. It can be said that there is no potential for over fitting case of the glucose determination using this model.
Fig. 1. Typical spectra of mixture solution of L-AA and glucose in range 20-450 cm-1.
Fig. 2. Scatter plot between actual and predicted L-AA for calibration using PLS2 regression method
223 Fig. 4. Scatter plot between actual and predicted glucose for calibration using PLS2 regression method.
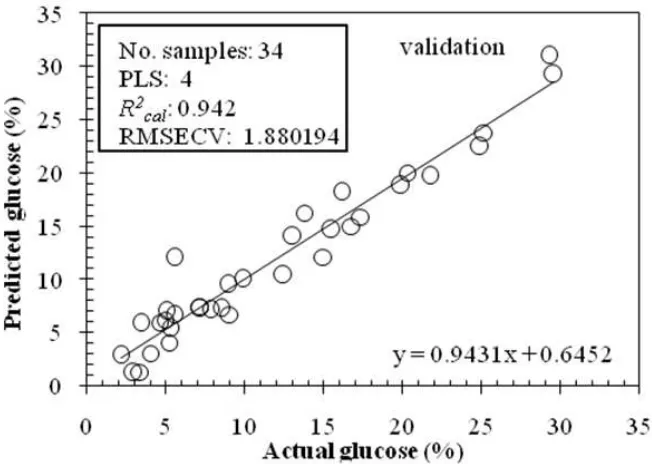
Fig. 5. Scatter plot between actual and predicted glucose for validation using PLS2 regression method
C. Prediction for L-AA and glucose in mixture solution
Using prediction sample set (n= 16), an evaluation on the performance of the developed calibration was investigated both for L-AA and glucose determination. Prediction for L-AA resulted in RMSEP= 2.473348% (w/w). With this RMSEP, SDRpred of 2.880 could be obtained. Bias prediction was very close to 0.
As seen in Fig. 6, the regression between values found by the two-equation ATR-THz method (Y) and those obtained by the reference procedure (X) for L-AA provided a regression equation of Y = 0.8075X + 2.6711 (n = 16) which means that the developed ATR-THz method is not so accurate, it still requires a blank correction (the intercept is not almost zero) and presents constant relative errors (the slope is not very close to 1). However, the ATR-THz method shows possibility on L-AA determination in mixture solution and opens a practical application of using ATR-THz method for L-AA determination in more complex solution such as in juice samples.
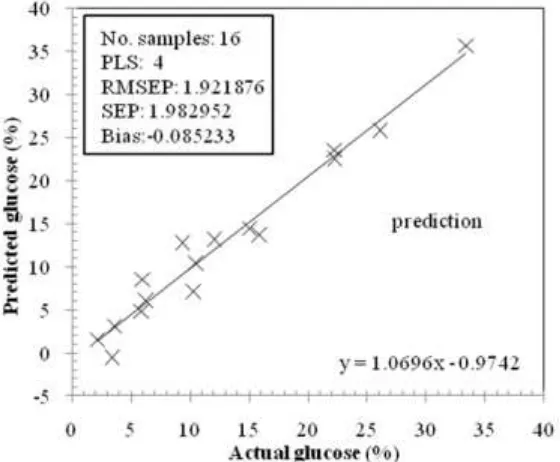
For glucose, prediction resulted in RMSEP= 1.921876% (w/w). With this RMSEP, SDRpred of 4.730 could be obtained. This SDRpred is higher comparing to SDRpred for L-AA. Bias prediction was also close to 0.
224
Fig. 6. Scatter plot between actual and predicted L-AA for prediction using PLS2 regression method.
Fig. 7. Scatter plot between actual and predicted glucose for prediction using PLS2 regression method
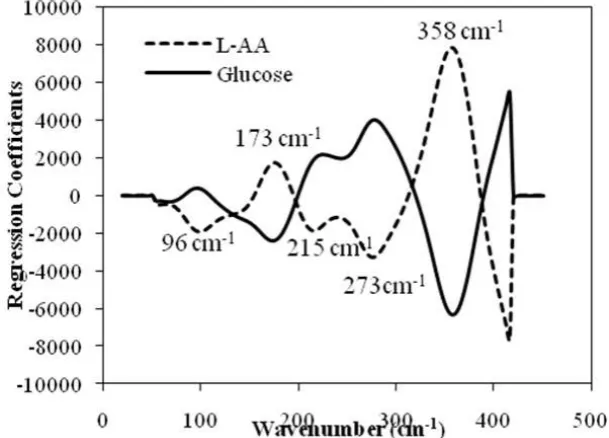
D. Evaluation of structure of calibration model
In order to evaluate the structure of the calibration model for L-AA and glucose determination, a plot between regression coefficient and wavelength was constructed. As seen in Fig. 8, for L-AA determination there are several observed peaks. They are at 96 cm-1, 173 cm-1, 215 cm-1, 273 cm-1, and 358 cm-1. These peaks may directly
correspond with L-AA determination at mixture solution. It can be seen that the contribution of high frequency is higher comparing to that of lower frequency. It seems that L-AA determination of mixture solution was mainly determined by intramolecular vibration mode at higher frequency. For glucose the peaks of regression coefficient were much similar to the L-AA with different in magnitude sign. For example, the peak of L-AA at 358 cm-1 has a
magnitude of regression coefficient 7823 while for glucose at the peak of 358 cm-1 the value of regression
225 Fig. 8. Scatter plot between wavenumber and regression coefficient for L-AA and glucose determination using
PLS2 regression method
IV. CONCLUSION
To summarize, we have measured simultaneously the L-AA and glucose spectral data in broad range of THz region in mixture L-AA and glucose solution. The validation of L-AA resulted in the root mean square error of cross-validation (RMSECV) = 1.660468% (w/w). The validation of glucose resulted in RMSECV = 1.880194% (w/w). The developed calibration model has high SDRcv for both with SDRcv= 4.421 and SDRcv= 4.218 for L-AA and
glucose, respectively. Prediction for L-AA resulted in RMSEP= 2.473348% (w/w). With this RMSEP, SDRpred of
2.880 could be obtained. Bias prediction was very close to 0. This result showed a potential use of THz spectroscopy for L-AA determination in mixture solution.
ACKNOWLEDGEMENT
We would like to thank Professor Naoshi Kondo and Associate Professor Yuichi Ogawa for permits to use THz spectrometer and its supporting devices.
REFERENCES
[1] H.S. Burdurlu, N. Koca., and F. Karadeniz, “Degradation of vitamin C in citrus juice concentration during storage,” J. Food Eng., vol. 74, pp. 211–216, 2006.
[2] M. Ros-Chumillas, Y. Belissario, A. Iguaz, and A. López, “Quality and shelf life of orange juice aseptically packaged in PET
bottles,” J. Food Eng., vol. 79, pp. 234–242, 2007.
[3] S. Arya, P. M. Mahajan, and P. Jain, “Photometric methods for the determination of Vitamin C,”Anal. Sci., vol. 14, pp. 889‒
895, 1998.
[4] S. Arya, P. M. Mahajan, and P. Jain, “Non-spectrophotometric methods for the determination of Vitamin C,” Anal. Chim. Acta, vol. 417, pp. 1‒14, 2000.
[5] M. Blanco, J. Coello, H. Iturriaga, S. Maspoch, and C. Pezuela, “Determination of ascorbic-acid in pharmaceutical preparations by near-infrared reflectance spectroscopy,” Talanta, vol. 40, pp. 1671‒1676, 1993.
[6] H. Yang, and J. Irudayaraj, “Rapid determination of vitamin C by NIR, MIR and FT Raman techniques,” J. Pharm. Pharmacol.,
vol. 54, pp. 1247‒1255, 2002.
[7] D. Suhandy, M. Yulia, Y. Ogawa, and N. Kondo, “L-ascorbic acid prediction in aqueous solution based on FTIR-ATR
terahertz spectroscopy,” Engineering in Agriculture, Environment, and Food, vol. 5, pp.152–158, 2012.
[8] D. Suhandy, M. Yulia, Y. Ogawa, and N. Kondo, “Prediction of L-ascorbic acid using FTIR-ATR terahertz spectroscopy
combined with interval partial least squares (iPLS) regression,” Engineering in Agriculture, Environment, and Food, vol. 6, pp.111–117, 2013.
[9] M. Golic, and K. B. Walsh, “Robustness of calibration models based on near infrared spectroscopy for the in-line grading
of stone fruit for total soluble solids content,” Anal. Chim. Acta, vol. 555, pp.286–291, 2006.
[10] A. Clement, M. Dorais, and M. Vernon, “Nondestructive measurement of fresh tomato lycopene content and other physicochemical characteristics using Visible-NIR spectroscopy,” J. Agric. Food Chem., vol. 56, pp.9813–9818, 2008. [11] L.K. Sørensen, and S. Dalsgaard, “Determination of clay and other soil properties by near infrared spectroscopy,” Soil. Sci.
226
[12] M. Valente, R. Leardi, G. Self, G. Luciano, and J. P. Pain, “Multivariate calibration of mango firmness using vis/NIR
spectroscopy and acoustic impulse method,” J. Food Eng., vol. 94, pp.7–13, 2009.