Continuous stroke volume monitoring by
modelling flow from non-invasive
measurement of arterial pressure
in humans under orthostatic stress
Mark P. M. HARMS
*
, Karel H. WESSELING†, Frank POTT‡, Morten JENSTRUP‡,
Jeroen
VANGOUDOEVER†, Niels H. SECHER‡, and Johannes J.
VANLIESHOUT
*
*
Department of Internal Medicine, Academic Medical Center, Cardiovascular Research Institute, Amsterdam, The Netherlands,
†Netherlands Organization for Applied Scientific Research, TNO Biomedical Instrumentation, Amsterdam, The Netherlands, and
‡Department of Anesthesia, Rigshospitalet, The Copenhagen Muscle Research Center, Copenhagen, Denmark
A
B
S
T
R
A
C
T
The relationship between aortic flow and pressure is described by a three-element model of the arterial input impedance, including continuous correction for variations in the diameter and the compliance of the aorta (Modelflow). We computed the aortic flow from arterial pressure by this model, and evaluated whether, under orthostatic stress, flow may be derived from both an invasive and a non-invasive determination of arterial pressure. In 10 young adults, Modelflow stroke volume (MFSV) was computed from both intra-brachial arterial pressure (IAP) and non-invasive finger pressure (FINAP) measurements. For comparison, a computer-controlled series of four thermodilution estimates (thermodilution-determined stroke volume ; TDSV) were averaged for the following positions : supine, standing, head-down tilt at 20°(HDT20) and head-up tilt at 30°and 70°(HUT30 and HUT70 respectively). Data from one subject were discarded due to malfunctioning thermodilution injections. A total of 155 recordings from 160 series were available for comparison. The supine TDSV of 113³13 ml (mean³S.D.) dropped by 40%to 68³14 ml during standing, by 24%to 86³12 ml during HUT30, and by 51%to 55³15 ml during HUT70. During HDT20, TDSV was 114³13 ml. MFSV for IAP underestimated TDSV during HDT20 (®6³6 ml ; P!0.05), but that for FINAP did not (®4³7 ml ; not significant). For HUT70 and standing, MFSV for IAP overestimated TDSV by 11³10 ml (HUT70 ;P!0.01) and 12³9 ml (standing ;P!0.01). However, the offset of MFSV for FINAP was not significant for either HUT70 (3³8 ml) or standing (3³9 ml). In conclusion, due to orthostasis, changes in the aortic transmural pressure may lead to an offset in MFSV from IAP. However, Modelflow correctly calculated aortic flow from non-invasively determined finger pressure during orthostasis.
INTRODUCTION
In order to evaluate the mechanisms leading to syncope, a continuous recording of blood pressure and ideally also
Key words :cardiovascular, fingers, posture, thermodilution, tilt-table test.
Abbreviations :FINAP, finger arterial pressure ; HDT20, head-down tilt at 20°; HUT30 and HUT70, head-up tilt at 30°and 70° respectively ; IAP, intra-brachial arterial pressure ; MFSV, Modelflow stroke volume ; TDSV, thermodilution-determined stroke volume.
Correspondence:Dr J. J. van Lieshout, Department of Internal Medicine, Room F4–264, Academic Medical Center, University of Amsterdam, P.O. Box 22700, 1100 DE Amsterdam, The Netherlands.
least intrusive technique available that adequately monitors changes in arterial pressure is the finger volume clamp method [5].
Application of pulse wave analysis to the measurement of finger arterial pressure (FINAP) offers a non-invasive and continuous recording of stroke volume. The analysis is based on models of the arterial system that assume that both the aortic dimension and the elastic properties remain constant [6,7], although these are known to change when the distending pressure of the aorta is changed [8]. A three-element model of the arterial input impedance (Modelflow) has been advanced that takes into account the non-linear aortic pressure–area relation-ship [9]. Modelflow computes a flow wave from the arterial pressure wave that is integrated to obtain the stroke volume of the heart.
Head-up tilt testing is used for the evaluation of patients with neurally mediated syncope [5,10]. A change in body position influences the effect of gravity on the cardiovascular system, thereby changing the sympathetic tone to the heart and blood vessels [11]. In response to the assumption of an upright position, either actively by standing up or passively by head-up tilt, sympathetic outflow increases [12], whereas in the head-down pos-ition sympathetic tone decreases [13]. Also, the upright position raises the hydrostatic pressure in the arteries below the hydrostatic indifference point, which is located approximately at the level of the left ventricle, and therefore reduces the pressure in arteries above that level [11,14]. Both head-up and head-down tilt may change the arterial input impedance by modulating sympathetic tone and transmural vascular pressures. The Modelflow com-putation of stroke volume is, however, based on a supine model of the arterial haemodynamic characteristics, and it is unclear whether, under conditions of orthostatic stress, stroke volume can be derived from the arterial pressure wave. Therefore we addressed whether the Modelflow approach, validated for supine intra-arterial pressure [15], is also applicable during orthostatic stress. The study, using awake healthy subjects under varying degrees of active or passive orthostatic stress, was designed to compare the thermodilution-determined stroke volume (TDSV) with the Modelflow stroke volume (MFSV) obtained from intra-brachial arterial pressure (IAP) and from non-invasively determined FINAP.
METHODS
Subjects
Ten healthy subjects (nine males) were studied ; each gave informed consent, and the study was approved by the Ethical Committee of Copenhagen. The mean age was 29 years (range 20–39 years), with a mean height of 183 cm (range 170–191 cm) and a mean weight of 74 kg (range
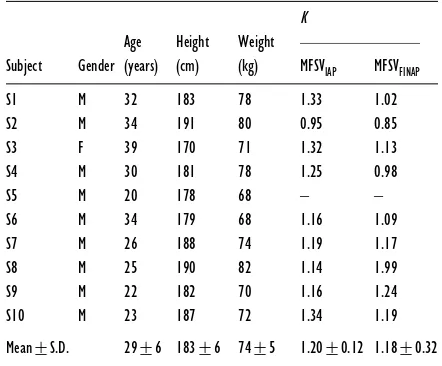
Table 1 Subject details and the calibration factor, K, for MFSVIAPand MFSVFINAP
In subject S8, the difference between meanK values for IAP and FINAP was related to cuff malpositioning on the finger.
K Age Height Weight
Subject Gender (years) (cm) (kg) MFSVIAP MFSVFINAP S1 M 32 183 78 1.33 1.02
68–82 kg) (Table 1). All subjects had normal physical fitness without sports training. They had no history of orthostatic fainting and used no medication.
Pressure measurements
Under local anaesthesia (2 % lidocaine), a catheter (20 G ; internal diam. 1.0 mm) was placed in the brachial artery (radial artery in subject S2) of the non-dominant arm, and a balloon-tipped thermodilution catheter (model 93A-831H-7.5F ; Baxter Healthcare Corp., Irvine, CA, U.S.A.) was introduced percutaneously through the left basilic vein under continuous ECG recording. Correct catheter positioning was confirmed by monitoring the pressure waveform. IAP, pulmonary artery pressure and right atrial pressure were measured using Baxter disposable transducers. To minimize hydrostatic errors during changes in body position, the transducers were fixed to the left upper arm at the level of the right atrium. Catheter lumens were flushed continuously.
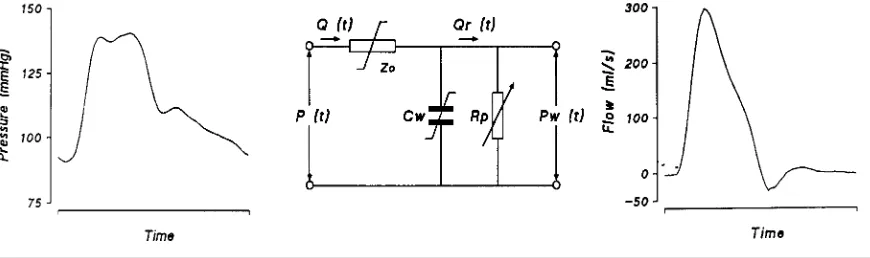
Figure 1 Diagram of modelling flow from measurements of arterial pressure
Left panel : non-invasive FINAP as input to the model for one heartbeat. Middle panel : three-element model of the aortic input impedance used to compute flow from pressure.Z0, characteristic impedance of the proximal aorta ;Cw, ‘ Windkessel ’ compliance of the arterial system ;R p, total systemic peripheral resistance. The Z0and Cwelements have non-linear, pressure-dependent properties indicated by the stylized!symbol. The peripheral resistance element,R p, varies with time, as symbolized by the arrow. P (t), arterial pressure waveform ; Q (t), blood flow as a function of time ; Pw (t) Windkessel pressure. Right panel : the computed output of the model, i.e. aortic flow as function of time.
Wesseling et al. [18]. In order to avoid hydrostatic level errors, the cuff was applied to the mid-phalanx of the third finger of the hand contra-lateral to the cannulated arm and held at level of the right atrium in the mid-axillary line. The positions of the finger cuff and pressure transducer were checked for possible hydrostatic level errors and occasionally re-adjusted. In the Finapres device, the Physiocal expert system was in operation to establish and maintain a correct volume-clamp set-point [18]. Mean arterial pressure (FINAP and IAP) was obtained as the integral of pressure over each beat divided by the corresponding beat interval.
Thermodilution
The thermodilution catheter was connected to a Baxter COM-2 cardiac output computer (Baxter-Edwards). A 10 ml sample of iced glucose solution (5 %) was drawn from a CO-SET cooling unit (Baxter) and injected by a pneumatic power injector (Broszeit Medizintechnik) overC3 s [19]. Following the passage of the thermo-dilution curve and after at least 18 s, the syringe was refilled automatically. Each thermodilution curve was checked visually for shape and appearance time before acceptance. One thermodilution cardiac output estimate was taken as the average obtained from four random injections. In all subjects (except S10), each series of four thermodilution injections was preceded by one manual injection in order to prime the syringe and the catheter with cold liquid.
Calculation of MFSV
Beat-to-beat stroke volume was estimated by the Modelflow method (Figure 1). The method uses a non-linear, three-element model of the aortic input impedance to compute an aortic flow waveform from the arterial
pressure wave. The flow waveform is integrated per beat to yield stroke volume (see Appendix).
Experimental protocol
After an overnight fast, the subjects were attached to instruments at 09.00 hours in a room with an ambient temperature of 22°C, and a test run was performed to familiarize the subject with the protocol. The protocol started with a period of supine rest, after which periods of standing and tilting at various angles were interspaced with further periods of supine rest to re-establish baseline levels (Figure 2). In each position, one or more series of four thermodilution cardiac output estimates were per-formed. All subjects were observed by the same phys-ician. The prolonged orthostatic stress was terminated by returning the subject to the horizontal position after either 60 min of head-up tilt or 10 min in the active standing position (or earlier at the subject’s request), or when blood pressure had decreased by "20 mmHg (systolic) or"5 mmHg (diastolic) [20]. Consequently, the full protocol could not always be completed.
Data acquisition and analysis
A PC-based system was used to control and mark the thermodilution injections, to start the COM-2, and to read its output via the serial port. An event marker was used to identify the onset of changes in posture. IAP, pulmonary arterial pressure, right atrial pressure, FINAP and marker signals were sampled at 100 Hz, stored on disk and also recorded on a polygraph (Graphtec) for on-line inspection. Signals to and from the computer were routed through an interface providing electrical isolation. Signals requiring offset and sensitivity adjustments went through additional variable offset and gain amplifiers.
Figure 2 Experimental protocol
Thermodilution estimates were taken 10 min after the start of each supine rest period, after 5 and 10 min of active standing, after 5 min of HDT5, HDT10, HDT20 and HUT30 positions, and every 10 min during sustained HUT70. A maximum of six cardiac output estimates were obtained during 1 h of HUT70. Arrows indicates the times of the thermodilution measurements.
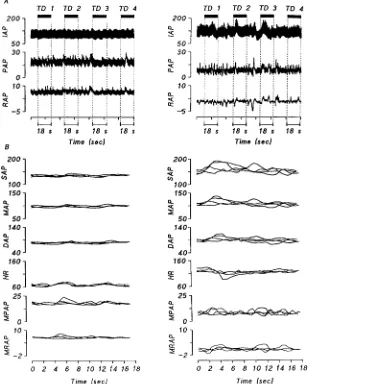
Figure 3 Stable (left panels) and unstable (right panels) haemodynamic states in a series of four thermodilution (TD) estimates
(A) Intra-arterial pressure (IAP), pulmonary artery pressure (PAP) and right atrial pressure (RAP). Rectangles indicate the duration of one TD series. (B) Detail of (A), showing the plotted signals of systolic (SAP), mean (MAP), diastolic (DAP) and mean pulmonary (MPAP) arterial pressures, mean right atrial pressure (MRAP), and heart rate (HR) during TD1–TD4. One TD measurement takes 18 s. Note the difference in the variability of the signals between a stable and an unstable haemodynamic state.
rate, systolic, mean and diastolic arterial pressures, and mean pulmonary arterial and mean right atrial pressures over the episodes of each individual thermodilution estimate (Figure 3). If any variable differed by more than 10 % from the mean of the series, the series was rejected
moment was assumed to be ‘random ’. This was tested for each subject by two-way analysis of variance.
Stroke volume was calculated from the IAP and the FINAP waves, giving two estimates of arterial-pressure-derived stroke volume : MFSV
IAPand MFSVFINAP. The average of a series of four thermodilution cardiac output estimates was divided by the heart rate over the cor-responding period to obtain the average TDSV. Thus three simultaneous estimates of stroke volume were available for analysis for each series. The supine average TDSV was used to calibrate the pressure-derived stroke volumes by multiplying the uncalibrated model stroke volume by the ratio (calibration factorK) of TDSV to either MFSV
IAPor MFSVFINAP.
The pooled data and stroke volumes during HUT70 (head-up tilt at 70°) were not normally distributed, and are expressed as means with ranges. The data obtained for the HDT20 (head-down tilt at 20°), HUT30 (head-up tilt at 30°) and standing positions were normally distributed, and are expressed as means³S.D. For the supine position, six or seven values were available ; in the standing position two to four values ; and in the HUT70 position one to seven values. One value was available for each of the HUT30 and HDT20 positions. TDSV was compared with MFSV
IAPand MFSVFINAPfor all body positions by linear regression. The distribution of changes with body position was examined by repeated-measures analysis of variance on ranks. Significant differences were identified by subsequent multiple-comparison testing (Student– Neuman–Keuls). Differences between MFSV
IAP and MFSV
FINAP, and deviations from TDSV, were evaluated with parametric or non-parametric tests. A Pvalue of
!0.05 was considered to indicate a statistically
sig-nificant difference.
RESULTS
In subject S5, thermodilution injections required as much as 10 s rather than the usual 3 s, and errors and alerts were
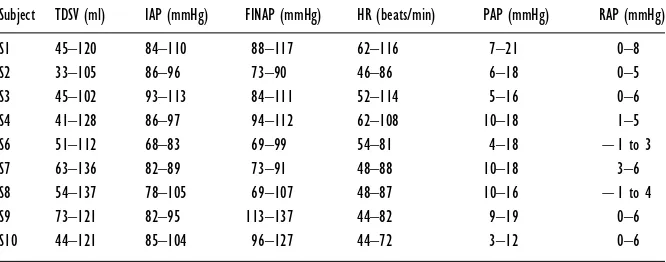
Table 2 TDSV, mean IAP, mean FINAP, heart rate (HR), mean pulmonary artery pressure (PAP) and mean right atrial pressure (RAP) in each subject
Values are ranges.
Subject TDSV (ml) IAP (mmHg) FINAP (mmHg) HR (beats/min) PAP (mmHg) RAP (mmHg)
S1 45–120 84–110 88–117 62–116 7–21 0–8
S2 33–105 86–96 73–90 46–86 6–18 0–5
S3 45–102 93–113 84–111 52–114 5–16 0–6
S4 41–128 86–97 94–112 62–108 10–18 1–5
S6 51–112 68–83 69–99 54–81 4–18 ®1 to 3
S7 63–136 82–89 73–91 48–88 10–18 3–6
S8 54–137 78–105 69–107 48–87 10–16 ®1 to 4
S9 73–121 82–95 113–137 44–82 9–19 0–6
S10 44–121 85–104 96–127 44–72 3–12 0–6
Table 3 Group-average values for correlation coefficient r and offset for MFSV from IAP and FINAP values
Data were obtained for the various body positions. ‘ All ’ gives pooled data from all manoeuvres. Significance of correlations : *P!0.01 ; **P!0.001.
Significance of offset from TDSV values : †P!0.05 ; ††P!0.01.
MFSVFINAP MFSVIAP
frequently noted. An analysis of variance showed sys-tematic differences in stroke volume within a series of four injections, but not between the manoeuvres, while in all other subjects the significant variation was between manoeuvres and not within the series of four injections ; therefore this subject was excluded from the analysis. In two subjects, active standing had to be terminated after 4 and 5 min respectively because they experienced pre-syncopal symptoms with a fall in blood pressure. In four subjects, HUT70 was terminated after 9, 9.5, 28 and 34 min respectively because of near-fainting ; three of the subjects had a fall in blood pressure, and one subject was tilted back on his own request.
A total of 160 TDSV series were therefore available from the nine remaining subjects. The 10 % criterium for haemodynamic stability was not fulfilled in two series (two subjects). Due to an unnoticed displacement of the finger cuff, three series in subject S8 in the HUT70 position were rejected. Thus 155 series (97 %) of MFSV
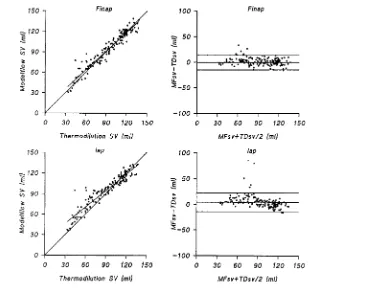
Figure 4 Pooled data for the two pressure sites
Left panels : regression of pooled data for TDSV against MFSV. Right panels : scatter diagrams of the differences between TDSV and MFSV against their means. Horizontal lines indicate mean³1.96 S.D.
Figure 5 Stroke volumes for different body positions Key : TD, TDSV ; MFfin, MFSVFINAP; MFiap, MFSVIAP.
hand because of discomfort in the cuffed finger, usually after 2 h of continuous monitoring. After repositioning of the cuff to another finger, the study was continued, usually within 5 min, when a reliable stable FINAP was confirmed by checking waveform and blood pressure level. Repositioning of the cuff did not affect the FINAP or calculated stroke volume. Differences between TDSV and MFSV
IAP or MFSVFINAP were not dependent on
blood pressure or heart rate.
Stroke volume
TDSV ranged from 33 to 137 ml (Table 2). The difference between TDSV and MFSV
FINAP[range ®16 to 33 ml ;
not significant] was smaller than that between TDSV and MFSV
IAP (range ®16 to 51 ml ; P!0.01) (Table 3 ;
Figure 4).
Supine position and head-down tilt
Table 4 Individual changes in FINAP and IAP during HUT70
In subject S8, the finger cuff was switched to another position during tilt-up ; bs, before switch ; as, after switch.
Subject
Tilt duration (min)
∆IAP (mmHg)
∆FINAP (mmHg)
∆(IAP–FINAP) (mmHg)
S1 30 14.7 20.4 ®5.7 S2 22 ®12.9 ®9.1 ®3.8 S3 50 8.8 16.3 ®7.5
S4 50 9.3 4.2 5.1
S6 8 1.7 10.2 ®8.5
S7 49 11.2 9.4 1.8
S8 bs 14 ®1.2 8.1 ®9.3 S8 as 23 1.9 9.0 ®7.1 S9 30 ®1.5 ®1.7 0.2 S10 8 ®13.2 ®5.4 ®7.8
Mean³S.D. 28.4³16.6 1.9³9.6 6.1³9.3 ®4.3³5.0
head-down tilt position [values of 113³12 ml (range 81–137 ml) and 114³13 ml (range 94–133 ml) respect-ively]. Both indices of MFSV tended to underestimate TDSV during HDT20, but the offset was significant only for MFSVIAP(®6³6 ml, compared with®4³7 ml for MFSVFINAP) (Table 3 ; Figure 5).
Head-up tilt and standing
On moving from the supine position to the HUT30 position, TDSV decreased by 24 %, to 86³12 ml (range 60–103 ml) (Figure 5). In the upright body position, MFSV overestimated TDSV. The difference compared with TDSV was similar for MFSV
FINAP (5³2 ml) and MFSV
IAP (6³3 ml ; not significant) (Table 3). In the HUT70 position, TDSV dropped by 51 % to 55 ml (range 33–83 ml) ; the offset of MFSV
FINAPfrom TDSV was not significant [3 ml (®6 to 33 ml)], unlike that of MFSV
IAPfrom TDSV [11 ml (®1 to 51 ml ;P!0.01)]. During head-up tilt, there was no systematic trend in the differences between FINAP and IAP (Table 4). On moving from the supine position to standing, TDSV decreased by 40 % to 68 ml (range 41–94 ml) (Figure 5). For MFSV
FINAPthe offset induced by standing (3³9 ml) was not significant, unlike that for MFSV
IAP(12³9 ml ;
P!0.01) (Table 3).
Tracking of stroke volume
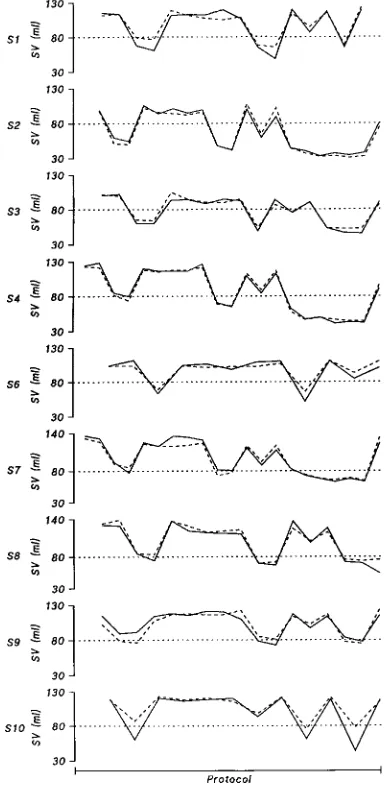
In all subjects except one, MFSV
FINAPtracked TDSV in all body positions, including HUT70 for 1 h (Figure 6). In subject S10, MFSV
FINAPdeviated from TDSV during orthostatic stress, giving an underestimate of the ortho-static fall in TDSV.
Figure 6 TDSV and MFSVFINAPvalues in the individual subjects
Solid line, TDSV ; broken line, MFSVFINAP. Changes in stroke volume are shown as elicited by active standing and by passive changes in body position between HDT20 and HUT70.
DISCUSSION
The present study investigated whether the decrease in cardiac stroke volume evoked by orthostatic stress can be derived from a non-invasive arterial pressure waveform using a model based on haemodynamic characteristics of the human aorta in the supine position. In young adults it was demonstrated that stroke volume as obtained by simulation of this model using a non-invasively de-termined arterial pressure reflects the TSDV, with a non-significant offset over the full range of stroke volume changes observed during postural changes.
Body position and MFSV
compared a beat-by-beat determination of stroke volume with a determination based on thermodilution, i.e. a discontinuous method integrating over several heart beats. The Modelflow method uses a three-element model of the aortic input impedance to compute flow from the pulsation of the arterial pressure [15]. The mechanical properties of the aorta dominate the impedance to outflow that is presented to the left ventricle in systole, which depends in turn on the difference between the intra-arterial pressure and the tissue pressure exerted on the outside of the aortic and arterial wall, i.e. the transmural pressure.
On moving from the supine to the upright position, the intra-arterial pressure below the level of the heart increases in proportion to the hydrostatic height, but it is not known to what extent this rise in pressure is counterbalanced by an increased tissue pressure, and the respiratory movement-related abdomino–thoracic pump may also be of importance. Therefore it is unclear whether the orthostatic increment in intravascular pressures is translated into an increase in transmural pressure in the descending thoracic and abdominal aorta [11,14,24,25].
Assumption of the upright position, either as a voluntary effort during standing or as a passive move-ment during head-up tilt, might increase the aortic transmural pressure below the level of the heart, and consequently reduce its compliance. A reduction in compliance of the aorta implies that, for a given pressure, the actual volume of blood stored in the aorta becomes less than the volume computed from the three-element model of aortic input impedance [15], which mimics the impedance of the aorta in the supine position. This view is supported by the finding that, in comparison with the TDSV estimate, the computed MFSV was greater in the upright body position and smaller in the head-down position, but only when the MFSV was based on an intra-arterial reading of blood pressure.
The cardiovascular stress is intensified during main-tained head-up tilt, with amplification of reflex vaso-constriction [26]. Maintaining the HUT70 position for 1 h, however, did not influence the offset of the MFSV, and we take this to imply that the estimate of peripheral vascular resistance included in the model [15] is simulated appropriately.
Accuracy of thermodilution method
We attributed the differences between MFSV [15] and TDSV estimates entirely to the model. The thermo-dilution method is based on the law of conservation of energy, i.e. that the temperature at the site of injection is the same as that at the site of detection, that mixing of the indicator and blood is complete, that the induced temperature change can be discriminated accurately from the fluctuations in baseline temperature, and that blood flow remains constant while the measurement is made
[22]. In the present study, the temperature of the indicator was measured at the entrance of the catheter lumen and corrected for. Iced injection fluid yields a greater signal-to-noise ratio of the thermodilution signal and a lower variance of consecutive measurements than an equivalent volume of injection fluid at room temperature [22]. The addition of heat to the syringe by direct hand contact [27] was avoided by using an automatic injector in com-bination with a closed delivery system that also reduced injection time and improved consistency in injected volume and linearity of injection rate [28]. The Stewart– Hamilton equation used to calculate the area under the thermodilution curve is valid for constant blood flow only [21,22]. Prolonged orthostatic stress elicits central hypovolaemia by continued pooling of fluid in the legs and splanchnic venous beds, and amplification of reflex vasoconstriction [29,30]. This introduces oscillations in the central and arterial pressures, as well as in cardiac output; these are amplified further by respiration (Figure 3), which inevitably increases the scatter of thermo-dilution estimates.
We restricted the influence of the respiratory oscillations on cardiac output in two ways. First, by distributing four injections randomly throughout the respiratory cycle, the accuracy of the series-average cardiac output improves with the square root of the number of observations [19]. Secondly, we excluded from the analysis the cardiac output series obtained under conditions when pressures and heart rate deviated by more than 10 % from their average values (Figure 3). Nevertheless, in awake subjects the prerequisite of constancy of blood flow during the period of the dilution curve may not be fully established during orthostasis, with an ongoing accumulation of blood in the legs and the occurrence of cardiovascular reflex responses to it.
Absolute values for stroke volume are preferred, and model calibration against a standard is recommended, for both non-invasive and invasive arterial pressure measure-ments. On the other hand, for purposes of orthostatic stress testing and in ambulant patients, a continuous measure of stroke volume is preferably non-invasive, and absolute values of stroke volume are less relevant [4,5].
Site of pressure measurement
have introduced a hydrostatic error in the measurement of arterial pressure. Since no systematic trend was found in the difference between FINAP and IAP (Table 4), we consider that the contribution of possible hydrostatic level errors in arterial pressure to the offset of MFSV to be small.
Changes in the aortic transmural pressure due to orthostasis may lead to an offset in stroke volume derived from IAP that is not accounted for by the model. During postural changes, an offset in MFSV as obtained from IAP, but not from FINAP, is remarkable. In the upright position, FINAP readings differ from those of IAP [31]. Apparently the hypothesized changes in arterial comp-liance due to orthostasis not accounted for by the model were compensated for by the level of arterial pressure measured in the finger.
ACKNOWLEDGMENTS
This study was supported by the Danish National Research Foundation (grant no. 504-14) and the Netherlands Heart Foundation (grant no. 94.132). We thank Heidi Hansen, Anne Katherine Secher and Annette Uhlmann for technical assistance.
REFERENCES
1 Friedman, D. B., Jensen, F. B., Matzen, S. and Secher, N. H. (1990) Non-invasive blood pressure monitoring during head-up tilt using the Penaz principle. Acta Anaesthesiol. Scand.34, 519–522
2 Petersen, M. E., Williams, T. R. and Sutton, R. (1995) A comparison of non-invasive continuous finger blood pressure measurement (Finapres) with intra-arterial pressure during prolonged head-up tilt. Eur. Heart J.16,
1641–1654
3 Jellema, W. T., Imholz, B. P. M., Van Goudoever, J., Wesseling, K. H. and Van Lieshout, J. J. (1996) Finger arterial versus intrabrachial pressure and continuous cardiac output during head-up tilt testing in healthy subjects. Clin. Sci.91, 193–200
4 Stevens, P. M. (1966) Cardiovascular dynamics during orthostasis and the influence of intravascular instrumentation. Am. J. Cardiol.17, 211–218
5 Benditt, D. G., Ferguson, D. W., Grubb, B. P. et al. (1996) Tilt table testing for assessing syncope. J. Am. Coll. Cardiol.28, 263–275
6 Broemser, P. and Ranke, O. F. (1930) Uber die Messung des Schlagvolumens des Herzens auf unblutigem Weg. Z. Biol. (Munich)90, 467–507
7 Gratz, I., Kraidin, J., Jacobi, A. G., deCastro, N. G., Spagna, P. and Larijani, G. E. (1992) Continuous non-invasive cardiac output as estimated from the pulse contour curve. J. Clin. Monit.8, 20–27
8 Wesseling, K. H., De Wit, B., Weber, J. A. P. and Smith, N. T. (1983) A simple device for the continuous
measurement of cardiac output. Adv. Cardiovasc. Phys. 5-II, 16–52
9 Langewouters, G. J., Wesseling, K. H. and Goedhard, W. J. A. (1984) The static elastic properties of 45 human thoracic and 20 abdominal aortasin vitroand the parameters of a
new model. J. Biomech.17, 425–535
10 Fitzpatrick, A. P., Theodorakis, G., Vardas, P. and Sutton, R. (1991) Methodology of head-up tilt testing in patients with unexplained syncope [see comments]. J. Am. Coll. Cardiol.17, 125–130
11 Rowell, L. B. (1993) Human Cardiovascular Control. Oxford University Press, New York
12 Ng, A. V., Johnson, D. G., Callister, R. and Seals, D. R. (1995) Muscle sympathetic nerve activity during postural change in healthy young and older adults. Clin. Auton. Res.5, 57–60
13 Nagaya, K., Wada, F., Nakamitsu, S., Sagawa, S. and Shiraki, K. (1995) Responses of the circulatory system and muscle sympathetic nerve activity to head-down tilt in humans. Am. J. Physiol.268, R1289–R1294
14 Blomqvist, C. G. and Stone, H. L. (1984) Cardiovascular adjustments to gravitational stress. Handb. Physiol. Sect. 2 Cardiovasc. Syst.3, 1025–1063
15 Wesseling, K. H., Jansen, J. R. C., Settels, J. J. and Schreuder, J. J. (1993) Computation of aortic flow from pressure in humans using a nonlinear, three-element model. J. Appl. Physiol.74, 2566–2573
16 Gardner, R. M. (1981) Direct blood pressure measurement-dynamic response requirements. Anaesthesiology54, 227–236
17 Pen4a!z, J. (1973) Photoelectric measurement of blood pressure, volume and flow in the finger. Digest of the International Conference on Medicine and Biological Engineering, Dresden, p. 104 (Abstract)
18 Wesseling, K. H., De Wit, B., Van der Hoeven, G. M. A., Van Goudoever, J. and Settels, J. J. (1995) Physiocal, calibrating finger vascular physiology for Finapres. Homeostasis36, 67–82
19 Jansen, J. R., Schreuder, J. J., Settels, J. J., Kloek, J. J. and Versprille, A. (1990) An adequate strategy for the thermodilution technique in patients during mechanical ventilation. Intensive Care Med.16, 422–425
20 The Consensus Committee of the American Autonomic Society and the American Academy of Neurology (1996) Consensus statement on the definition of orthostatic hypotension, pure autonomic failure, and multiple system atrophy. Neurology46, 1470
21 Hamilton, W. F. (1948) Comparison of the Fick and dye-injection methods of measuring the cardiac output in man. Am. J. Physiol.153, 309–321
22 Jansen, J. R. (1995) The thermodilution method for the clinical assessment of cardiac output. Intensive Care Med.
21, 691–697
23 Jansen, J. R. C., Schreuder, J. J., Settels, J. J. et al. (1996) Single injection thermodilution. A flow-corrected method. Anesthesiology85, 481–490
24 Gauer, O. H. and Thron, H. L. (1965) Postural changes in the circulation. Handb. Physiol. Sect. 2 Cardiovasc. Syst.3,
2409–2439
25 Rushmer, R. F. (1979) Effects of posture. In Cardiovascular Dynamics (Rushmer, R. F., ed.), pp. 192–219, W. B. Saunders, Philadelphia
26 Wieling, W. and Van Lieshout, J. J. (1997) Maintenance of postural normotension in humans. In Clinical Autonomic Disorders (Low, P. A., ed.), pp. 73–82, Little Brown and Co., Boston
27 Levett, J. M. and Replogle, R. L. (1979) Thermodilution cardiac output: a critical analysis and review of the literature. J. Surg. Res.27, 392–404
28 Nelson, L. D. and Houtchens, B. A. (1982) Automatic vs manual injections for thermodilution cardiac output determinations. Crit. Care Med.10, 190–192
29 Matzen, S., Perko, G., Groth, S., Friedman, D. B. and Secher, N. H. (1991) Blood volume distribution during head-up tilt induced central hypovolaemia in man. Clin. Physiol.11, 411–422
30 Ten Harkel, A. D. J., Van Lieshout, J. J., Karemaker, J. M. and Wieling, W. (1993) Differences in circulatory control in normal subjects who faint and who do not faint during orthostatic stress. Clin. Auton. Res.3, 117–124
APPENDIX
Calculation of stroke volume
The Modelflow method computes an aortic flow wave-form from a peripheral arterial pressure signal. It uses a non-linear three-element model of the aortic input impedance. The haemodynamic behaviour of the aorta in opposing ejection of blood from the left ventricle has been described by a three-element model of the arterial input impedance [1–3]. The three elements correspond to the characteristic impedance of the aorta (the opposition to the pulsatile flow from the left ventricle), the total arterial compliance (opposition to an increase in aortic blood volume), and a peripheral vascular resistance.
The first element in the model is the aortic charac-teristic impedance (Z
!) ; this describes the relationship between pulsatile flow and pressure at the entrance to the aorta. The rise in pressure will depend on the instan-taneous flow, on the cross-sectional area of the aorta and on the aortic compliance. HenceZ
!represents the aortic opposition to pulsatile inflow from the contracting left ventricle.Z
!has the dimension of pressure divided by flow. The second model element is the arterial compliance (C
w) ; this describes how much the aortic pressure rises for a given volume of blood, and represents the aortic opposition to an increase in blood volume. Compliance is defined as a change in volume (dV) divided by a change in pressure (dP). The third element in the model is per-ipheral vascular resistance (Rp).Rp is a measure of the ease of constant blood drainage from the Windkessel into the peripheral vascular beds.Rp is defined as the ratio of mean pressure to mean flow, and is not a major determinant of systolic inflow [4].
The first two elements of the model,Z
!andCw, are thus dependent on the elastic properties of the aorta. In earlier models of the arterial system, changes in aortic volume were assumed to be linearly related to the aortic pressure [1–3]. From Langewouters’ studies on the elastic properties of human thoracic and abdominal aortas, it was found that the aortic properties vary in a non-linear manner with distending pressure. The change in thoracic aortic cross-sectional areas was described as an arctangent function of transmural pressure [5]. The model uses this property and is non-linear, thus mimicking the haemo-dynamic behaviour of the aorta in detail (see Figure 1). It computes two of the model parameters, Z
! and Cw, making use of a built-in database of arctangent area– pressure relationships, given subject gender and age as input [5]. Instantaneous values ofC
wandZ!are used in the model simulation, resulting in the computation of an aortic flow waveform.Rp, the third element, is calculated for each beat by the model simulation and updated.
Thus the Modelflow method computes stroke volume from the arterial pressure wave, with continuous non-linear corrections for variations in aortic diameter, compliance and impedance during the arterial pulsation
[4]. Integrating the aortic flow waveform per beat provides left-ventricular stroke volume. Cardiac output is computed by multiplying stroke volume by heart rate. Only if absolute values for stroke volume are required does MFSV need calibration against a ‘golden’ standard, e.g. thermodilution. Otherwise stroke volume can be expressed as changes from control with the same pre-cision in stroke volume tracking.
Aortic pressure, theoretically preferred in the model, is not routinely available in clinical practice, and therefore a peripheral arterial pressure is used. Peripherally measured arterial pressure is, however, distorted in comparison with aortic pressure. Although the calculated flow waveform is therefore distorted also, the area under the flow wave, which equals the stroke volume, was shown to be affected only minimally by such distortion [4]. The effect is that peripheral arterial pressures, including non-invasive FINAP, appear sufficiently close to the aortic pressure to be applied in the model and still allow reliable estimations of stroke volume [4,6]. Correct tracking of IAP by non-invasive FINAP is a prerequisite for such a correct computation of model-simulated stroke volume, as demonstrated in healthy subjects [7–9] and in patients with co-existing hypertension and vascular disease [10]. The cross-sectional area of the aorta is increased in arteriosclerotic aortas, along with increased stiffness. The net effect of both increments is that they compensate for each other in their effects on compliance, such that the compliant behaviour of an arteriosclerotic aorta is almost identical with that of a non-sclerotic aorta over the physiological pressure range [11]. Studies in patients with cardiovascular disease demonstrated that Modelflow values from arterial pressure accurately track changes in cardiac output in both direction and degree when compared with thermodilution-based estimates [4,6,12].
REFERENCES
1 Broemser, P. and Ranke, O. F. (1930) Uber die Messung des Schlagvolumens des Herzens auf unblutigem Weg. Z. Biol. (Munich)90, 467–507
2 Toorop, G. P., Westerhof, N. and Elzinga, G. (1987) Beat-to-beat estimation of peripheral resistance and arterial compliance during pressure transients. Am. J. Physiol.252, H1275–H1283
3 Burkhoff, D., Alexander, J. J. and Schipke, J. (1988) Assessment of Windkessel as a model of aortic input impedance. Am. J. Physiol.255, H742–H753 4 Wesseling, K. H., Jansen, J. R. C., Settels, J. J. and
Schreuder, J. J. (1993) Computation of aortic flow from pressure in humans using a nonlinear, three-element model. J. Appl. Physiol.74, 2566–2573
5 Langewouters, G. J., Wesseling, K. H. and Goedhard, W. J. A. (1984) The static elastic properties of 45 human thoracic and 20 abdominal aortasin vitroand the parameters of a new model. J. Biomech.17, 425–535
comparison with bolus injection thermodilution. Anesthesiology90, 1317–1328
7 Friedman, D. B., Jensen, F. B., Matzen, S. and Secher, N. H. (1990) Non-invasive blood pressure monitoring during head-up tilt using the Penaz principle. Acta Anaesthesiol. Scand.34, 519–522
8 Petersen, M. E., Williams, T. R. and Sutton, R. (1995) A comparison of non-invasive continuous finger blood pressure measurement (Finapres) with intra-arterial pressure during prolonged head-up tilt. Eur. Heart J.16, 1641–1654
9 Jellema, W. T., Imholz, B. P. M., Van Goudoever, J., Wesseling, K. H. and Van Lieshout, J. J. (1996) Finger arterial versus intrabrachial pressure and continuous cardiac output during head-up tilt testing in healthy subjects. Clin. Sci.91, 193–200
Received 12 February 1999/15 April 1999; accepted 23 May 1999 10 Bos, W. J. W., Imholz, B. P. M., Van Goudoever, J.,
Wesseling, K. H. and Van Montfrans, G. A. (1992) The reliability of noninvasive continuous finger blood pressure measurement in patients with both hypertension and vascular disease. Am. J. Hypertens.5, 529–535 11 Langewouters, G. J., Wesseling, K. H. and Goedhard,
W. J. A. (1985) Age-related changes in viscoelasticity of normal and arteriosclerotic human aortas. In
Biomechanics : Current Interdisciplinary Research (Perren, S. M. and Schneider, E., eds.), pp. 245–250, Martinus Nijhoff Publishers, Dordrecht
12 Schreuder, J. J., van der Veen, F. H., van der Velde, E. T. et al. (1995) Beat-to-beat analysis of left ventricular