Cite this Article As Ratlalan, Roberth M., Tama, Ishardita P., Sugiono. (2018). Implementation of Lean Manufacturing to Minimize Waste in The Process of Plastic Box 260 Using VSM and AHP Method. Journal of Engineering and Management in Industrial System, 5(2), p67-76. Retrieved from
http://jemis.ub.ac.id/index.php/jemis/article/view/261
Paper Accepted : January, 30th 2018
Paper Published : March, 8th 2018
67
IMPLEMENTATION OF LEAN MANUFACTURING TO MINIMIZE
WASTE IN THE PROCESS OF PLASTIC BOX 260 USING
VSM AND AHP METHOD
Roberth M Ratlalan1), Ishardita Pambudi Tama2), Sugiono Sugiono3)
Mechanical Engineering, Faculty Of Engineering, University Of Brawijaya1,2)
Industrial Engineering, Faculty Of Engineering, University Of Brawijaya3)
Abstract one of the national manufacturing industry company engaged in the manufacture of military
products with the resulting product is plastic box 260. To minimize the waste that occurs lean manufacturing approach is assisted by one of the tools in the concept of lean value stream mapping (VSM) aims to describe the overall Information from the flow of raw materials to finished products. Waste identification begins with the waste relationship matrix (WRM) and waste assessment questionnaire (WAQ) to determine the percentage of waste with the 3rd largest rank. Further analysis is done by analytical hierarchy process (AHP) aims to know the criteria of weighting from waste that has the highest ranking. The recommendation of improvement based on the analysis of waste with the 3 largest (unccessary inventory, overproduction, motion) and takt time calculation is to apply 5S, to apply forecasting, to add a working facility in the form of cooling room, to do maintenance activities such as preventive maintenance, addition of tools and machine, Setting laser machine, and layout design of production floor layout.
Keywords : Lean Manufacturing, Value Stream Mapping , WRM, WAQ, Analytical Hierarchy Process.
1. Introduction
National weaponries industry and manufacturing companies with the ability to run every production process that is done effectively and efficiently [1]. The more efficient the production system of the company, the less the incidence of waste in the production activities that occurs. This object investigated in this study is the assembling process of plastic box 260.
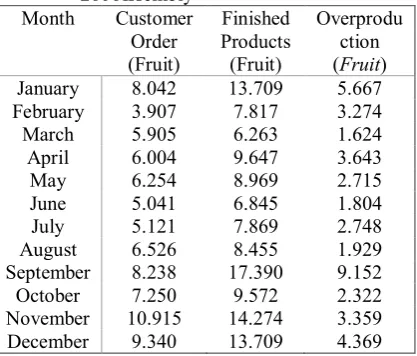
Based on the results of initial observations, it is known in the assembly process is still often found barriers or activities that can not provide added value that impacts the overproduction. Can be seen in table 1. Tabel 1. shows the largest overproduction in September, reaching 9,152 plastic box 260 which resulted in the loss of the company. Losses incurred due to excessive use of raw
* Corresponding author. Email : [email protected] Published online at http://Jemis.ub.ac.id
Copyright ©2017 JTI UB Publishing. All Rights Reserved
materials that resulted in storage costs that should not be required.
Table 1. Overproduction Data of Plastic Box 260 Assembly
Month Customer Order (Fruit)
Finished Products (Fruit)
Overprodu ction (Fruit) January 8.042 13.709 5.667 February 3.907 7.817 3.274 March 5.905 6.263 1.624 April 6.004 9.647 3.643 May 6.254 8.969 2.715 June 5.041 6.845 1.804 July 5.121 7.869 2.748 August 6.526 8.455 1.929 September 8.238 17.390 9.152 October 7.250 9.572 2.322 November 10.915 14.274 3.359 December 9.340 13.709 4.369
Cite this Article As Ratlalan, Roberth M., Tama, Ishardita P., Sugiono. (2018). Implementation of Lean Manufacturing to Minimize Waste in The Process of Plastic Box 260 Using VSM and AHP Method. Journal of Engineering and Management in Industrial System, 5(2), p67-76. Retrieved from questionnaire that includes many aspects and its abilities to achieve an accurate results in identifying each relationship and cause of inter-waste [2].
Lean manufacturing concept is an effort made by all elements of the company to jointly eliminate waste that occurred. One of the very useful and simple tool that is often used to map the whole process is Value Stream Mapping (VSM) which displays the entire flow of information, production processes, material flows, occurring from companies that are uniquely displayed in the current state map, in the behaves to understand and documenting all processes, by generating future state maps that support improvements in the production process [3].
This research also used the Analytical Hierarchy Process (AHP) model analysis which is a decision support model that describes multi factor problem or complex multi criteria into a hierarchy. Thomas L. Saaty that defined as a representation of a complex problem in a first level structure is the goal, level of factor, criterion, sub criteria, and the last level of the alternatives [4].
2.1 Research Methods
As defined from the method used, this research is included in the action research and has the broadening properties, because it uses the unification and development of several methods. From the design of the study, this research is expected to reduce waste that exist in the company.
2.1.Lean Manufacturing Concept
Lean Manufacturing concept is all activities that are done only in the form of activities that provide additional value that seen from the customer’s point of view. With the aim to improve the performance of the industry and manufactures system. There are eight types of waste that defined as the problem in the concept of lean Manufacturing with the aim of increasing the customer value through the continuous improvement of additional values [5].
2.2.Value Stream Mapping (VSM)
Value stream mapping is a methods which visually describes all activities that occur during the complete life cycle of a product or service. The most important part of VSM is to documents every relationship between the manufacturing and controls processes that used to manage production processes, such as scheduling and production information. VSM also describes the flow of information in the system, containing information that controls the material flow, the workflow of material started from a product to the final operation and continued to the storage location [6]. The steps to generate a VSM is as follows: Defining product, Create a current state map, Create a future state map, and Develop the implementation plan and implementation of the results achieved.
2.3. Analytical Hierarchy Process (AHP)
Analytical Hierarchy Process is a flexible model that has the ability to produce an optimal solutions that based from the each individual or group ideas and its limitation [4]. The steps of analytical hierarchy process (AHP) method is as follows: Define the problem and determine the desired solution, Create a hierarchical structure that begins with the main goal, Create a pairwise comparison matrix that describes the effect of each element on the objectives or criteria that are above it, In pairs so as to obtain an overall number of assessments of nx [(n-1) / 2] pieces, where n is the number of elements to be compared, Calculating the Geometric Average, Calculating the Normalization Matrix, Calculating the Eigen vector, and Performing the logical consistency testing (CI) .
3.
RESULT AND DISCUSSION
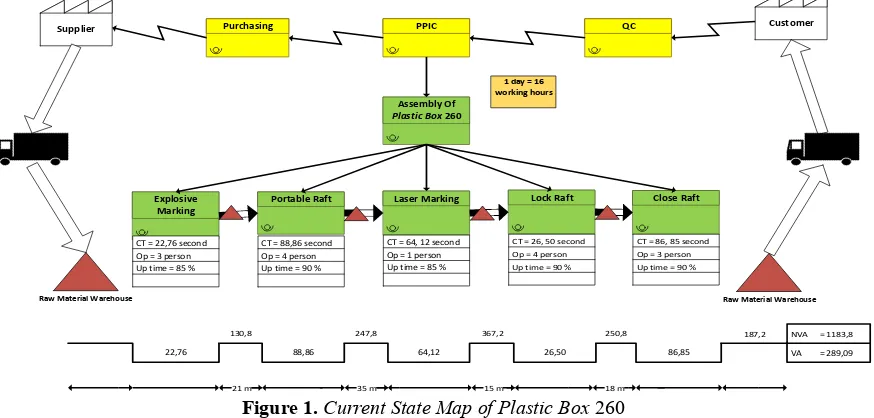
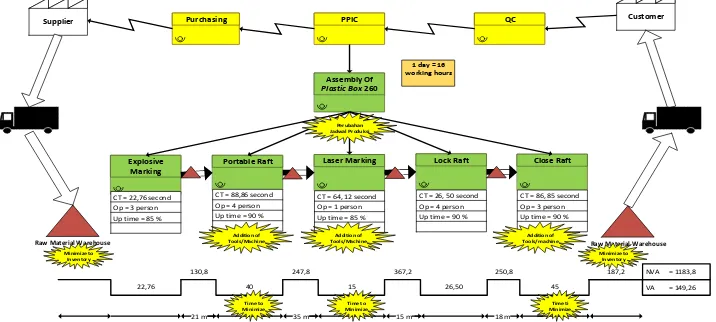
3.1 Current State Map Generating
Current state map is a description of the production process that takes place in a company which required as the first step to identify waste in a process flow of information and materials. Can be seen in figure 1.
Cite this Article As Ratlalan, Roberth M., Tama, Ishardita P., Sugiono. (2018). Implementation of Lean Manufacturing to Minimize Waste in The Process of Plastic Box 260 Using VSM and AHP Method. Journal of Engineering and Management in Industrial System, 5(2), p67-76. Retrieved from
http://jemis.ub.ac.id/index.php/jemis/article/view/261
Paper Accepted : January, 30th 2018
Paper Published : March, 8th 2018
69
is divided into 5 processes that have different assemblyng time. The non value added has an overall time of each process which is 1183.8 seconds and the value added has a time of
Portable Raft Laser Marking Lock Raft
CT = 22,76 second
Figure 1. Current State Map of Plastic Box 260
3.1.
Takt Time Calculation
Takt time is the standard time applied in order to create a specific product unit which shows how often a companies should do in producing a product to meet the average production based on customer demand. Can be seen in table 2.
Table 2. Comparison Takt Time and Standard Time
Process Takt process takt time is 41.14 seconds. This shows that in order to fulfill the average demand of 1400 pieces / day the time required based on the standard time calculation performed by operators in the field is equal to 22.76 seconds. Therefore the standard time of assembly process in the field had already meet customer’s demand in a timely manner.
Furthermore the standard operator time for the portable raft process is 88.86 seconds. This shows that the assembly process time can not meet customer demand based on standard time value. Here is some reasons which causes the assembly process time is above the takt time.
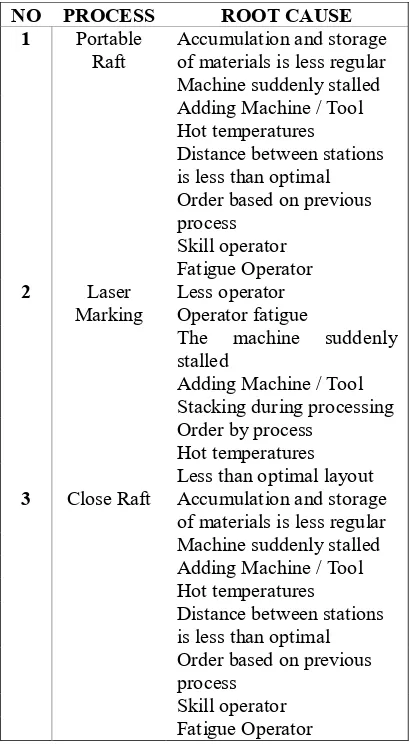
Table 3. is the main cause of the assembly process time above the takt time, which will be analyzed by using one of the useful tool namely fishbone diagram.
3.2.
Waste
Identification
and
Measurement
3.3.1 Waste Relationship Matrix(WRM)
Waste relationship matrix (WRM) has a functionality as a matrix to analyze the criteria of each measurement which consisted of rows showing the effect that occurs in a waste to each other of the six waste. While for each column has the functionality of describing the waste that is
Cite this Article As Ratlalan, Roberth M., Tama, Ishardita P., Sugiono. (2018). Implementation of Lean Manufacturing to Minimize Waste in The Process of Plastic Box 260 Using VSM and AHP Method. Journal of Engineering and Management in Industrial System, 5(2), p67-76. Retrieved from
http://jemis.ub.ac.id/index.php/jemis/article/view/261
Paper Accepted : January, 30th 2018
Paper Published : March, 8th 2018
70 Table 3. Root Cause Process Time Is above The
Takt Time
NO PROCESS ROOT CAUSE
1 Portable
Raft Accumulation and storage of materials is less regular Machine suddenly stalled Adding Machine / Tool Hot temperatures
Distance between stations is less than optimal Order based on previous process
Skill operator Fatigue Operator 2 Laser
Marking Less operatorOperator fatigue
The machine suddenly stalled 3 Close Raft Accumulation and storage
of materials is less regular Machine suddenly stalled Adding Machine / Tool Hot temperatures
Distance between stations is less than optimal Order based on previous process
Skill operator Fatigue Operator
In order to simplify each matrix, the results are converted into each number attached to each row with a reference to A = 10, E = 8, I = 6, O = 4, and U = 2, X = 0. With each reference that available, the waste matrix value can be seen in table 5.
Based on table 5, the highest percentage value was 20%, the overproduction and inventory has a value of 15%. So it is concluded that for these two wastes have a considerable influence to other waste. As for the value of inventory has a high percentage value of 22% which has a very high influence to the other waste.
Table 4. Waste Relationship Matrix Assembly of
3.3.2.
Waste Assesment Questionnaire
(WAQ)
Waste assessment questionnaire (WAQ) has a function to identify and allocate waste that occurs in the production line production process [2]. This assessment congregation consists of 68 questions marked into the type of waste "from". That states or shows toward any kind of waste that has a difference. While the form of type "to" shows every kind of waste that always appears. Each WAQ question has a weighted answer of 1, 0,5, and 0 is not. The results of WAQ recapitulation can be seen in figure 2.
The recapitulation of waste assessment questionnaire result shows that the waste which has the greatest value and occurs often is the inventory waste that has a percentage value of 26.13%, overproduction waste 22.85% and motion waste 12.30%.
3.4. Analysis of Criteria Weighting
Determination
Using the Analitycal
Hierarchy Process
(AHP) Model
AHP model used in this research was the lean manufacturing model in order to minimize the waste in plastic box 260 assembly process. For the third ranked waste, some factors were taken to consideration as it to be used as the criteria for further analysis using AHP model. Can be seen in figure 3.
Cite this Article As Ratlalan, Roberth M., Tama, Ishardita P., Sugiono. (2018). Implementation of Lean Manufacturing to Minimize Waste in The Process of Plastic Box 260 Using VSM and AHP Method. Journal of Engineering and Management in Industrial System, 5(2), p67-76. Retrieved from
http://jemis.ub.ac.id/index.php/jemis/article/view/261
Paper Accepted : January, 30th 2018
Paper Published : March, 8th 2018
71 Table 5. Waste Matrix Value
F/T O I D M T P W Skor %
O 10 8 4 4 4 0 6 36 20%
I 6 10 2 8 2 0 0 28 15%
D 2 4 10 2 2 0 4 24 13%
M 0 4 2 10 0 2 4 22 12%
T 2 4 2 2 10 0 6 26 14%
P 6 4 2 2 0 10 2 26 14%
W 4 6 2 0 0 0 10 22 12%
Skor 30 40 24 28 18 12 32 184 100%
% 16% 22% 13% 15% 10% 7% 17% 100%
Figure 2. Graph of recapitulation result WAQ
Figure 3. The Hierarchy Structure of Weight Determination Meminimize Waste
space efficiency, productivity effectiveness, and movement efficiency, sub criteria: I ERP, EP, EG, subcriteria II EP, EG, and subcriteria III EG, and alternatives: there is no alternative in this structure because the objective of AHP method is focused to find the priority in order to minimize the waste, so there was no alternative development is needed. For the determination of the waste minimization weighting, each criterion factor has a weighted value which will be calculated based on stages of AHP method, thus the result of weighting that will be made as a priority, can be seen in table 6.
Table 6. Weigh Criteria by AHP Method Criteria Weight
Inventory 0,408 X 100 % = 40,80 % Storage Space
Efficiency 0,369 X 100% = 36,94 % Productivity
Effectiveness 0,158 X 100% = 15,86 % Movement
Efficiency 0,063 X 100% = 6,39 % Amount = 100 %
Table 6 describes each weighting criteria which indicates that the inventory has a very high weighting influence of 40.80% and movement efficiency has a very low effect with a weight of 6.39%.
0,00% 10,00% 20,00% 30,00%
O I D M T P W
22,85%26,13%
11,28%12,30%11,30% 4,41%
11,72%
RECAPITULATION RESULTS WAQ
Cite this Article As Ratlalan, Roberth M., Tama, Ishardita P., Sugiono. (2018). Implementation of Lean Manufacturing to Minimize Waste in The Process of Plastic Box 260 Using VSM and AHP Method. Journal of Engineering and Management in Industrial System, 5(2), p67-76. Retrieved from
http://jemis.ub.ac.id/index.php/jemis/article/view/261
Paper Accepted : January, 30th 2018
Paper Published : March, 8th 2018
72
3.5.
Cause of Waste Analysis
Analysis of the causes of waste is limited in only some of the waste that will be analyzed and
could provide recommendations for
improvement. Here is the main cause of waste. Can be seen in table 7.
Table 7. explains the waste with the 3 largest rankings, so that the analysis of the cause of the waste can be used with the fishbone diagram that has a function to help and analyze the main causes of waste.
3.6.
Repairmen Recommendation
Identification is done by analyzing the waste, is to provide repair recommendations that have important functions that will be expected to reduce or eliminate waste that occurred in the process of assembling plastic box 260 in PT. X as follows:
3.6.1.
Apply 5S
The proposed repairmen recommendations to PT. X is to applies the 5S which is made as a benchmark by companies with the aim to evaluate the undertaken activities to run well and experience improvement.
Table 7. Cause of Waste Analysis
NO WASTE ROOT CAUSE
1 Unccesarr y Inventory
Not properly organized or arranged
Piling up reserve deposits Lack of arrangement in storage section well.
2 Overprod
uction Storage space is not properly organized or arranged
Piling up reserve deposits Lack of arrangement well Excessive production increases the risk of items to be stored
3 Motion Production results are difficult to achieve Piling up reserve deposits Movement that does not produce production Compile, and tidy up the products that should be done.
For more details about the 5S method will
be implemented as follows:
1. Seiri
Selection activities are the activities that consists of materials or equipment sorting at works by storing only equipment or materials to be used. Unused material is stored properly and placed in a separate place / has been provided specifically so it does not meet the work area.
2. Seiton
Structuring activities described as the arrangement of materials and equipment in the work area that should be arranged systematically which could makes it easier when it will be used thus the work is more efficient so that all materials and equipment are always in its place.
3. Seiso
Cleaning activities such as garbage, dirt and dust dumping. The purpose of cleaning is to remove all dirt and keep the workplace / environment clean and always clean. In expediting this program should be made a special schedule of cleaning for all areas of production on a regular basis, the minimum duration of time used once a month and for cleaning every worker should clean his work area after the hours worked.
4. Seiketsu
Standardization activities used to follow the standards and rules that have been applied consistently. In this case the company should make the standard or procedure in every work area which well defined to all workers in order to a better understanding of the standard procedure.
5. Shitsuke
Habituation activities are the activities that have the function of doing the work that has become the responsibility in accordance with each standard that has been applied so that the occupied occupation can be done correctly.
3.6.2.
Forecasting Implementation
The Proposed repairmen
Cite this Article As Ratlalan, Roberth M., Tama, Ishardita P., Sugiono. (2018). Implementation of Lean Manufacturing to Minimize Waste in The Process of Plastic Box 260 Using VSM and AHP Method. Journal of Engineering and Management in Industrial System, 5(2), p67-76. Retrieved from
http://jemis.ub.ac.id/index.php/jemis/article/view/261
Paper Accepted : January, 30th 2018
Paper Published : March, 8th 2018
73
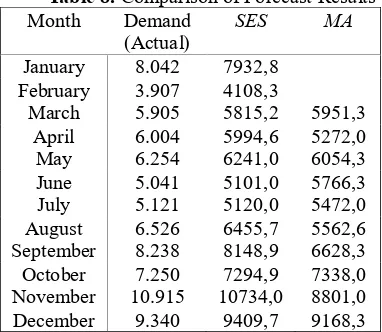
calculation model using moving average and single exponential smoothing method based on the estimated demand for the assembly of plastic box 260 can be seen in table 8.
Table 8. Comparison of Forecast Results Month Demand
(Actual) SES MA January 8.042 7932,8
February 3.907 4108,3
March 5.905 5815,2 5951,3 April 6.004 5994,6 5272,0 May 6.254 6241,0 6054,3 June 5.041 5101,0 5766,3 July 5.121 5120,0 5472,0 August 6.526 6455,7 5562,6 September 8.238 8148,9 6628,3 October 7.250 7294,9 7338,0 November 10.915 10734,0 8801,0 December 9.340 9409,7 9168,3
The forecast result from the single exponential smoothing method has the alpha value of 0.95 which has the smallest MAPE / MAD value before the error making [5]. If the data was higher than the estimation, then the value of α for this method can be said close to 1. While in the moving average method the value α = 2 was used. The comparison graph of forecast results and the actual value can be seen in Figure 4.
Figure 4. Comparison Graph of Forecast Results and the Actual Value
Figure 4 describes the results of forecast comparisons using the Moving Average method which has the MAPE and MAD values of 16 and 1240 respectively. While for single exponential smoothing method has the MAPE and MAD
values of 25 and 1565 respectively.
3.6.3.
Addition of Working Facilities
Recommendation of improvement for
the process which above the takt time is the addition of working facilities in the form of air conditioner. Based on the analysis that have been carried out, the hot air temperature is one of the factors which causing all of the assembly process time above the takt time. Can be seen in figure 5.
a.
b.
Figure 5. Addition of Working Facilities (a.Fan and b. Air Conditioner)
Figure 5 is the addition of a working
facility in the form of a fan and air conditioner that has the function of assisting the operator in doing the job and as cooling the machine (marking / laser screening).
3.6.4.
Addition Of Tools / Machine
Based on the recommendation of improvement for the above process takt time is the lack of tools / machinery so that the action needs to be done is the addition of tools / machines. Can be seen in table 9.
Table 9. describes the ratio of the number of tools / machines available and required. So for each assembly process occurs the addition of tools / machines as much as 1 piece.
D
e
ma
nd
(
U
ni
ts
)
Time (Month)
C o m p a r i s o n O f F o r e c a s t R e s u l t s A n d T h e A c t u a l
V a l u e s
Cite this Article As Ratlalan, Roberth M., Tama, Ishardita P., Sugiono. (2018). Implementation of Lean Manufacturing to Minimize Waste in The Process of Plastic Box 260 Using VSM and AHP Method. Journal of Engineering and Management in Industrial System, 5(2), p67-76. Retrieved from
http://jemis.ub.ac.id/index.php/jemis/article/view/261
Paper Accepted : January, 30th 2018
Paper Published : March, 8th 2018
74 Table 9. Comparison Number Of Machines Available
And Required Assembly Process
(Tools / Machine) Available (Fruit)
Needed (Fruit)
Portable Raft (Np Tools
Air Riviter) 2 1
Laser Marking (Chiao
Fang Hang Co. Ltd) 1 1 Close Raft (General Gt) 1 1
3.6.5.
The Proper Maintenance Activities
The recommendation for a process that is above takt time is to implement a scheduled preventive maintenance activity with a number of maintenance tasks such as inspection, repair,
replacement, cleaning, lubrication and
adjustments made. Can be seen in table 10. Table 10. It is the proposed of maintenance activity schedule design which used to assist the operator when performing maintenance activities by investigating at the condition of the tool / machine.
3.6.6.
Creating a Machine Setup
Checklist
The recommended improvement for the process that above the takt time is to make a checklist of laser machine settings design. Can be seen in table 11.
Table 11. is a proposed procedure / activity that has the advantages which can help and reduce operator errors caused by forgetting the process of setting the laser machine.
3.6.7.
Floor Production Layout Design
The recommended improvement for a process that is above takt time is the proposed design of the necessary floor layout improvement as a step prior to a better planning and layout arrangement. Can be seen in figure 6.
Figure 6. describes the selection and placement of an alternative layout based from the facility planning process selected from the ongoing production activities. With the consideration of the specifications, the number and area of the production facility.
3.7. Future State MapMaking
3.7.1. Time Change Process Estimating
Estimated time change after the repairmen can be done by calculating or assuming time after repair with 90% improvement time from takt time. Can be seen in table 12.
Table 12. Comparison of Assembly Time Process Before And After Repair
Assembly Process Takt Time
(Second) Standard Time (Second) Explosive Marking 41,14 22,76 analyzing, and recommending improvements made previously. The next step is to describe the future state map assembly process that can be seen in figure 7.
Based on the picture 7 there has been a change, such as the minimization of time in the three processes, the minimization of the amount of inventory that occurred in the assembly process at warehouse, and the addition of tools / machines. Decrease in time that leads to decreased lead time before improvement with a value of 1472.89 seconds and lead time after 1333.06 seconds improvement. Then the results for the entire assembly process decreased by 139.83 seconds.
4.
Conclussion
The conclusion that can be obtained in this research at PT. X is as follows:
1. The result of identification using the waste
Cite this Article As Ratlalan, Roberth M., Tama, Ishardita P., Sugiono. (2018). Implementation of Lean Manufacturing to Minimize Waste in The Process of Plastic Box 260 Using VSM and AHP Method. Journal of Engineering and Management in Industrial System, 5(2), p67-76. Retrieved from
http://jemis.ub.ac.id/index.php/jemis/article/view/261
Paper Accepted : January, 30th 2018
Paper Published : March, 8th 2018
75 2. The result of recapitulation of the waste
assessment questionnaire, the waste that has the greatest value and happened frequently was the inventory waste which has the value of percentage of 26.13%, overproduction waste 22.85% and motion waste 12.30%.
3. The result of weighting criteria calculation
using AHP method show that inventory had a very high influence with the weight value of 40,80% and the movement efficiency have a very low effect with the weight value of 6,39%.
Table 10. MaintenanceSchedule Design
Table 11. Design a Machine Setup Checklist
CHECKLIST SETTING MESIN LASER Date :
Operator :
No Activity performed Status Information
1 The input box to be printed on the conveyor already exists 2 Set the box on the conveyor used
3 Set the laser ink to be used.
4 Set the print speed and thickness of the laser machine mold 5 Conduct a print test to see results.
6 Check whether the position of the box is in accordance with the thickness if not set back the laser print position in accordance with the desired. 7 Machine is ready for use
D B A
E
C WIP
WIP WIP
BB WIP
PJ
RG
PC BB
PJ A - B
B - C
C - D
D - E
Figure 6. Layout Proposed Improvement MAINTENANCE SCHEDULE Tool / Machine Name :
Date : Made by :
No Equipment / Machine
Identification PlanMaintenance DateRealization Checked Parts
Cite this Article As Ratlalan, Roberth M., Tama, Ishardita P., Sugiono. (2018). Implementation of Lean Manufacturing to Minimize Waste in The Process of Plastic Box 260 Using VSM and AHP Method. Journal of Engineering and Management in Industrial System, 5(2), p67-76. Retrieved from
Portable Raft Laser Marking Lock Raft
CT = 22,76 second
Figure 7. Future State Map of Plastic Box 260
4. Some recommendation of improvement
were given to minimize the waste in plastic box260 assembly process at PT. X such as: Applying the 5S method in order to minimizing the motion waste, forecasting Implementation aimed to reduce the unnecessary inventory waste and the overproduction waste, addition of work facility which is specified in the form of air conditioner, addition of tool / machine for portable raft 1 (NP Tools of Water Riviter), 1 laser marking (Chiao Fang Hang Co. Ltd) and 1 close raft (General GT), the proper maintenance activities ie preventive maintenance of prevention activities should be conducted on a regular basis based on inspection time, Laser machine that has function to assist and reduce operator error, Design of production floor layout aimed to reduce the unnecessary inventory and the finished product waste.
References
[1] Hines P., Taylor D. Going Lean. Cardift UK:
Lean Enterprise Research Center Cardift Business School; 2000.
[2] Rawabdeh, Ibrahim A. A Model for The
Assesment of Waste In Job Shop Enviroment.
International Journal of Operation
Production Management. 2005;25(8).
[3] Womack, J. and Jones, D. The Machine That Change The World. New York : Rawson Associates; 1990.
[4] Saaty, Thomas L. Pengambilan keputusan bagi para pemimpin Analitik Untuk Pengambilan Keputusan Dalam Situas Kompleks. Seri manajemen No 134. Jakarta: PT. Pustaka Binaman Pressindo; 1993.
[5] Gaspersz, Vincent. Lean Six Sigma for
Manufacturing and Service Industries.
Jakarta : Gramedia; 2007