THE ADAPTATION TEST ON YARDLONG BEAN LINES TOLERANT
TO APHIDS AND HIGH YIELD
Kuswanto*) and Budi Waluyo Faculty of Agriculture University of Brawijaya Jl. Veteran Malang 65145 East Java Indonesia *)
Corresponding author Phone: +62-341-570471 E-mail: [email protected]
Received :November 19, 2010/ Accepted: January 12, 2011
ABSTRACT
The adaptation trial was applied to determine the benefits of genotype-environmental inter-action, adaptability and stability of lines. The previous research successfully obtained 8 UB lines which had high yield and tolerant to aphids. These lines belong to plant breeding laboratory of Brawijaya University, which had stability and a high potential can be immediately released to the public. Research was conducted in 2010, dry and rainy season, on 3 locations of yardlong bean, namely Malang, Kediri and Jombang. Randomized Block Design was applied in these locations.Genotype-environment interaction was analyzed with combined analysis of nested design.The adaptability and stability were known from regression analysis based on the stability of Eberhart and Russel. There were 6 stabile lines, namely UB7070P1, UB24089X1, UB606572, UB61318, UB7023J44, and UB715, respectively. They were recommended to be released as new varieties which had pest tolerance and high yield. The UBPU was suitable to be developed in marginal land. The 6 new varieties had registered to Agriculture Department Republic of Indonesia, namely, Brawijaya 1, Brawijaya 3, Brawijaya 4, Bagong 2, Bagong 3 dan Bagong Ungu, respectively.
Keywords: adaptation, yardlong bean, stability, tolerant aphid
INTRODUCTION
The productivity of fresh pod of yardlong bean (Vigna sesquipedalis L. Fruwirth) (Nenno, 2000) in Indonesia in 2005 is still quite low, ie 5.5 t/ha (Departemen Pertanian, 2008), while in Thailand it reaches 7.2 t/ha and 30 t/ha in Australia (Gallacher 1999). Meanwhile, the pod
yield potential of research is able to achieve an average of 17.4 t/ha (Kasno et al., 2000) until 23.74 t/ha (Redjeki, 2005). The yardlong bean production in 2006 was 461,239 t of fresh pod (Departemen Pertanian, 2008) from 84,798 ha. It was just 45% of total need of populations in Indonesia. It means yardlong bean production has not been able to meet the nutrition needed in the ideal population in Indonesia.
The main problem faced by farmers in the cultivation of yardlong bean was aphid. Aphid lives on the surface of the leaves and shoots or shoot-tip to suck plant fluids. Some leaves become crinkle and wrinkled, so shoot growth stopped and died. Aphid also often attacks flower and pod. The heavy symptom was that plant will produce leaves of peach colors, dwarf, malformation and less vigor. More aphids that attack the plant, more leaves and shoots will spiral, so it will lead to deterioration and it eventually dies. The loss of yield due to the aphid can reach 65.87% or more (Prabaningrum, 1996). Aphid was also the vectors of cowpea aphid borne mosaic virus (CABMV) that cause mosaic disease.
Pesticides would control the aphid, Aphis craccivora Koch, and can prevent the loss of production about 15.87% (Prabaningrum, 1996). However, this method was considered less healthy if associated with the impact on the environment, increased resistance of pathogen and consumer reluctance. Pest control was effective when using resistant or tolerant varieties. Planting resistant or tolerant varieties, yield loss and costs of pesticides can be minimized. It is also safe for the environment and can prevent pesticide residues in humans. Research of Fery and Singh (1997) showed that planting the resistant variety was the best method in control of virus disease on cowpea. According to Saleh et al.(1993), planting the
resistant varieties is considered the most efficient to prevent plant diseases caused by potyvirus.
The previous research examined the genetic parameters of aphid tolerance. Material research was the result of the crossing between MLG 15151 with HS and PS. It had established that heritability value of the aphid tolerance was lower, so the breeding program recommended the bulk method selection. The pair of PS/MLG15151 had a gene that controlled tolerance for aphid, namely single dominant gene, while another pair of HS/MLG15151 had the dominant gene and there were interactions between dominant x dominant genes (Kuswanto et al., 2007).
Bulk selection method was conducted on the next segregation population. There were tolerance genetic variability on F3, F4 and F5. Moreover, it obtained homozygote families in the next generation. In the selection of each population, it was obtained new lines which had more tolerant against aphid, while in F5, 120 expectation lines were obtained. The 60 lines were obtained from crossing HS/MLG15151 and 60 lines were obtained from the crossing PS/MLG15151 (Kuswanto et al., 2008).
The adaptation test needed to be done, so the lines could be evaluated. Yield evaluation was the final stage of plant breeding program. At this stage, the selection was carried out to get excellent homozygote lines that had been generated. Selection criteria were based on the characters which had economic purpose, such as the plant yield (Kasno, 1992). There was new information that these lines had diversity of genetic. The lines were successfully divided into 3 genetic groups based on multivariate analysis. From 120 lines, 12 expected UB lines which had tolerance to aphid and high yield potential were obtained.
Adaptation test needed to pay attention to the interaction between genotype and environ-ment in order to avoid loss of potential genotypes in the implementation of selection. The tests, based on guidelines from Agriculture Department (2006), are to learn the benefits of the genotype and environmental interactions conducted through adaptation test. For the sake of variety release, the unit number of adaptation test was the number of season times in the number of tested locations. The adaptation tests must be conducted at least in three units each grouped into two groups. The first group showed the ability of broad adaptation to environment in which the genotype-environment interaction was small. The second group depicted the ability on narrow or specific adaptation. Both groups had a perfect performance on suitable environment. It means, the lines had wide genotype-environment interaction (Soemartono and Nasrullah, 1988).
Adaptation ability can be measured with the regression coefficients and the average of production in all environments. Relationship between the mean (mi) with a value of regression coefficient (bi) determine the adaptability of lines. When the regression coefficients were close to 1 and had high yield, the lines had general adaptation. While the yield was low, the lines did not have any adaptability at all environment. The lines with broad adaptation can be shared on every unit of locations, but the lines had special adaptation to a specific location. If the regression coefficient was more than 1.0, the lines could adapt to specific environments, and when the regression co-efficient value was less than 1, the lines were appropriate for the marginal environment. Thus, if a location has suitable soil and climate to get high yield, the varieties with high regression coefficients would produce the highest yield, and this shows that these varieties had special adaptations to the suitable environment (Finlay and Wilkinson, 1963).
The research purposes to select the expected lines which can be superior varieties, tolerant to aphid and had the high yield.
MATERIALS AND METHODS
beans, namely Malang (330 m abl in altitude, evaluated variables were the percentage of infected plants, the number of aphid, the age of flowering, pod number, pod length, diameter, the number of seed weight per pod, pod weight per plant and 100 seed weight.
The combined analysis variance of nested design was applied to analyze all data. Regression analysis was based on the stability of Eberhart and Russel (Singh and Chaudary, 1979), namely, bi = Yij Ij / I². If the regression coefficient b was close to or equal to 1, it showed the average stability and lines had general adaptation. When the regression coefficients b was more than 1, it indicates that the stability was below the average and the lines had sensitivity to environmental changes and adapted to specific productive environment. When the regression coefficient b was less than 1, it indicates that the stability was above the average and the lines had specific adaptability in marginal environments.
RESULTS DAN DISCUSSION
Adaptation tests were conducted on 3 test sites in lowlands. These promising lines of yardlong bean will be recommended for release in lowlands. Based on guidance of release of varieties from the Department of Agriculture, varieties that will be released in lowlands should pass adaptation tests in lowlands. Moreover, varieties that will be released to the medium or highland should also pass adaptation tests in medium or high land. Evaluation of yardlong beans in the lowlands was according to the genetic characteristics which were more suitable for lowland planting. All activities had been completed, and the results of observations of each location unit were obtained.
A total of 8 promising UB lines were selected from previous research, namely, UB7070P1, UB24089X1, UB606572, UB61318, UB7023J44, UB920, UB715, and UBPU1 respectively, and also KP7 and Parade. KP7 and Parade were varieties that have a high yield. If there was a potential UB line which was not significantly different from or higher than
KP7, these lines could be immediately submitted to the release of varieties.
Differences Among Lines
Differences among lines were evaluated by analysis of variance. Data obtained from different evaluation site was analyzed separately in order to determine differences among lines that were implanted in different locations. The results of analysis show that the pod yield which is potential among the tested lines in Kediri, Jombang and Malang represents significant difference. There was different ability among UB lines, so it gave likelihood to study the interaction with environment. Furthermore, variance analysis of data from 3 locations and 2 seasons was combined. Statistically, data from each evaluation site was merged because it had to meet the assumption of homogeneity range of error.
Result of Combined Analysis
The observation data from each environ-ment was analyzed using the combined variance analysis based on the nested design. This analysis is aimed to determine the interaction between genotype with environment. The information of genotype-environment interaction was needed as a basis for executing analysis of adaptation and stability of tested promising lines. The result of the combined variance analysis is shown at Table 1. The analysis is executed because the analysis of homogeneity was obtained.
There was a significant interaction among the genotype, location and season on almost all of the observed characters. These results suggest that lines give a different appearance in different environments. The difference appear-ance indicates that lines grow in adaptive and stable way in certain environment. Information about adaptation and stability of lines is crucial in selecting the location of development and cultivation of such varieties. Analysis of stability and adaptability needs to be executed in order to know the level of stability and adaptation of each line. Stability analysis is carried out on a variable of potential yield per ha.
Stability and Adaptability
However, for evaluation of stability and adaptability, pods yield per ha are preferred. Finlay and Wilkinson (1963) used the relationship between mean value (mi) with regression coefficient (bi) as a measure of stability. Eberhart and Russell (1966) used the regression coefficient and sum of squares of regression deviation as a measure of stability. The different pod yield of lines with comparable varieties counts for variety release. The pod
yield was not different among lines, and higher than controlled varieties. In addition, UB lines had unique characteristic compared with KP7 and Parade; it was tolerant to aphid and mosaic. These lines could produce some pods although not sprayed with pesticides at all. Pods damage caused by pest aphids did not decrease pod yield significantly. Fresh pods of UB lines had also been tested to have the durability of longer storage.
Table 1. Mean square combined analysis of variance in 3 environments and 2 seasons.
Characters Pod length (cm)
Number of pod
Fresh weight of single pod
Fresh weight of total pot (g)
Yield (t/ha)
100 seed weight (g)
Season 298.7 2418.7 0.0 904048.0 2084.4 221.3
Location 179.6 708.0 59.9 163528.2 481.0 312.1
Season x location 53.5 1057.5 123.8 195963.5 240.2 228.0
Block/(season x location) 21.4 34.3 4.5 8101.0 6.4 1.3
Genotype 1583.6* 64.0 416.8* 135523.8* 149.4* 96.1*
Genotype x season 40.6 23.8 34.3* 15660.0 15.9 22.6
Genotype x location 75.0* 23.5 9.7 11748.1 14.2 28.7
Genotypexseasonxlocation 27.4* 20.8 11.8* 10808.5* 20.2* 23.3*
Error 7.0 12.3 5.3 5782.3 5.2 6.0
Total 101.9 51.8 30.4 22968.7 35.0 22.2
Remarks: * = significantly deferent
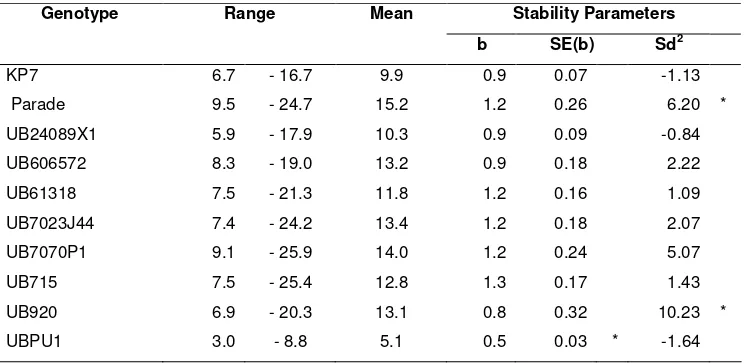
Table 2. The stability and adaptability of yardlong bean UB lines
Stability Parameters Genotype Range Mean
b SE(b) Sd2
KP7 6.7 - 16.7 9.9 0.9 0.07 -1.13
Parade 9.5 - 24.7 15.2 1.2 0.26 6.20 *
UB24089X1 5.9 - 17.9 10.3 0.9 0.09 -0.84
UB606572 8.3 - 19.0 13.2 0.9 0.18 2.22
UB61318 7.5 - 21.3 11.8 1.2 0.16 1.09
UB7023J44 7.4 - 24.2 13.4 1.2 0.18 2.07
UB7070P1 9.1 - 25.9 14.0 1.2 0.24 5.07
UB715 7.5 - 25.4 12.8 1.3 0.17 1.43
UB920 6.9 - 20.3 13.1 0.8 0.32 10.23 *
UBPU1 3.0 - 8.8 5.1 0.5 0.03 * -1.64
In this study, genotypes have similar results to a parade appearance, namely UB7070P1, so the potential one could be released as new variety. In addition, genotype UB24089X1, UB606572, UB61318, UB7023J44, UB920 and UB715 also have a higher pod yields than KP7 in all environments. Thus, these genotypes are potential for release as candidate of new varieties.
Actually, UBPU1 also has higher pod yields than KP7, but its regression coefficient is lower than 1 and a deviation value is similar to 0. Thus, genotype with purple pods is suitable to be developed in marginal environments. The genotype suitable to be developed on a culture system has minimum production facilities. Based on field observation, this genotype was the most tolerant to drought conditions. Some potential lines were registered to the center of plant variety protection. The registered varieties are Brawijaya 1, Brawijaya 3, Brawijaya 4, Bagong 2, Bagong 3 and Bagong Ungu, respectively.
CONCLUSIONS AND SUGGESTION
CONCLUSIONS
UB lines, UB7070P1, UB24089X1, UB606572, UB61318, UB7023J44, UB920, UB715 are potential and ready to be released as new varieties. UBPU1 is suitable to be developed in marginal environments. Six varieties registered comprise Brawijaya 1, Brawijaya 3, Brawijaya 4, Bagong 2, Bagong 3 and Bagong Ungu, respectively.
SUGGESTION
Varieties of Brawijaya 1, Brawijaya 3, Brawijaya 4, Bagong 2, Bagong 3 and Bagong Ungu, should immediately be proposed to grant a certificate for property right of varieties.
ACKNOWLEDGMENTS
A big thank to Directorate General of Higher Education which has provided the funding of research through Grants Competency 2010/2011.
REFERENCES
Departemen Pertanian. 2008. Basis Data Pertanian, Pusat Data dan Informasi Pertanian, Jakarta.
Eberhart, S.A. and W.A. Russel. 1966. Stability parameter for comparing varieties. Crop Sci. 6 : 36-40
Ferry, R.L. and B.B. Singh. 1997. Cowpea genetic: a review of the recent literature. In Advance in Cowpea Research. Edited by by B.B. Singh, D.R. Mohan Raj, K.E. Dashiell and L.E.N. Jackai. IITA, Ibadan, Nigeria. p.13-29.
Gallacher, D.. 1999. Yardlong bean. Central Queensland University, Australia. pp.7. Kasno, A. 1992. Pemuliaan tanaman
kacang-kacangan. Dalam Prosiding Simposium Pemuliaan Tanaman I. (Ed. A.Kasno et al..) PPTI Jawa Timur. p.39-69.
Kasno, A., Trustinah, Moedjiono and N. Saleh. 2000. perbaikan hasil, mutu hasil dan ketahanan varietas kacang panjang terhadap CAMV melalui seleksi galur pada populasi alam. Balitkabi, Malang. pp. 8.
Kuswanto, B. Waluyo, L. Soetopo and A. Afandhi. 2007. Evaluasi Keragaman Genetik Toleransi Kacang Panjang (Vigna sesquipedalis (l). Fruwirth) terhadap Hama Aphid. Agrosia Edisi Khusus (1): 19-25.
Kuswanto, Lita Soetopo, Aminuddin Afandhi dan Budi Waluyo. 2007. Pendugaan Jumlah dan Peran Gen Toleransi Kacang Panjang (Vigna sesquipedalis L. Fruwirth) terhadap Hama Aphid. Agrivita, 29(1): 46-52.
Kuswanto, B. Waluyo, L. Soetopo and A. Afandhi. 2008. Perakitan varietas tanaman kacang panjang toleran hama aphid dan berdaya hasil tinggi, Laporan Penelitian Hibah Bersaing, Universitas Brawijaya, Malang. pp.55.
Nenno, M.. 2000. General Nomenclature in Grin for Vigna. GRIN Taxonomy, USDA, USA Prabaningrum, L. 1996. Kehilangan hasil panen
Rahmaningtyas, L.W. 2008. Pendugaan ke-ragaman genetik 120 galur kacang panjang toleran hama aphid, Skripsi, Fak. Pertanian Univ. Brawijaya, Malang. pp.60.
Saleh, N, H. Ariawan, T. Hadiastono dan S. Djauhari. 1993. Pengaruh saat infeksi CAMV terhadap pertumbuhan, hasil dan komponen hasil tiga varietas kacang tunggak. Dalam Risalah Seminar Hasil Penelitian Tanaman Pangan Tahun 1992. (Ed. A. Kasno et al..) Balittan, Malang.
Singh R.K. and B.D. Chaudhary. 1979. Bio-metrical methods in quantitative genetic analysis. Kalyani Publishers, Ludhiana New Delhi. pp. 268.
Soemartono dan Nasrullah. 1988. Genetika Kuantitatif. PAU Bioteknologi Universitas Gadjah Mada, Yogyakarta Redjeki, E.S. 2005. Uji adaptasi galur-galur